Warwick Airbnb Market Analysis 2026: Short Term Rental Data & Vacation Rental Statistics in Warwick Parish, Bermuda
Is Airbnb profitable in Warwick in 2026? Explore comprehensive Airbnb analytics for Warwick, Warwick Parish, Bermuda to uncover income potential. This 2026 STR market report for Warwick, based on AirROI data from February 2025 to January 2026, reveals key trends in the niche market of 34 active listings.
Whether you're considering an Airbnb investment in Warwick, optimizing your existing vacation rental, or exploring rental arbitrage opportunities, understanding the Warwick Airbnb data is crucial. Leveraging the low regulation environment is key to maximizing your short term rental income potential. Let's dive into the specifics.
Key Warwick Airbnb Performance Metrics Overview
Monthly Airbnb Revenue Variations & Income Potential in Warwick (2026)
Understanding the monthly revenue variations for Airbnb listings in Warwick is key to maximizing your short term rental income potential. Seasonality significantly impacts earnings. Our analysis, based on data from the past 12 months, shows that the peak revenue month for STRs in Warwick is typically July, while January often presents the lowest earnings, highlighting opportunities for strategic pricing adjustments during shoulder and low seasons. Explore the typical Airbnb income in Warwick across different performance tiers:
- Best-in-class properties (Top 10%) achieve $10,825+ monthly, often utilizing dynamic pricing and superior guest experiences.
- Strong performing properties (Top 25%) earn $6,287 or more, indicating effective management and desirable locations/amenities.
- Typical properties (Median) generate around $3,681 per month, representing the average market performance.
- Entry-level properties (Bottom 25%) see earnings around $2,291, often with potential for optimization.
Average Monthly Airbnb Earnings Trend in Warwick
Warwick Airbnb Occupancy Rate Trends (2026)
Maximize your bookings by understanding the Warwick STR occupancy trends. Seasonal demand shifts significantly influence how often properties are booked. Typically, Julysees the highest demand (peak season occupancy), while December experiences the lowest (low season). Effective strategies, like adjusting minimum stays or offering promotions, can boost occupancy during slower periods. Here's how different property tiers perform in Warwick:
- Best-in-class properties (Top 10%) achieve 85%+ occupancy, indicating high desirability and potentially optimized availability.
- Strong performing properties (Top 25%) maintain 70% or higher occupancy, suggesting good market fit and guest satisfaction.
- Typical properties (Median) have an occupancy rate around 50%.
- Entry-level properties (Bottom 25%) average 28% occupancy, potentially facing higher vacancy.
Average Monthly Occupancy Rate Trend in Warwick
Average Daily Rate (ADR) Airbnb Trends in Warwick (2026)
Effective short term rental pricing strategy in Warwick involves understanding monthly ADR fluctuations. The Average Daily Rate (ADR) for Airbnb in Warwick typically peaks in July and dips lowest during February. Leveraging Airbnb dynamic pricing tools or strategies based on this seasonality can significantly boost revenue. Here's a look at the typical nightly rates achieved:
- Best-in-class properties (Top 10%) command rates of $620+ per night, often due to premium features or locations.
- Strong performing properties (Top 25%) achieve nightly rates of $338 or more.
- Typical properties (Median) charge around $235 per night.
- Entry-level properties (Bottom 25%) earn around $167 per night.
Average Daily Rate (ADR) Trend by Month in Warwick
Get Live Warwick Market Intelligence 👇

Explore Real-time Analytics
Airbnb Seasonality Analysis & Trends in Warwick (2026)
Peak Season (July, May, June)
- Revenue averages $7,137 per month
- Occupancy rates average 61.6%
- Daily rates average $333
Shoulder Season
- Revenue averages $4,937 per month
- Occupancy maintains around 49.4%
- Daily rates hold near $312
Low Season (January, February, December)
- Revenue drops to average $2,789 per month
- Occupancy decreases to average 39.0%
- Daily rates adjust to average $294
Seasonality Insights for Warwick
- The Airbnb seasonality in Warwick shows highly seasonal trends requiring careful strategy. While the sections above show seasonal averages, it's also insightful to look at the extremes:
- During the high season, the absolute peak month showcases Warwick's highest earning potential, with monthly revenues capable of climbing to $7,539, occupancy reaching a high of 67.9%, and ADRs peaking at $336.
- Conversely, the slowest single month of the year, typically falling within the low season, marks the market's lowest point. In this month, revenue might dip to $2,301, occupancy could drop to 33.9%, and ADRs may adjust down to $284.
- Understanding both the seasonal averages and these monthly peaks and troughs in revenue, occupancy, and ADR is crucial for maximizing your Airbnb profit potential in Warwick.
Seasonal Strategies for Maximizing Profit
- Peak Season: Maximize revenue through premium pricing and potentially longer minimum stays. Ensure high availability.
- Low Season: Offer competitive pricing, special promotions (e.g., extended stay discounts), and flexible cancellation policies. Target off-season travelers like remote workers or budget-conscious guests.
- Shoulder Seasons: Implement dynamic pricing that balances peak and low rates. Target weekend travelers or specific events. Offer slightly more flexible terms than peak season.
- Regularly analyze your own performance against these Warwick seasonality benchmarks and adjust your pricing and availability strategy accordingly.
Best Areas for Airbnb Investment in Warwick (2026)
Exploring the top neighborhoods for short-term rentals in Warwick? This section highlights key areas, outlining why they are attractive for hosts and guests, along with notable local attractions. Consider these locations based on your target guest profile and investment strategy.
| Neighborhood / Area | Why Host Here? (Target Guests & Appeal) | Key Attractions & Landmarks |
|---|---|---|
| Southampton | A picturesque area known for its stunning beaches and historic sites. It's a favorite among tourists looking for a peaceful getaway with lots of outdoor activities. | Horseshoe Bay Beach, Church Bay Beach, Gibb's Hill Lighthouse, Southampton Princess, The Royal Naval Dockyard |
| Hamilton | The capital city of Bermuda, Hamilton is a vibrant hub for culture, shopping, and dining. Ideal for travelers looking for a mix of urban life and island charm. | Hamilton Harbour, Bermuda National Gallery, Front Street, Par-la-Ville Park, The Bermuda Underwater Exploration Institute |
| St. George's | A UNESCO World Heritage site, St. George's offers rich history and charm, making it a great place for tourists interested in Bermuda's colonial past. | St. George's Town, Fort St. Catherine, Tobacco Bay, The Old State House, The Bermuda Perfumery |
| Warwick Long Bay | Known for its beautiful beaches and crystal-clear waters, Warwick Long Bay is perfect for relaxation and enjoying the sun, attracting beach lovers and families. | Warwick Long Bay Beach, Jobson's Cove, Shark Hole, Warwick Parish Church |
| Paget | Adjacent to Hamilton, Paget offers a quieter residential atmosphere with easy access to the capital. It's ideal for those who want a balance of tranquility and city life. | Botanical Gardens, Elbow Beach, The Tropical Gardens, Paget Marsh |
| Somerset Village | A charming spot with a local feel, Somerset Village is close to beautiful beaches and offers a unique glimpse into Bermudian life. | Somerset Long Bay, The Railway Trail, Boat rentals, Somerset Bridge |
| North Shore | This area is less touristy and offers stunning views of the ocean. It's perfect for visitors looking for adventure and natural beauty. | Coves and beaches, Snorkeling spots, Scenic walking trails, The North Shore Park |
| Tobacco Bay | Famous for its scenic beauty and water sports, Tobacco Bay attracts visitors who enjoy snorkeling and kayaking, making it an active vacation spot. | Tobacco Bay Beach, Snorkeling activities, Beach bars, Nearby caves |
Understanding Airbnb License Requirements & STR Laws in Warwick (2026)
While Warwick, Warwick Parish, Bermuda currently shows low STR regulations, specific Airbnb license requirements might still exist or change. Always verify the latest short term rental regulations and Airbnb license requirements directly with local government authorities for Warwick to ensure full compliance before hosting.
(Source: AirROI data, 2026, finding no licensed listings among those analyzed)
Top Performing Airbnb Properties in Warwick (2026)
Benchmark your potential! Explore examples of top-performing Airbnb properties in Warwickbased on Trailing Twelve Month (TTM) revenue. Analyze their characteristics, revenue, occupancy rate, and ADR to understand what drives success in this market.
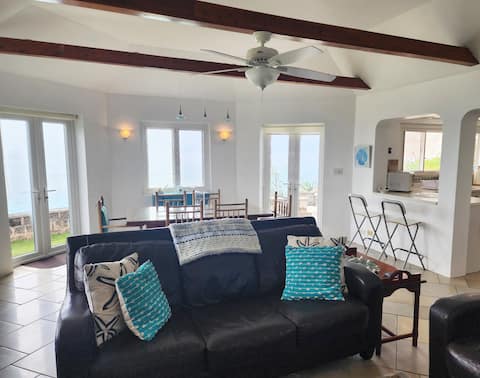
Sea Song 3 Bdrm sleeps 7 on private Marley Beach
Entire Place • 3 bedrooms

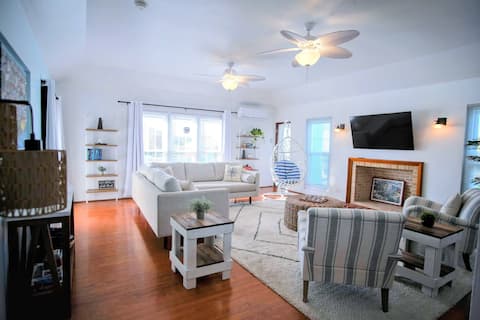
Tropical Estate, Large 4 Bedroom, Views
Entire Place • 4 bedrooms

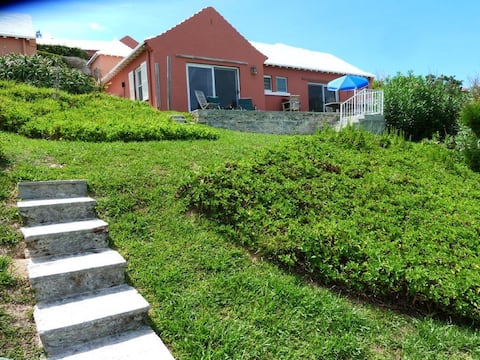
Great Location, 4 bedroom, Private Home
Entire Place • 4 bedrooms
Bermuda Blue Horizon Apartment
Entire Place • 3 bedrooms

Private Beach & Pool - 1 bed at Cliffs of Marley
Entire Place • 1 bedroom
Sand Dollar Cottage 2 Bdrm on private Marley Beach
Entire Place • 2 bedrooms
Note: Performance varies based on location, size, amenities, seasonality, and management quality. Data reflects the past 12 months.
Top Performing Airbnb Hosts in Warwick (2026)
Learn from the best! This table showcases top-performing Airbnb hosts in Warwick based on the number of properties managed and estimated total revenue over the past year. Analyze their scale and performance metrics.
| Host Name | Properties | Grossing Revenue | Stay Reviews | Avg Rating |
|---|---|---|---|---|
| Stephen | 2 | $231,660 | 94 | 4.92/5.0 |
| Malcolm | 3 | $226,146 | 264 | 4.96/5.0 |
| Sarah | 3 | $173,342 | 296 | 4.91/5.0 |
| Crystal | 1 | $138,532 | 51 | 4.59/5.0 |
| Exclusive Island Rentals | 1 | $125,733 | 71 | 4.69/5.0 |
| Exclusive Island Rentals | 2 | $87,559 | 30 | 4.89/5.0 |
| Carol And Michael | 2 | $85,229 | 164 | 4.80/5.0 |
| Carolyn | 1 | $81,165 | 260 | 4.88/5.0 |
| Mike | 2 | $70,692 | 448 | 4.88/5.0 |
| Nicola | 1 | $68,396 | 32 | 5.00/5.0 |
Analyzing the strategies of top hosts, such as their property selection, pricing, and guest communication, can offer valuable lessons for optimizing your own Airbnb operations in Warwick.
Dive Deeper: Advanced Warwick STR Market Data (2026)
Ready to unlock more insights? AirROI provides access to advanced metrics and comprehensive Airbnb data for Warwick. Explore detailed analytics beyond this report to refine your investment strategy, optimize pricing, and maximize your vacation rental profits.
Explore Advanced MetricsWarwick Short-Term Rental Market Composition (2026): Property & Room Types
Room Type Distribution
Property Type Distribution
Market Composition Insights for Warwick
- The Warwick Airbnb market composition is heavily skewed towards Entire Home/Apt listings, which make up 88.2% of the 34 active rentals. This indicates strong guest preference for privacy and space.
- Looking at the property type distribution in Warwick, Apartment/Condo properties are the most common (50%), reflecting the local real estate landscape.
- Houses represent a significant 41.2% portion, catering likely to families or larger groups.
- Smaller segments like hotel/boutique (combined 2.9%) offer potential for unique stay experiences.
Warwick Airbnb Room Capacity Analysis (2026): Bedroom Distribution
Distribution of Listings by Number of Bedrooms
Room Capacity Insights for Warwick
- The dominant room capacity in Warwick is 1 bedroom listings, making up 38.2% of the market. This suggests a strong demand for properties suitable for couples or solo travelers.
- Together, 1 bedroom and 2 bedrooms properties represent 55.8% of the active Airbnb listings in Warwick, indicating a high concentration in these sizes.
- A significant 20.6% of listings offer 3+ bedrooms, catering to larger groups and families seeking more space in Warwick.
Warwick Vacation Rental Guest Capacity Trends (2026)
Distribution of Listings by Guest Capacity
Guest Capacity Insights for Warwick
- The most common guest capacity trend in Warwick vacation rentals is listings accommodating 2 guests (44.1%). This suggests the primary traveler segment is likely couples or solo travelers.
- Properties designed for 2 guests and 3 guests dominate the Warwick STR market, accounting for 55.9% of listings.
- A significant 44.1% of listings cater specifically to 1-2 guests, highlighting strong demand from couples and solo travelers in Warwick.
- 26.5% of properties accommodate 6+ guests, serving the market segment for larger families or group travel in Warwick.
- On average, properties in Warwick are equipped to host 3.7 guests.
Warwick Airbnb Booking Patterns (2026): Available vs. Booked Days
Available Days Distribution
Booked Days Distribution
Booking Pattern Insights for Warwick
- The most common availability pattern in Warwick falls within the 181-270 days range, representing 52.9% of listings. This suggests many properties have significant open periods on their calendars.
- Approximately 67.6% of listings show high availability (181+ days open annually), indicating potential for increased bookings or specific owner usage patterns.
- For booked days, the 91-180 days range is most frequent in Warwick (52.9%), reflecting common guest stay durations or potential owner blocking patterns.
- A notable 35.3% of properties secure long booking periods (181+ days booked per year), highlighting successful long-term rental strategies or significant owner usage.
Warwick Airbnb Minimum Stay Requirements Analysis
Distribution of Listings by Minimum Night Requirement
1 Night
3 listings
8.8% of total
2 Nights
3 listings
8.8% of total
3 Nights
15 listings
44.1% of total
4-6 Nights
3 listings
8.8% of total
7-29 Nights
1 listings
2.9% of total
30+ Nights
9 listings
26.5% of total
Key Insights
- The most prevalent minimum stay requirement in Warwick is 3 Nights, adopted by 44.1% of listings. This highlights the market's preference for longer commitments.
- Very short stays (1-2 nights) are less common (17.6%), suggesting hosts prefer slightly longer bookings to optimize turnover.
- A significant segment (26.5%) caters to monthly stays (30+ nights) in Warwick, pointing to opportunities in the extended-stay market.
Recommendations
- Align with the market by considering a 3 Nights minimum stay, as 44.1% of Warwick hosts use this setting.
- If feasible, allowing 1-night stays, especially midweek or during low season, could capture last-minute bookings, as only 8.8% currently do.
- Explore offering discounts for stays of 30+ nights to attract the 26.5% of the market seeking extended stays.
- Adjust minimum nights based on seasonality – potentially shorter during low season and longer during peak demand periods in Warwick.
Warwick Airbnb Cancellation Policy Trends Analysis (2026)
Flexible
1 listings
2.9% of total
Moderate
5 listings
14.7% of total
Firm
16 listings
47.1% of total
Strict
12 listings
35.3% of total
Cancellation Policy Insights for Warwick
- The prevailing Airbnb cancellation policy trend in Warwick is Firm, used by 47.1% of listings.
- A majority (82.4%) of hosts in Warwick utilize Firm or Strict policies, indicating a market where hosts prioritize booking security.
Recommendations for Hosts
- Consider adopting a Firm policy to align with the 47.1% market standard in Warwick.
- With 35.3% using Strict terms, this is a viable option in Warwick, particularly for high-value properties or during peak demand periods.
- Regularly review your cancellation policy against competitors and market demand shifts in Warwick.
Warwick STR Booking Lead Time Analysis (2026)
Average Booking Lead Time by Month
Booking Lead Time Insights for Warwick
- The overall average booking lead time for vacation rentals in Warwick is 68 days.
- Guests book furthest in advance for stays during May (average 90 days), likely coinciding with peak travel demand or local events.
- The shortest booking windows occur for stays in March (average 36 days), indicating more last-minute travel plans during this time.
- Seasonally, Summer (84 days avg.) sees the longest lead times, while Fall (54 days avg.) has the shortest, reflecting typical travel planning cycles.
Recommendations for Hosts
- Use the overall average lead time (68 days) as a baseline for your pricing and availability strategy in Warwick.
- For May stays, consider implementing length-of-stay discounts or slightly higher rates for bookings made less than 90 days out to capitalize on advance planning.
- Target marketing efforts for the Summer season well in advance (at least 84 days) to capture early planners.
- Monitor your own booking lead times against these Warwick averages to identify opportunities for dynamic pricing adjustments.
Popular & Essential Airbnb Amenities in Warwick (2026)
Amenity Prevalence
Amenity Insights for Warwick
- Essential amenities in Warwick that guests expect include: TV, Air conditioning, Wifi. Lacking these (any) could significantly impact bookings.
- Popular amenities like Free parking on premises, Iron, Kitchen are common but not universal. Offering these can provide a competitive edge.
Recommendations for Hosts
- Ensure your listing includes all essential amenities for Warwick: TV, Air conditioning, Wifi.
- Consider adding popular differentiators like Free parking on premises or Iron to increase appeal.
- Highlight unique or less common amenities you offer (e.g., hot tub, dedicated workspace, EV charger) in your listing description and photos.
- Regularly check competitor amenities in Warwick to stay competitive.
Warwick Airbnb Guest Demographics & Profile Analysis (2026)
Guest Profile Summary for Warwick
- The typical guest profile for Airbnb in Warwick consists of predominantly international visitors (99%), with top international origins including Canada, typically belonging to the Post-2000s (Gen Z/Alpha) group (50%), primarily speaking English or Spanish.
- Domestic travelers account for 1.4% of guests.
- Key international markets include United States (65.9%) and Canada (15.2%).
- Top languages spoken are English (61.1%) followed by Spanish (14.5%).
- A significant demographic segment is the Post-2000s (Gen Z/Alpha) group, representing 50% of guests.
Recommendations for Hosts
- Focus marketing internationally, particularly towards travelers from Canada.
- Tailor amenities and listing descriptions to appeal to the dominant Post-2000s (Gen Z/Alpha) demographic (e.g., highlight fast WiFi, smart home features, local guides).
- Highlight unique local experiences or amenities relevant to the primary guest profile.
- Consider seasonal promotions aligned with peak travel times for key origin markets.
Nearby Short-Term Rental Market Comparison
How does the Warwick Airbnb market stack up against its neighbors? Compare key performance metrics like average monthly revenue, ADR, and occupancy rates in surrounding areas to understand the broader regional STR landscape.
| Market | Active Properties | Monthly Revenue | Daily Rate | Avg. Occupancy |
|---|---|---|---|---|
| Southampton | 41 | $5,984 | $466.24 | 49% |
| Hamilton | 23 | $5,706 | $693.47 | 50% |
| Town of St. George | 14 | $5,330 | $241.33 | 72% |
| Somerset | 30 | $5,006 | $448.41 | 49% |
| Royal Naval Dockyard | 12 | $4,304 | $538.73 | 40% |
| Spanish Point | 19 | $4,214 | $247.41 | 66% |
| North Shore Village | 11 | $3,987 | $218.55 | 65% |
| Paget Parish | 11 | $3,957 | $330.52 | 61% |
| Southampton Parish | 11 | $3,870 | $308.42 | 50% |
| Smiths | 24 | $3,694 | $384.44 | 57% |