Uyuni Airbnb Market Analysis 2026: Short Term Rental Data & Vacation Rental Statistics in Potosí, Bolivia
Is Airbnb profitable in Uyuni in 2026? Explore comprehensive Airbnb analytics for Uyuni, Potosí, Bolivia to uncover income potential. This 2026 STR market report for Uyuni, based on AirROI data from February 2025 to January 2026, reveals key trends in the niche market of 42 active listings.
Whether you're considering an Airbnb investment in Uyuni, optimizing your existing vacation rental, or exploring rental arbitrage opportunities, understanding the Uyuni Airbnb data is crucial. Leveraging the low regulation environment is key to maximizing your short term rental income potential. Let's dive into the specifics.
Key Uyuni Airbnb Performance Metrics Overview
Monthly Airbnb Revenue Variations & Income Potential in Uyuni (2026)
Understanding the monthly revenue variations for Airbnb listings in Uyuni is key to maximizing your short term rental income potential. Seasonality significantly impacts earnings. Our analysis, based on data from the past 12 months, shows that the peak revenue month for STRs in Uyuni is typically February, while June often presents the lowest earnings, highlighting opportunities for strategic pricing adjustments during shoulder and low seasons. Explore the typical Airbnb income in Uyuni across different performance tiers:
- Best-in-class properties (Top 10%) achieve $1,240+ monthly, often utilizing dynamic pricing and superior guest experiences.
- Strong performing properties (Top 25%) earn $797 or more, indicating effective management and desirable locations/amenities.
- Typical properties (Median) generate around $400 per month, representing the average market performance.
- Entry-level properties (Bottom 25%) see earnings around $195, often with potential for optimization.
Average Monthly Airbnb Earnings Trend in Uyuni
Uyuni Airbnb Occupancy Rate Trends (2026)
Maximize your bookings by understanding the Uyuni STR occupancy trends. Seasonal demand shifts significantly influence how often properties are booked. Typically, Februarysees the highest demand (peak season occupancy), while June experiences the lowest (low season). Effective strategies, like adjusting minimum stays or offering promotions, can boost occupancy during slower periods. Here's how different property tiers perform in Uyuni:
- Best-in-class properties (Top 10%) achieve 60%+ occupancy, indicating high desirability and potentially optimized availability.
- Strong performing properties (Top 25%) maintain 43% or higher occupancy, suggesting good market fit and guest satisfaction.
- Typical properties (Median) have an occupancy rate around 23%.
- Entry-level properties (Bottom 25%) average 12% occupancy, potentially facing higher vacancy.
Average Monthly Occupancy Rate Trend in Uyuni
Average Daily Rate (ADR) Airbnb Trends in Uyuni (2026)
Effective short term rental pricing strategy in Uyuni involves understanding monthly ADR fluctuations. The Average Daily Rate (ADR) for Airbnb in Uyuni typically peaks in March and dips lowest during November. Leveraging Airbnb dynamic pricing tools or strategies based on this seasonality can significantly boost revenue. Here's a look at the typical nightly rates achieved:
- Best-in-class properties (Top 10%) command rates of $128+ per night, often due to premium features or locations.
- Strong performing properties (Top 25%) achieve nightly rates of $76 or more.
- Typical properties (Median) charge around $51 per night.
- Entry-level properties (Bottom 25%) earn around $39 per night.
Average Daily Rate (ADR) Trend by Month in Uyuni
Get Live Uyuni Market Intelligence 👇

Explore Real-time Analytics
Airbnb Seasonality Analysis & Trends in Uyuni (2026)
Peak Season (February, March, July)
- Revenue averages $1,043 per month
- Occupancy rates average 39.5%
- Daily rates average $84
Shoulder Season
- Revenue averages $628 per month
- Occupancy maintains around 28.6%
- Daily rates hold near $78
Low Season (May, June, November)
- Revenue drops to average $505 per month
- Occupancy decreases to average 20.8%
- Daily rates adjust to average $80
Seasonality Insights for Uyuni
- The Airbnb seasonality in Uyuni shows highly seasonal trends requiring careful strategy. While the sections above show seasonal averages, it's also insightful to look at the extremes:
- During the high season, the absolute peak month showcases Uyuni's highest earning potential, with monthly revenues capable of climbing to $1,147, occupancy reaching a high of 49.5%, and ADRs peaking at $87.
- Conversely, the slowest single month of the year, typically falling within the low season, marks the market's lowest point. In this month, revenue might dip to $469, occupancy could drop to 19.4%, and ADRs may adjust down to $73.
- Understanding both the seasonal averages and these monthly peaks and troughs in revenue, occupancy, and ADR is crucial for maximizing your Airbnb profit potential in Uyuni.
Seasonal Strategies for Maximizing Profit
- Peak Season: Maximize revenue through premium pricing and potentially longer minimum stays. Ensure high availability.
- Low Season: Offer competitive pricing, special promotions (e.g., extended stay discounts), and flexible cancellation policies. Target off-season travelers like remote workers or budget-conscious guests.
- Shoulder Seasons: Implement dynamic pricing that balances peak and low rates. Target weekend travelers or specific events. Offer slightly more flexible terms than peak season.
- Regularly analyze your own performance against these Uyuni seasonality benchmarks and adjust your pricing and availability strategy accordingly.
Best Areas for Airbnb Investment in Uyuni (2026)
Exploring the top neighborhoods for short-term rentals in Uyuni? This section highlights key areas, outlining why they are attractive for hosts and guests, along with notable local attractions. Consider these locations based on your target guest profile and investment strategy.
| Neighborhood / Area | Why Host Here? (Target Guests & Appeal) | Key Attractions & Landmarks |
|---|---|---|
| Uyuni Town Center | The heart of Uyuni, close to the train station and shops. Ideal for tourists visiting the Salar de Uyuni and offers easy access to tours and services. | Salar de Uyuni, Train Graveyard, Plaza Arce, Casa de la Moneda, Village Tours |
| Salar de Uyuni | Unique natural landscape that attracts tourists worldwide for its stunning views and photography opportunities. Perfect for eco-tourism and unique Airbnb experiences. | Salt Flats, Isla Incahuasi, Ojos de Sal, Fish Island, Sunsets |
| Calle Colorada | Vibrant street in Uyuni known for its cafes and artisan shops, it attracts backpackers and tourists looking for local culture. | Artisan Markets, Cafes, Restaurants, Local Tours |
| Laguna Colorada | Famous for its red lagoon and flamingos, offering unique experiences for those looking to explore Bolivia's natural beauty. | Laguna Colorada, Flamingo Viewing, Geothermal Fields, Hiking |
| Pueblo de Colchani | Small village near Uyuni where tourists can experience traditional salt processing and workshops, attracting those interested in local culture. | Salt Processing Workshops, Local Crafts, Cultural Tours, Sunset Views |
| Eduardo Avaroa National Park | A major national park attracting adventurers for its stunning landscapes and wildlife, popular among tourists seeking nature exploration. | National Park Tours, Wildlife Viewing, Trekking, Photography Opportunities |
| Cactus Island (Isla Incahuasi) | A tourist hotspot known for its giant cacti and breathtaking views over the salt flats, perfect for memorable excursions. | Cactus Forest, Panoramic Views, Photography Spots, Hiking |
| Laguna Verde | Famous for its striking green lake and scenic beauty, attracting nature lovers and those seeking unique experiences amidst Bolivia's landscapes. | Laguna Verde Views, Hot Springs, Camping, Treks |
Understanding Airbnb License Requirements & STR Laws in Uyuni (2026)
While Uyuni, Potosí, Bolivia currently shows low STR regulations, specific Airbnb license requirements might still exist or change. Always verify the latest short term rental regulations and Airbnb license requirements directly with local government authorities for Uyuni to ensure full compliance before hosting.
(Source: AirROI data, 2026, finding no licensed listings among those analyzed)
Top Performing Airbnb Properties in Uyuni (2026)
Benchmark your potential! Explore examples of top-performing Airbnb properties in Uyunibased on Trailing Twelve Month (TTM) revenue. Analyze their characteristics, revenue, occupancy rate, and ADR to understand what drives success in this market.
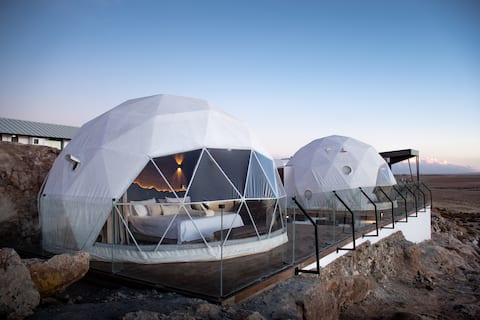
Glamping Uyuni Deluxe
Entire Place • 1 bedroom
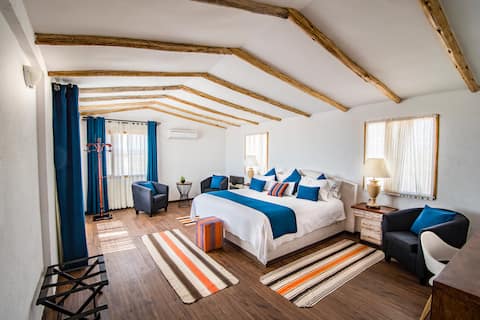
Family Suite
Private Room • 1 bedroom
Deluxe Twin room w/sunrise view
Private Room • 1 bedroom

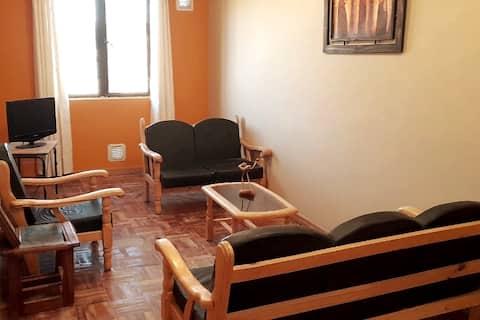
Twin Room with Private Bathroom. Cagnapa Restobar
Private Room • 1 bedroom
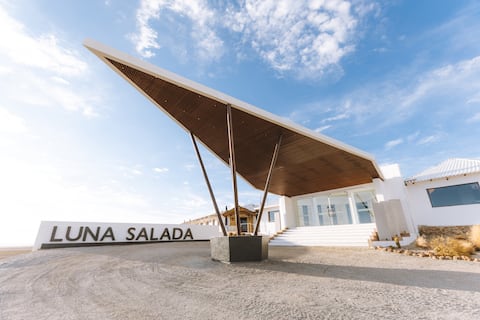
Luna Apartment
Entire Place • 3 bedrooms

Sun Apartment
Entire Place • 2 bedrooms
Note: Performance varies based on location, size, amenities, seasonality, and management quality. Data reflects the past 12 months.
Top Performing Airbnb Hosts in Uyuni (2026)
Learn from the best! This table showcases top-performing Airbnb hosts in Uyuni based on the number of properties managed and estimated total revenue over the past year. Analyze their scale and performance metrics.
| Host Name | Properties | Grossing Revenue | Stay Reviews | Avg Rating |
|---|---|---|---|---|
| Gabriel | 4 | $99,863 | 7 | Not Rated |
| Adalid | 7 | $63,270 | 329 | 4.88/5.0 |
| Onkel | 8 | $28,931 | 275 | 4.51/5.0 |
| Maria Luisa | 3 | $25,007 | 22 | 4.96/5.0 |
| Juan Carlos | 5 | $15,383 | 115 | 4.48/5.0 |
| Gloria | 3 | $10,898 | 57 | 4.58/5.0 |
| La Maison | 7 | $7,064 | 43 | 4.26/5.0 |
| Daniel Cusi | 1 | $2,347 | 11 | 4.91/5.0 |
| Osvaldo | 2 | $1,279 | 49 | 4.31/5.0 |
| Jhonny | 1 | $785 | 2 | Not Rated |
Analyzing the strategies of top hosts, such as their property selection, pricing, and guest communication, can offer valuable lessons for optimizing your own Airbnb operations in Uyuni.
Dive Deeper: Advanced Uyuni STR Market Data (2026)
Ready to unlock more insights? AirROI provides access to advanced metrics and comprehensive Airbnb data for Uyuni. Explore detailed analytics beyond this report to refine your investment strategy, optimize pricing, and maximize your vacation rental profits.
Explore Advanced MetricsUyuni Short-Term Rental Market Composition (2026): Property & Room Types
Room Type Distribution
Property Type Distribution
Market Composition Insights for Uyuni
- The Uyuni Airbnb market composition is heavily skewed towards Private Room listings, which make up 61.9% of the 42 active rentals. This indicates strong guest preference for privacy and space.
- Looking at the property type distribution in Uyuni, Hotel/Boutique properties are the most common (54.8%), reflecting the local real estate landscape.
- The presence of 54.8% Hotel/Boutique listings indicates integration with traditional hospitality.
- Smaller segments like house, unique stays (combined 9.6%) offer potential for unique stay experiences.
Uyuni Airbnb Room Capacity Analysis (2026): Bedroom Distribution
Distribution of Listings by Number of Bedrooms
Room Capacity Insights for Uyuni
- The dominant room capacity in Uyuni is 1 bedroom listings, making up 61.9% of the market. This suggests a strong demand for properties suitable for couples or solo travelers.
- Together, 1 bedroom and 2 bedrooms properties represent 83.3% of the active Airbnb listings in Uyuni, indicating a high concentration in these sizes.
- With over half the market (61.9%) consisting of studios or 1-bedroom units, Uyuni is particularly well-suited for individuals or couples.
- Listings with 3+ bedrooms (7.2%) represent a smaller niche, potentially indicating an underserved market for larger group accommodations in Uyuni.
Uyuni Vacation Rental Guest Capacity Trends (2026)
Distribution of Listings by Guest Capacity
Guest Capacity Insights for Uyuni
- The most common guest capacity trend in Uyuni vacation rentals is listings accommodating 2 guests (45.2%). This suggests the primary traveler segment is likely couples or solo travelers.
- Properties designed for 2 guests and 4 guests dominate the Uyuni STR market, accounting for 61.9% of listings.
- A significant 50.0% of listings cater specifically to 1-2 guests, highlighting strong demand from couples and solo travelers in Uyuni.
- Listings for large groups (6+ guests) are relatively rare (2.4%), potentially indicating an opportunity for hosts targeting this segment in Uyuni.
- On average, properties in Uyuni are equipped to host 2.7 guests.
Uyuni Airbnb Booking Patterns (2026): Available vs. Booked Days
Available Days Distribution
Booked Days Distribution
Booking Pattern Insights for Uyuni
- The most common availability pattern in Uyuni falls within the 271-366 days range, representing 71.4% of listings. This suggests many properties have significant open periods on their calendars.
- Approximately 88.1% of listings show high availability (181+ days open annually), indicating potential for increased bookings or specific owner usage patterns.
- For booked days, the 31-90 days range is most frequent in Uyuni (35.7%), reflecting common guest stay durations or potential owner blocking patterns.
- A notable 14.3% of properties secure long booking periods (181+ days booked per year), highlighting successful long-term rental strategies or significant owner usage.
Uyuni Airbnb Minimum Stay Requirements Analysis
Distribution of Listings by Minimum Night Requirement
1 Night
41 listings
97.6% of total
30+ Nights
1 listings
2.4% of total
Key Insights
- The most prevalent minimum stay requirement in Uyuni is 1 Night, adopted by 97.6% of listings. This highlights the market's preference for shorter, flexible bookings.
- A strong majority (97.6%) of the Uyuni Airbnb data shows acceptance of very short stays (1-2 nights), indicating a dynamic, high-turnover market.
- Dedicated monthly rentals (30+ nights) represent a small niche (2.4%), possibly an untapped area for hosts.
Recommendations
- Align with the market by considering a 1 Night minimum stay, as 97.6% of Uyuni hosts use this setting.
- Adjust minimum nights based on seasonality – potentially shorter during low season and longer during peak demand periods in Uyuni.
Uyuni Airbnb Cancellation Policy Trends Analysis (2026)
Flexible
25 listings
59.5% of total
Moderate
12 listings
28.6% of total
Firm
2 listings
4.8% of total
Strict
3 listings
7.1% of total
Cancellation Policy Insights for Uyuni
- The prevailing Airbnb cancellation policy trend in Uyuni is Flexible, used by 59.5% of listings.
- The market strongly favors guest-friendly terms, with 88.1% of listings offering Flexible or Moderate policies. This suggests guests in Uyuni may expect booking flexibility.
- Strict cancellation policies are quite rare (7.1%), potentially making listings with this policy less competitive unless justified by high demand or property type.
Recommendations for Hosts
- Consider adopting a Flexible policy to align with the 59.5% market standard in Uyuni.
- Given the high prevalence of Flexible policies (59.5%), offering this can enhance booking appeal, especially during shoulder seasons.
- Using a Strict policy might deter some guests, as only 7.1% of listings use it. Evaluate if potential revenue protection outweighs possible lower booking rates.
- Regularly review your cancellation policy against competitors and market demand shifts in Uyuni.
Uyuni STR Booking Lead Time Analysis (2026)
Average Booking Lead Time by Month
Booking Lead Time Insights for Uyuni
- The overall average booking lead time for vacation rentals in Uyuni is 37 days.
- Guests book furthest in advance for stays during January (average 50 days), likely coinciding with peak travel demand or local events.
- The shortest booking windows occur for stays in February (average 20 days), indicating more last-minute travel plans during this time.
- Seasonally, Summer (47 days avg.) sees the longest lead times, while Spring (29 days avg.) has the shortest, reflecting typical travel planning cycles.
Recommendations for Hosts
- Use the overall average lead time (37 days) as a baseline for your pricing and availability strategy in Uyuni.
- For January stays, consider implementing length-of-stay discounts or slightly higher rates for bookings made less than 50 days out to capitalize on advance planning.
- Target marketing efforts for the Summer season well in advance (at least 47 days) to capture early planners.
- Monitor your own booking lead times against these Uyuni averages to identify opportunities for dynamic pricing adjustments.
Popular & Essential Airbnb Amenities in Uyuni (2026)
Amenity Prevalence
Amenity Insights for Uyuni
- Essential amenities in Uyuni that guests expect include: Wifi. Lacking these (this) could significantly impact bookings.
- Popular amenities like TV, Fire extinguisher, First aid kit are common but not universal. Offering these can provide a competitive edge.
Recommendations for Hosts
- Ensure your listing includes all essential amenities for Uyuni: Wifi.
- Consider adding popular differentiators like TV or Fire extinguisher to increase appeal.
- Highlight unique or less common amenities you offer (e.g., hot tub, dedicated workspace, EV charger) in your listing description and photos.
- Regularly check competitor amenities in Uyuni to stay competitive.
Uyuni Airbnb Guest Demographics & Profile Analysis (2026)
Guest Profile Summary for Uyuni
- The typical guest profile for Airbnb in Uyuni consists of predominantly international visitors (99%), with top international origins including Germany, typically belonging to the Post-2000s (Gen Z/Alpha) group (50%), primarily speaking English or Spanish.
- Domestic travelers account for 1.2% of guests.
- Key international markets include Brazil (12.5%) and Germany (11.7%).
- Top languages spoken are English (38.4%) followed by Spanish (24.9%).
- A significant demographic segment is the Post-2000s (Gen Z/Alpha) group, representing 50% of guests.
Recommendations for Hosts
- Focus marketing internationally, particularly towards travelers from Germany.
- Tailor amenities and listing descriptions to appeal to the dominant Post-2000s (Gen Z/Alpha) demographic (e.g., highlight fast WiFi, smart home features, local guides).
- Highlight unique local experiences or amenities relevant to the primary guest profile.
- Consider seasonal promotions aligned with peak travel times for key origin markets.
Nearby Short-Term Rental Market Comparison
How does the Uyuni Airbnb market stack up against its neighbors? Compare key performance metrics like average monthly revenue, ADR, and occupancy rates in surrounding areas to understand the broader regional STR landscape.
| Market | Active Properties | Monthly Revenue | Daily Rate | Avg. Occupancy |
|---|---|---|---|---|
| Tupiza | 16 | $165 | $33.96 | 30% |
| Potosí | 25 | $162 | $28.82 | 27% |
| Municipio Sucre | 255 | $160 | $28.59 | 28% |
| Sucre | 28 | $79 | $21.32 | 26% |