Mucuri Airbnb Market Analysis 2026: Short Term Rental Data & Vacation Rental Statistics in Bahia, Brazil
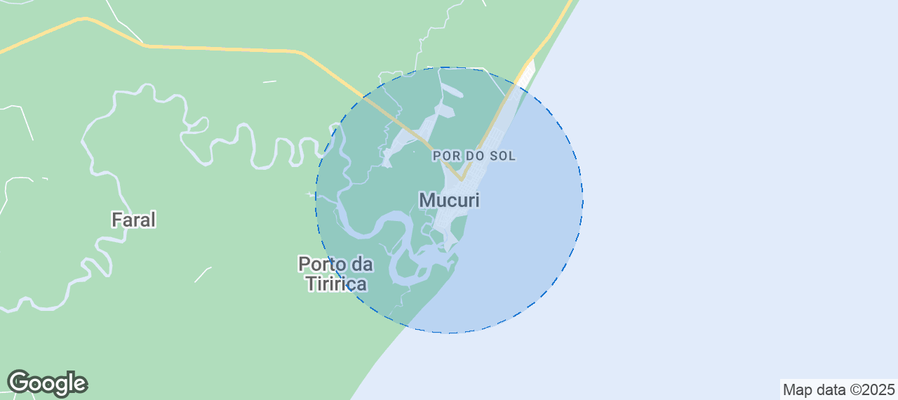
Is Airbnb profitable in Mucuri in 2026? Explore comprehensive Airbnb analytics for Mucuri, Bahia, Brazil to uncover income potential. This 2026 STR market report for Mucuri, based on AirROI data from February 2025 to January 2026, reveals key trends in the niche market of 42 active listings.
Whether you're considering an Airbnb investment in Mucuri, optimizing your existing vacation rental, or exploring rental arbitrage opportunities, understanding the Mucuri Airbnb data is crucial. Leveraging the low regulation environment is key to maximizing your short term rental income potential. Let's dive into the specifics.
Key Mucuri Airbnb Performance Metrics Overview
Monthly Airbnb Revenue Variations & Income Potential in Mucuri (2026)
Understanding the monthly revenue variations for Airbnb listings in Mucuri is key to maximizing your short term rental income potential. Seasonality significantly impacts earnings. Our analysis, based on data from the past 12 months, shows that the peak revenue month for STRs in Mucuri is typically January, while May often presents the lowest earnings, highlighting opportunities for strategic pricing adjustments during shoulder and low seasons. Explore the typical Airbnb income in Mucuri across different performance tiers:
- Best-in-class properties (Top 10%) achieve $1,074+ monthly, often utilizing dynamic pricing and superior guest experiences.
- Strong performing properties (Top 25%) earn $702 or more, indicating effective management and desirable locations/amenities.
- Typical properties (Median) generate around $340 per month, representing the average market performance.
- Entry-level properties (Bottom 25%) see earnings around $157, often with potential for optimization.
Average Monthly Airbnb Earnings Trend in Mucuri
Mucuri Airbnb Occupancy Rate Trends (2026)
Maximize your bookings by understanding the Mucuri STR occupancy trends. Seasonal demand shifts significantly influence how often properties are booked. Typically, Februarysees the highest demand (peak season occupancy), while May experiences the lowest (low season). Effective strategies, like adjusting minimum stays or offering promotions, can boost occupancy during slower periods. Here's how different property tiers perform in Mucuri:
- Best-in-class properties (Top 10%) achieve 60%+ occupancy, indicating high desirability and potentially optimized availability.
- Strong performing properties (Top 25%) maintain 33% or higher occupancy, suggesting good market fit and guest satisfaction.
- Typical properties (Median) have an occupancy rate around 19%.
- Entry-level properties (Bottom 25%) average 10% occupancy, potentially facing higher vacancy.
Average Monthly Occupancy Rate Trend in Mucuri
Average Daily Rate (ADR) Airbnb Trends in Mucuri (2026)
Effective short term rental pricing strategy in Mucuri involves understanding monthly ADR fluctuations. The Average Daily Rate (ADR) for Airbnb in Mucuri typically peaks in January and dips lowest during April. Leveraging Airbnb dynamic pricing tools or strategies based on this seasonality can significantly boost revenue. Here's a look at the typical nightly rates achieved:
- Best-in-class properties (Top 10%) command rates of $164+ per night, often due to premium features or locations.
- Strong performing properties (Top 25%) achieve nightly rates of $86 or more.
- Typical properties (Median) charge around $59 per night.
- Entry-level properties (Bottom 25%) earn around $42 per night.
Average Daily Rate (ADR) Trend by Month in Mucuri
Get Live Mucuri Market Intelligence 👇
Explore Real-time Analytics
Airbnb Seasonality Analysis & Trends in Mucuri (2026)
Peak Season (January, February, March)
- Revenue averages $759 per month
- Occupancy rates average 35.0%
- Daily rates average $86
Shoulder Season
- Revenue averages $508 per month
- Occupancy maintains around 24.9%
- Daily rates hold near $86
Low Season (May, June, November)
- Revenue drops to average $298 per month
- Occupancy decreases to average 19.0%
- Daily rates adjust to average $83
Seasonality Insights for Mucuri
- The Airbnb seasonality in Mucuri shows highly seasonal trends requiring careful strategy. While the sections above show seasonal averages, it's also insightful to look at the extremes:
- During the high season, the absolute peak month showcases Mucuri's highest earning potential, with monthly revenues capable of climbing to $805, occupancy reaching a high of 36.5%, and ADRs peaking at $95.
- Conversely, the slowest single month of the year, typically falling within the low season, marks the market's lowest point. In this month, revenue might dip to $261, occupancy could drop to 18.3%, and ADRs may adjust down to $80.
- Understanding both the seasonal averages and these monthly peaks and troughs in revenue, occupancy, and ADR is crucial for maximizing your Airbnb profit potential in Mucuri.
Seasonal Strategies for Maximizing Profit
- Peak Season: Maximize revenue through premium pricing and potentially longer minimum stays. Ensure high availability.
- Low Season: Offer competitive pricing, special promotions (e.g., extended stay discounts), and flexible cancellation policies. Target off-season travelers like remote workers or budget-conscious guests.
- Shoulder Seasons: Implement dynamic pricing that balances peak and low rates. Target weekend travelers or specific events. Offer slightly more flexible terms than peak season.
- Regularly analyze your own performance against these Mucuri seasonality benchmarks and adjust your pricing and availability strategy accordingly.
Best Areas for Airbnb Investment in Mucuri (2026)
Exploring the top neighborhoods for short-term rentals in Mucuri? This section highlights key areas, outlining why they are attractive for hosts and guests, along with notable local attractions. Consider these locations based on your target guest profile and investment strategy.
| Neighborhood / Area | Why Host Here? (Target Guests & Appeal) | Key Attractions & Landmarks |
|---|---|---|
| Praia do Farol | A stunning beach known for its clear waters and scenic beauty, attracting tourists looking for relaxation and natural beauty. | Farol Beach, Mucuri River, Beachfront restaurants, Nature trails, Water sports |
| Praia de Barra do Guaí | A peaceful beach destination that offers tranquility and a glimpse of local culture, ideal for families and couples. | Barra do Guaí Beach, Local seafood stalls, Riverside views, Fishing opportunities, Relaxing ambiance |
| Centro de Mucuri | The central area of Mucuri offers accessibility to local shops, restaurants, and cultural experiences, appealing to travelers seeking local immersion. | Local markets, Cultural festivals, Historical sites, Restaurants, Shopping |
| Coco do Sul | Famous for its lush scenery and serene beaches, Coco do Sul attracts visitors seeking a nature retreat. | Coco do Sul Beach, Natural preserves, Picnic areas, Hiking trails, Local flora and fauna |
| Praia de Itagimirim | Known for its calm waters and family-friendly environment, ideal for those with children. | Itagimirim Beach, Children’s parks, Local cafes, Beach volleyball courts, Sunset views |
| Praia do Reis Magos | A lesser-known gem that attracts nature lovers looking for a quiet escape from the hustle and bustle. | Reis Magos Beach, Wildlife observation, Kayaking opportunities, Rustic charm, Local artisans |
| Ilha do Sol | This island is a tranquil getaway known for its pristine nature and scenic views, perfect for eco-tourism and relaxation. | Ilha do Sol Beach, Eco-lodges, Guided nature tours, Scenic viewpoints, Wildlife watching |
| Riviera Mucuri | A charming, picturesque area that combines beach access with local culture, suitable for travelers looking for unique and authentic experiences. | Riviera Beach, Cultural landmarks, Local art galleries, Restaurants with regional cuisine, Outdoor activities |
Understanding Airbnb License Requirements & STR Laws in Mucuri (2026)
While Mucuri, Bahia, Brazil currently shows low STR regulations, specific Airbnb license requirements might still exist or change. Always verify the latest short term rental regulations and Airbnb license requirements directly with local government authorities for Mucuri to ensure full compliance before hosting.
(Source: AirROI data, 2026, finding no licensed listings among those analyzed)
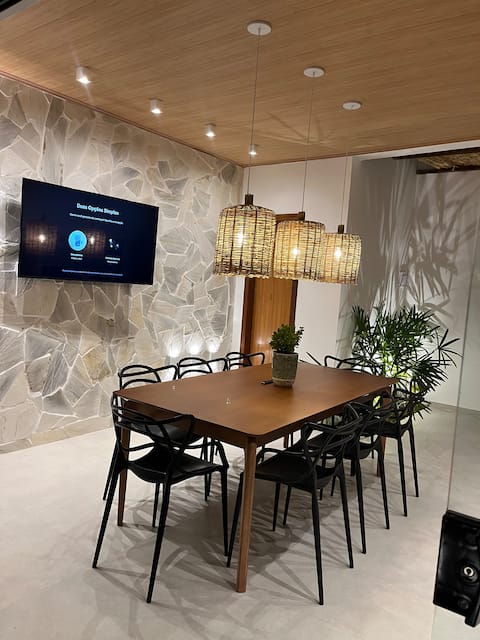
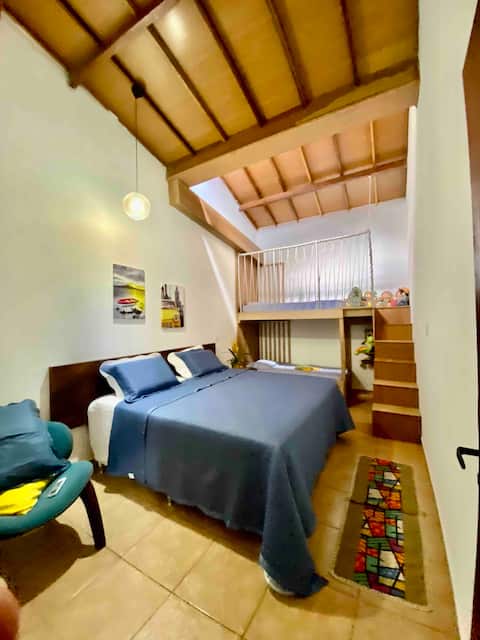
Top Performing Airbnb Properties in Mucuri (2026)
Benchmark your potential! Explore examples of top-performing Airbnb properties in Mucuribased on Trailing Twelve Month (TTM) revenue. Analyze their characteristics, revenue, occupancy rate, and ADR to understand what drives success in this market.
Vila Aquarela
Entire Place • 4 bedrooms

House in Mucuri, near the beach, new and air-conditioned.
Entire Place • 3 bedrooms
Super cozy house in southern Bahia
Entire Place • 3 bedrooms

House with pool near the beach in downtown Mucuri
Entire Place • 3 bedrooms
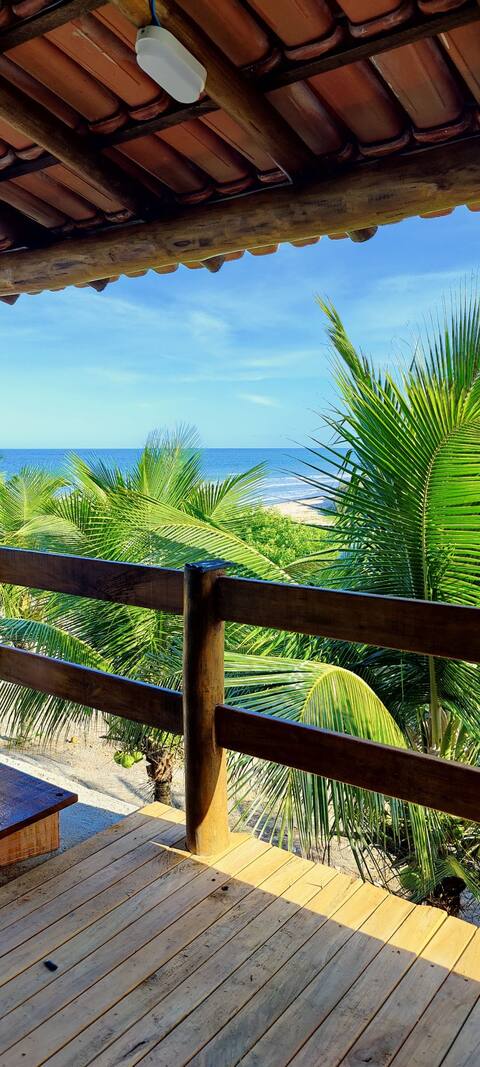
Front facing the sea with an amazing view, Chalet Costa D
Entire Place • 1 bedroom
Facing the sea, Chalé Costa Dourada, Bahia
Entire Place • 1 bedroom
Note: Performance varies based on location, size, amenities, seasonality, and management quality. Data reflects the past 12 months.
Top Performing Airbnb Hosts in Mucuri (2026)
Learn from the best! This table showcases top-performing Airbnb hosts in Mucuri based on the number of properties managed and estimated total revenue over the past year. Analyze their scale and performance metrics.
| Host Name | Properties | Grossing Revenue | Stay Reviews | Avg Rating |
|---|---|---|---|---|
| Patrícia | 2 | $18,381 | 43 | 4.99/5.0 |
| Graciele | 2 | $16,498 | 59 | 4.55/5.0 |
| Tamires | 1 | $12,840 | 4 | 5.00/5.0 |
| Paulo | 2 | $10,200 | 28 | 4.86/5.0 |
| Madalena | 1 | $10,186 | 106 | 4.95/5.0 |
| Rafael | 1 | $9,213 | 17 | 4.76/5.0 |
| Tiago | 1 | $7,550 | 2 | Not Rated |
| Simária | 1 | $6,376 | 43 | 4.95/5.0 |
| Marta | 1 | $5,607 | 5 | 5.00/5.0 |
| Fabricio | 1 | $5,230 | 3 | 4.33/5.0 |
Analyzing the strategies of top hosts, such as their property selection, pricing, and guest communication, can offer valuable lessons for optimizing your own Airbnb operations in Mucuri.
Dive Deeper: Advanced Mucuri STR Market Data (2026)
Ready to unlock more insights? AirROI provides access to advanced metrics and comprehensive Airbnb data for Mucuri. Explore detailed analytics beyond this report to refine your investment strategy, optimize pricing, and maximize your vacation rental profits.
Explore Advanced MetricsMucuri Short-Term Rental Market Composition (2026): Property & Room Types
Room Type Distribution
Property Type Distribution
Market Composition Insights for Mucuri
- The Mucuri Airbnb market composition is heavily skewed towards Entire Home/Apt listings, which make up 92.9% of the 42 active rentals. This indicates strong guest preference for privacy and space.
- Looking at the property type distribution in Mucuri, House properties are the most common (76.2%), reflecting the local real estate landscape.
- Houses represent a significant 76.2% portion, catering likely to families or larger groups.
- The presence of 7.1% Hotel/Boutique listings indicates integration with traditional hospitality.
Mucuri Airbnb Room Capacity Analysis (2026): Bedroom Distribution
Distribution of Listings by Number of Bedrooms
Room Capacity Insights for Mucuri
- The dominant room capacity in Mucuri is 2 bedrooms listings, making up 33.3% of the market. This suggests a strong demand for properties suitable for couples or solo travelers.
- Together, 2 bedrooms and 3 bedrooms properties represent 57.1% of the active Airbnb listings in Mucuri, indicating a high concentration in these sizes.
- A significant 40.5% of listings offer 3+ bedrooms, catering to larger groups and families seeking more space in Mucuri.
Mucuri Vacation Rental Guest Capacity Trends (2026)
Distribution of Listings by Guest Capacity
Guest Capacity Insights for Mucuri
- The most common guest capacity trend in Mucuri vacation rentals is listings accommodating 8+ guests (52.4%). This suggests the primary traveler segment is likely larger groups.
- Properties designed for 8+ guests and 4 guests dominate the Mucuri STR market, accounting for 64.3% of listings.
- 64.3% of properties accommodate 6+ guests, serving the market segment for larger families or group travel in Mucuri.
- On average, properties in Mucuri are equipped to host 6.1 guests.
Mucuri Airbnb Booking Patterns (2026): Available vs. Booked Days
Available Days Distribution
Booked Days Distribution
Booking Pattern Insights for Mucuri
- The most common availability pattern in Mucuri falls within the 271-366 days range, representing 78.6% of listings. This suggests many properties have significant open periods on their calendars.
- Approximately 92.9% of listings show high availability (181+ days open annually), indicating potential for increased bookings or specific owner usage patterns.
- For booked days, the 1-30 days range is most frequent in Mucuri (40.5%), reflecting common guest stay durations or potential owner blocking patterns.
- A notable 7.1% of properties secure long booking periods (181+ days booked per year), highlighting successful long-term rental strategies or significant owner usage.
Mucuri Airbnb Minimum Stay Requirements Analysis
Distribution of Listings by Minimum Night Requirement
1 Night
7 listings
16.7% of total
2 Nights
18 listings
42.9% of total
3 Nights
4 listings
9.5% of total
4-6 Nights
1 listings
2.4% of total
30+ Nights
12 listings
28.6% of total
Key Insights
- The most prevalent minimum stay requirement in Mucuri is 2 Nights, adopted by 42.9% of listings. This highlights the market's preference for shorter, flexible bookings.
- A significant segment (28.6%) caters to monthly stays (30+ nights) in Mucuri, pointing to opportunities in the extended-stay market.
Recommendations
- Align with the market by considering a 2 Nights minimum stay, as 42.9% of Mucuri hosts use this setting.
- If feasible, allowing 1-night stays, especially midweek or during low season, could capture last-minute bookings, as only 16.7% currently do.
- A 2-night minimum appears standard (42.9%). Consider this for weekends or peak periods.
- Explore offering discounts for stays of 30+ nights to attract the 28.6% of the market seeking extended stays.
- Adjust minimum nights based on seasonality – potentially shorter during low season and longer during peak demand periods in Mucuri.
Mucuri Airbnb Cancellation Policy Trends Analysis (2026)
Flexible
8 listings
19% of total
Moderate
11 listings
26.2% of total
Firm
19 listings
45.2% of total
Strict
4 listings
9.5% of total
Cancellation Policy Insights for Mucuri
- The prevailing Airbnb cancellation policy trend in Mucuri is Firm, used by 45.2% of listings.
- A majority (54.7%) of hosts in Mucuri utilize Firm or Strict policies, indicating a market where hosts prioritize booking security.
- Strict cancellation policies are quite rare (9.5%), potentially making listings with this policy less competitive unless justified by high demand or property type.
Recommendations for Hosts
- Consider adopting a Firm policy to align with the 45.2% market standard in Mucuri.
- Using a Strict policy might deter some guests, as only 9.5% of listings use it. Evaluate if potential revenue protection outweighs possible lower booking rates.
- Regularly review your cancellation policy against competitors and market demand shifts in Mucuri.
Mucuri STR Booking Lead Time Analysis (2026)
Average Booking Lead Time by Month
Booking Lead Time Insights for Mucuri
- The overall average booking lead time for vacation rentals in Mucuri is 36 days.
- Guests book furthest in advance for stays during January (average 43 days), likely coinciding with peak travel demand or local events.
- The shortest booking windows occur for stays in July (average 11 days), indicating more last-minute travel plans during this time.
- Seasonally, Winter (41 days avg.) sees the longest lead times, while Summer (19 days avg.) has the shortest, reflecting typical travel planning cycles.
Recommendations for Hosts
- Use the overall average lead time (36 days) as a baseline for your pricing and availability strategy in Mucuri.
- During July, focus on last-minute booking availability and promotions, as guests book with very short notice (11 days avg.).
- Target marketing efforts for the Winter season well in advance (at least 41 days) to capture early planners.
- Monitor your own booking lead times against these Mucuri averages to identify opportunities for dynamic pricing adjustments.
Popular & Essential Airbnb Amenities in Mucuri (2026)
Amenity Prevalence
Amenity Insights for Mucuri
- Essential amenities in Mucuri that guests expect include: Kitchen. Lacking these (this) could significantly impact bookings.
- Popular amenities like Wifi, TV, Air conditioning are common but not universal. Offering these can provide a competitive edge.
- Warning: Wifi is not universally provided but is considered essential globally. Ensure reliable Wifi is offered.
Recommendations for Hosts
- Ensure your listing includes all essential amenities for Mucuri: Kitchen.
- Prioritize adding missing essentials: Kitchen.
- Consider adding popular differentiators like Wifi or TV to increase appeal.
- Highlight unique or less common amenities you offer (e.g., hot tub, dedicated workspace, EV charger) in your listing description and photos.
- Regularly check competitor amenities in Mucuri to stay competitive.
Mucuri Airbnb Guest Demographics & Profile Analysis (2026)
Guest Profile Summary for Mucuri
- The typical guest profile for Airbnb in Mucuri consists of primarily domestic travelers (100%), often arriving from nearby Belo Horizonte, typically belonging to the Post-2000s (Gen Z/Alpha) group (50%), primarily speaking Portuguese or English.
- Domestic travelers account for 100.0% of guests.
- Top languages spoken are Portuguese (52%) followed by English (28%).
- A significant demographic segment is the Post-2000s (Gen Z/Alpha) group, representing 50% of guests.
Recommendations for Hosts
- Target domestic marketing efforts towards travelers from Belo Horizonte and Rio de Janeiro.
- Tailor amenities and listing descriptions to appeal to the dominant Post-2000s (Gen Z/Alpha) demographic (e.g., highlight fast WiFi, smart home features, local guides).
- Highlight unique local experiences or amenities relevant to the primary guest profile.
- Consider seasonal promotions aligned with peak travel times for key origin markets.
Nearby Short-Term Rental Market Comparison
How does the Mucuri Airbnb market stack up against its neighbors? Compare key performance metrics like average monthly revenue, ADR, and occupancy rates in surrounding areas to understand the broader regional STR landscape.
| Market | Active Properties | Monthly Revenue | Daily Rate | Avg. Occupancy |
|---|---|---|---|---|
| Santa Teresa | 306 | $708 | $117.81 | 25% |
| Prado | 904 | $439 | $109.79 | 23% |
| Aracruz | 107 | $428 | $102.72 | 24% |
| São Mateus | 177 | $363 | $98.35 | 21% |
| Conceição da Barra | 139 | $291 | $79.14 | 21% |
| Colatina | 13 | $290 | $29.21 | 45% |
| Alcobaça | 51 | $242 | $86.25 | 20% |
| Caravelas | 33 | $230 | $54.08 | 22% |
| Linhares | 70 | $209 | $55.32 | 26% |
| Pancas | 10 | $204 | $50.65 | 18% |