Ubajara Airbnb Market Analysis 2026: Short Term Rental Data & Vacation Rental Statistics in Ceará, Brazil
Is Airbnb profitable in Ubajara in 2026? Explore comprehensive Airbnb analytics for Ubajara, Ceará, Brazil to uncover income potential. This 2026 STR market report for Ubajara, based on AirROI data from February 2025 to January 2026, reveals key trends in the niche market of 30 active listings.
Whether you're considering an Airbnb investment in Ubajara, optimizing your existing vacation rental, or exploring rental arbitrage opportunities, understanding the Ubajara Airbnb data is crucial. Leveraging the low regulation environment is key to maximizing your short term rental income potential. Let's dive into the specifics.
Key Ubajara Airbnb Performance Metrics Overview
Monthly Airbnb Revenue Variations & Income Potential in Ubajara (2026)
Understanding the monthly revenue variations for Airbnb listings in Ubajara is key to maximizing your short term rental income potential. Seasonality significantly impacts earnings. Our analysis, based on data from the past 12 months, shows that the peak revenue month for STRs in Ubajara is typically July, while June often presents the lowest earnings, highlighting opportunities for strategic pricing adjustments during shoulder and low seasons. Explore the typical Airbnb income in Ubajara across different performance tiers:
- Best-in-class properties (Top 10%) achieve $966+ monthly, often utilizing dynamic pricing and superior guest experiences.
- Strong performing properties (Top 25%) earn $521 or more, indicating effective management and desirable locations/amenities.
- Typical properties (Median) generate around $253 per month, representing the average market performance.
- Entry-level properties (Bottom 25%) see earnings around $133, often with potential for optimization.
Average Monthly Airbnb Earnings Trend in Ubajara
Ubajara Airbnb Occupancy Rate Trends (2026)
Maximize your bookings by understanding the Ubajara STR occupancy trends. Seasonal demand shifts significantly influence how often properties are booked. Typically, Julysees the highest demand (peak season occupancy), while September experiences the lowest (low season). Effective strategies, like adjusting minimum stays or offering promotions, can boost occupancy during slower periods. Here's how different property tiers perform in Ubajara:
- Best-in-class properties (Top 10%) achieve 40%+ occupancy, indicating high desirability and potentially optimized availability.
- Strong performing properties (Top 25%) maintain 28% or higher occupancy, suggesting good market fit and guest satisfaction.
- Typical properties (Median) have an occupancy rate around 15%.
- Entry-level properties (Bottom 25%) average 9% occupancy, potentially facing higher vacancy.
Average Monthly Occupancy Rate Trend in Ubajara
Average Daily Rate (ADR) Airbnb Trends in Ubajara (2026)
Effective short term rental pricing strategy in Ubajara involves understanding monthly ADR fluctuations. The Average Daily Rate (ADR) for Airbnb in Ubajara typically peaks in December and dips lowest during February. Leveraging Airbnb dynamic pricing tools or strategies based on this seasonality can significantly boost revenue. Here's a look at the typical nightly rates achieved:
- Best-in-class properties (Top 10%) command rates of $131+ per night, often due to premium features or locations.
- Strong performing properties (Top 25%) achieve nightly rates of $67 or more.
- Typical properties (Median) charge around $44 per night.
- Entry-level properties (Bottom 25%) earn around $34 per night.
Average Daily Rate (ADR) Trend by Month in Ubajara
Get Live Ubajara Market Intelligence 👇

Explore Real-time Analytics
Airbnb Seasonality Analysis & Trends in Ubajara (2026)
Peak Season (July, December, January)
- Revenue averages $552 per month
- Occupancy rates average 26.6%
- Daily rates average $64
Shoulder Season
- Revenue averages $398 per month
- Occupancy maintains around 18.9%
- Daily rates hold near $59
Low Season (February, June, September)
- Revenue drops to average $266 per month
- Occupancy decreases to average 14.1%
- Daily rates adjust to average $57
Seasonality Insights for Ubajara
- The Airbnb seasonality in Ubajara shows highly seasonal trends requiring careful strategy. While the sections above show seasonal averages, it's also insightful to look at the extremes:
- During the high season, the absolute peak month showcases Ubajara's highest earning potential, with monthly revenues capable of climbing to $574, occupancy reaching a high of 28.9%, and ADRs peaking at $68.
- Conversely, the slowest single month of the year, typically falling within the low season, marks the market's lowest point. In this month, revenue might dip to $232, occupancy could drop to 11.8%, and ADRs may adjust down to $52.
- Understanding both the seasonal averages and these monthly peaks and troughs in revenue, occupancy, and ADR is crucial for maximizing your Airbnb profit potential in Ubajara.
Seasonal Strategies for Maximizing Profit
- Peak Season: Maximize revenue through premium pricing and potentially longer minimum stays. Ensure high availability.
- Low Season: Offer competitive pricing, special promotions (e.g., extended stay discounts), and flexible cancellation policies. Target off-season travelers like remote workers or budget-conscious guests.
- Shoulder Seasons: Implement dynamic pricing that balances peak and low rates. Target weekend travelers or specific events. Offer slightly more flexible terms than peak season.
- Regularly analyze your own performance against these Ubajara seasonality benchmarks and adjust your pricing and availability strategy accordingly.
Best Areas for Airbnb Investment in Ubajara (2026)
Exploring the top neighborhoods for short-term rentals in Ubajara? This section highlights key areas, outlining why they are attractive for hosts and guests, along with notable local attractions. Consider these locations based on your target guest profile and investment strategy.
| Neighborhood / Area | Why Host Here? (Target Guests & Appeal) | Key Attractions & Landmarks |
|---|---|---|
| Cascatinha do Hélio | A beautiful natural attraction with stunning waterfalls and lush vegetation. Ideal for ecotourism and attracting nature lovers and adventure seekers. | Cascata do Hélio, Parque Nacional da Serra da Ibiapaba, Trilhas Ecoturísticas, Mirante da Serrinha |
| Centro de Ubajara | The city center of Ubajara, with easy access to amenities, restaurants, and shops. A great base for tourists visiting local attractions. | Igreja Matriz de Ubajara, Mercado Público, Praça da Matriz, Café com Letras |
| Serra Grande | A mountainous area known for its stunning views and hiking opportunities. Perfect for tourists interested in outdoor activities and exploring scenic landscapes. | Caminho da Lua, Mirante da Serra, Trilhas de Estrada Real |
| Parque Nacional de Ubajara | A national park with rich biodiversity, caves, and beautiful landscapes. A popular spot for hiking and nature activities, making it attractive for eco-friendly travelers. | Gruta de Ubajara, Teleférico de Ubajara, Cascata do Anel, Trilhas do Parque |
| Rota do Café | A region renowned for its coffee plantations, offering unique experiences for coffee lovers. Attracts tourists interested in agritourism and local culture. | Fazendas de Café, Degustação de Café, Centro Cultural do Café, Feiras de Artesanato |
| Ubajara Historical District | An area rich in history and culture, showcasing the charm of older architecture and the local way of life. Captivating for cultural tourists. | Museu Casa de Cultura, Igreja do Bom Jesus, Praça do Comercio, Arquitetura Colonial |
| Cachoeira do Binga | A beautiful waterfall located near Ubajara, perfect for swimming and relaxation. A wonderful spot for nature lovers and families. | Cachoeira do Binga, Trilhas Para Cachoeiras, Piqueniques e Campismo |
| Local Food Markets | Ubajara is known for its local cuisine and vibrant markets. A great way to experience local culture and attract food enthusiasts. | Mercado de Artesanato, Feira Livre de Ubajara, Ruas Gastronômicas, Restaurantes Locais |
Understanding Airbnb License Requirements & STR Laws in Ubajara (2026)
While Ubajara, Ceará, Brazil currently shows low STR regulations, specific Airbnb license requirements might still exist or change. Always verify the latest short term rental regulations and Airbnb license requirements directly with local government authorities for Ubajara to ensure full compliance before hosting.
(Source: AirROI data, 2026, finding no licensed listings among those analyzed)
Top Performing Airbnb Properties in Ubajara (2026)
Benchmark your potential! Explore examples of top-performing Airbnb properties in Ubajarabased on Trailing Twelve Month (TTM) revenue. Analyze their characteristics, revenue, occupancy rate, and ADR to understand what drives success in this market.

Life House Ubajara
Entire Place • 3 bedrooms
Sítio Na Morada - Lodging and events
Entire Place • 4 bedrooms
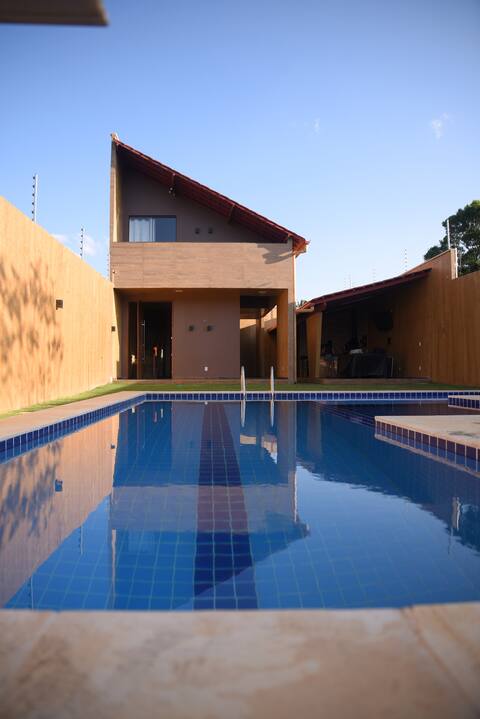
Seasonal Chalet with Swimming Pool and Barbecue Area
Entire Place • 2 bedrooms

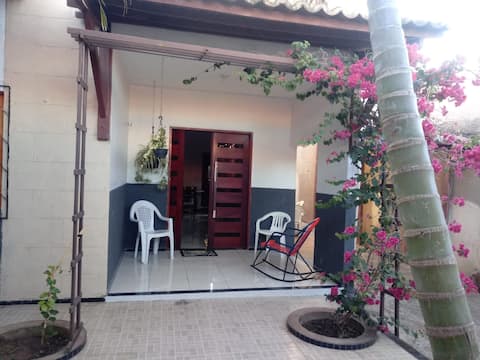
Cozy and bright house in Ubajara
Entire Place • 2 bedrooms
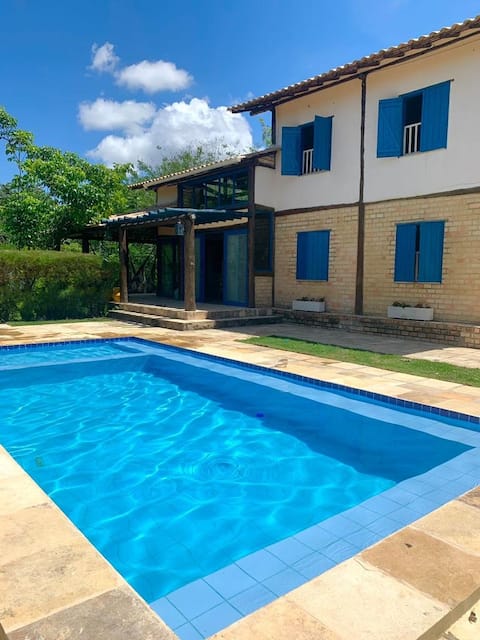
Vacation home in Ubajara
Entire Place • 4 bedrooms

Beautiful house in the prime area, 300 MB WI-FI, Smart TV
Entire Place • 2 bedrooms
Note: Performance varies based on location, size, amenities, seasonality, and management quality. Data reflects the past 12 months.
Top Performing Airbnb Hosts in Ubajara (2026)
Learn from the best! This table showcases top-performing Airbnb hosts in Ubajara based on the number of properties managed and estimated total revenue over the past year. Analyze their scale and performance metrics.
| Host Name | Properties | Grossing Revenue | Stay Reviews | Avg Rating |
|---|---|---|---|---|
| Levy | 1 | $16,017 | 24 | 5.00/5.0 |
| Sabrina | 1 | $11,994 | 16 | 4.94/5.0 |
| Jéssika | 1 | $9,705 | 8 | 5.00/5.0 |
| Selma Variedades | 2 | $6,147 | 46 | 4.96/5.0 |
| Cristiane | 1 | $6,023 | 39 | 4.92/5.0 |
| Maria | 1 | $5,437 | 112 | 4.96/5.0 |
| Audiscley Pessoa | 1 | $5,089 | 14 | 4.79/5.0 |
| Luciano | 2 | $4,263 | 98 | 4.88/5.0 |
| Joelma | 1 | $4,047 | 4 | 5.00/5.0 |
| Glenda | 1 | $4,012 | 16 | 4.88/5.0 |
Analyzing the strategies of top hosts, such as their property selection, pricing, and guest communication, can offer valuable lessons for optimizing your own Airbnb operations in Ubajara.
Dive Deeper: Advanced Ubajara STR Market Data (2026)
Ready to unlock more insights? AirROI provides access to advanced metrics and comprehensive Airbnb data for Ubajara. Explore detailed analytics beyond this report to refine your investment strategy, optimize pricing, and maximize your vacation rental profits.
Explore Advanced MetricsUbajara Short-Term Rental Market Composition (2026): Property & Room Types
Room Type Distribution
Property Type Distribution
Market Composition Insights for Ubajara
- The Ubajara Airbnb market composition is heavily skewed towards Entire Home/Apt listings, which make up 70% of the 30 active rentals. This indicates strong guest preference for privacy and space.
- Looking at the property type distribution in Ubajara, House properties are the most common (63.3%), reflecting the local real estate landscape.
- Houses represent a significant 63.3% portion, catering likely to families or larger groups.
- The presence of 23.3% Hotel/Boutique listings indicates integration with traditional hospitality.
Ubajara Airbnb Room Capacity Analysis (2026): Bedroom Distribution
Distribution of Listings by Number of Bedrooms
Room Capacity Insights for Ubajara
- The dominant room capacity in Ubajara is 2 bedrooms listings, making up 30% of the market. This suggests a strong demand for properties suitable for couples or solo travelers.
- Together, 2 bedrooms and 3 bedrooms properties represent 56.7% of the active Airbnb listings in Ubajara, indicating a high concentration in these sizes.
- A significant 40.0% of listings offer 3+ bedrooms, catering to larger groups and families seeking more space in Ubajara.
Ubajara Vacation Rental Guest Capacity Trends (2026)
Distribution of Listings by Guest Capacity
Guest Capacity Insights for Ubajara
- The most common guest capacity trend in Ubajara vacation rentals is listings accommodating 8+ guests (50%). This suggests the primary traveler segment is likely larger groups.
- Properties designed for 8+ guests and 7 guests dominate the Ubajara STR market, accounting for 56.7% of listings.
- 63.4% of properties accommodate 6+ guests, serving the market segment for larger families or group travel in Ubajara.
- On average, properties in Ubajara are equipped to host 5.2 guests.
Ubajara Airbnb Booking Patterns (2026): Available vs. Booked Days
Available Days Distribution
Booked Days Distribution
Booking Pattern Insights for Ubajara
- The most common availability pattern in Ubajara falls within the 271-366 days range, representing 86.7% of listings. This suggests many properties have significant open periods on their calendars.
- Approximately 100.0% of listings show high availability (181+ days open annually), indicating potential for increased bookings or specific owner usage patterns.
- For booked days, the 1-30 days range is most frequent in Ubajara (53.3%), reflecting common guest stay durations or potential owner blocking patterns.
Ubajara Airbnb Minimum Stay Requirements Analysis
Distribution of Listings by Minimum Night Requirement
1 Night
19 listings
63.3% of total
2 Nights
7 listings
23.3% of total
30+ Nights
4 listings
13.3% of total
Key Insights
- The most prevalent minimum stay requirement in Ubajara is 1 Night, adopted by 63.3% of listings. This highlights the market's preference for shorter, flexible bookings.
- A strong majority (86.6%) of the Ubajara Airbnb data shows acceptance of very short stays (1-2 nights), indicating a dynamic, high-turnover market.
- A significant segment (13.3%) caters to monthly stays (30+ nights) in Ubajara, pointing to opportunities in the extended-stay market.
Recommendations
- Align with the market by considering a 1 Night minimum stay, as 63.3% of Ubajara hosts use this setting.
- Explore offering discounts for stays of 30+ nights to attract the 13.3% of the market seeking extended stays.
- Adjust minimum nights based on seasonality – potentially shorter during low season and longer during peak demand periods in Ubajara.
Ubajara Airbnb Cancellation Policy Trends Analysis (2026)
Limited
1 listings
3.3% of total
Super Strict 30 Days
1 listings
3.3% of total
Flexible
17 listings
56.7% of total
Moderate
7 listings
23.3% of total
Firm
2 listings
6.7% of total
Strict
2 listings
6.7% of total
Cancellation Policy Insights for Ubajara
- The prevailing Airbnb cancellation policy trend in Ubajara is Flexible, used by 56.7% of listings.
- The market strongly favors guest-friendly terms, with 80.0% of listings offering Flexible or Moderate policies. This suggests guests in Ubajara may expect booking flexibility.
- Strict cancellation policies are quite rare (6.7%), potentially making listings with this policy less competitive unless justified by high demand or property type.
Recommendations for Hosts
- Consider adopting a Flexible policy to align with the 56.7% market standard in Ubajara.
- Given the high prevalence of Flexible policies (56.7%), offering this can enhance booking appeal, especially during shoulder seasons.
- Using a Strict policy might deter some guests, as only 6.7% of listings use it. Evaluate if potential revenue protection outweighs possible lower booking rates.
- Regularly review your cancellation policy against competitors and market demand shifts in Ubajara.
Ubajara STR Booking Lead Time Analysis (2026)
Average Booking Lead Time by Month
Booking Lead Time Insights for Ubajara
- The overall average booking lead time for vacation rentals in Ubajara is 23 days.
- Guests book furthest in advance for stays during December (average 34 days), likely coinciding with peak travel demand or local events.
- The shortest booking windows occur for stays in February (average 8 days), indicating more last-minute travel plans during this time.
- Seasonally, Spring (25 days avg.) sees the longest lead times, while Summer (20 days avg.) has the shortest, reflecting typical travel planning cycles.
Recommendations for Hosts
- Use the overall average lead time (23 days) as a baseline for your pricing and availability strategy in Ubajara.
- For December stays, consider implementing length-of-stay discounts or slightly higher rates for bookings made less than 34 days out to capitalize on advance planning.
- During February, focus on last-minute booking availability and promotions, as guests book with very short notice (8 days avg.).
- Target marketing efforts for the Spring season well in advance (at least 25 days) to capture early planners.
- Monitor your own booking lead times against these Ubajara averages to identify opportunities for dynamic pricing adjustments.
Popular & Essential Airbnb Amenities in Ubajara (2026)
Amenity Prevalence
Amenity Insights for Ubajara
- Essential amenities in Ubajara that guests expect include: Wifi. Lacking these (this) could significantly impact bookings.
- Popular amenities like TV, Free parking on premises, Dishes and silverware are common but not universal. Offering these can provide a competitive edge.
Recommendations for Hosts
- Ensure your listing includes all essential amenities for Ubajara: Wifi.
- Prioritize adding missing essentials: Wifi.
- Consider adding popular differentiators like TV or Free parking on premises to increase appeal.
- Highlight unique or less common amenities you offer (e.g., hot tub, dedicated workspace, EV charger) in your listing description and photos.
- Regularly check competitor amenities in Ubajara to stay competitive.
Ubajara Airbnb Guest Demographics & Profile Analysis (2026)
Guest Profile Summary for Ubajara
- The typical guest profile for Airbnb in Ubajara consists of primarily domestic travelers (92%), often arriving from nearby Ceará, typically belonging to the Post-2000s (Gen Z/Alpha) group (50%), primarily speaking Portuguese or English.
- Domestic travelers account for 91.5% of guests.
- Key international markets include Brazil (91.5%) and Germany (1.4%).
- Top languages spoken are Portuguese (54.2%) followed by English (29.2%).
- A significant demographic segment is the Post-2000s (Gen Z/Alpha) group, representing 50% of guests.
Recommendations for Hosts
- Target domestic marketing efforts towards travelers from Ceará and Teresina.
- Tailor amenities and listing descriptions to appeal to the dominant Post-2000s (Gen Z/Alpha) demographic (e.g., highlight fast WiFi, smart home features, local guides).
- Highlight unique local experiences or amenities relevant to the primary guest profile.
- Consider seasonal promotions aligned with peak travel times for key origin markets.
Nearby Short-Term Rental Market Comparison
How does the Ubajara Airbnb market stack up against its neighbors? Compare key performance metrics like average monthly revenue, ADR, and occupancy rates in surrounding areas to understand the broader regional STR landscape.
| Market | Active Properties | Monthly Revenue | Daily Rate | Avg. Occupancy |
|---|---|---|---|---|
| Trairi | 251 | $790 | $148.54 | 24% |
| Itarema | 45 | $778 | $156.60 | 24% |
| Amontada | 203 | $776 | $130.94 | 25% |
| Jijoca de Jericoacoara | 452 | $771 | $100.13 | 31% |
| Cruz | 215 | $764 | $138.05 | 26% |
| Acaraú | 32 | $573 | $180.41 | 23% |
| Jericoacoara | 30 | $557 | $81.94 | 30% |
| Cajueiro da Praia | 203 | $532 | $125.26 | 21% |
| Camocim | 120 | $420 | $111.65 | 20% |
| Itapipoca | 31 | $413 | $98.67 | 19% |