Brasília Airbnb Market Analysis 2026: Short Term Rental Data & Vacation Rental Statistics in Federal District, Brazil
Is Airbnb profitable in Brasília in 2026? Explore comprehensive Airbnb analytics for Brasília, Federal District, Brazil to uncover income potential. This 2026 STR market report for Brasília, based on AirROI data from February 2025 to January 2026, reveals key trends in the market of 683 active listings.
Whether you're considering an Airbnb investment in Brasília, optimizing your existing vacation rental, or exploring rental arbitrage opportunities, understanding the Brasília Airbnb data is crucial. Leveraging the low regulation environment is key to maximizing your short term rental income potential. Let's dive into the specifics.
Key Brasília Airbnb Performance Metrics Overview
Monthly Airbnb Revenue Variations & Income Potential in Brasília (2026)
Understanding the monthly revenue variations for Airbnb listings in Brasília is key to maximizing your short term rental income potential. Seasonality significantly impacts earnings. Our analysis, based on data from the past 12 months, shows that the peak revenue month for STRs in Brasília is typically April, while May often presents the lowest earnings, highlighting opportunities for strategic pricing adjustments during shoulder and low seasons. Explore the typical Airbnb income in Brasília across different performance tiers:
- Best-in-class properties (Top 10%) achieve $2,233+ monthly, often utilizing dynamic pricing and superior guest experiences.
- Strong performing properties (Top 25%) earn $1,911 or more, indicating effective management and desirable locations/amenities.
- Typical properties (Median) generate around $1,649 per month, representing the average market performance.
- Entry-level properties (Bottom 25%) see earnings around $1,453, often with potential for optimization.
Average Monthly Airbnb Earnings Trend in Brasília
Brasília Airbnb Occupancy Rate Trends (2026)
Maximize your bookings by understanding the Brasília STR occupancy trends. Seasonal demand shifts significantly influence how often properties are booked. Typically, Aprilsees the highest demand (peak season occupancy), while May experiences the lowest (low season). Effective strategies, like adjusting minimum stays or offering promotions, can boost occupancy during slower periods. Here's how different property tiers perform in Brasília:
- Best-in-class properties (Top 10%) achieve 75%+ occupancy, indicating high desirability and potentially optimized availability.
- Strong performing properties (Top 25%) maintain 63% or higher occupancy, suggesting good market fit and guest satisfaction.
- Typical properties (Median) have an occupancy rate around 48%.
- Entry-level properties (Bottom 25%) average 34% occupancy, potentially facing higher vacancy.
Average Monthly Occupancy Rate Trend in Brasília
Average Daily Rate (ADR) Airbnb Trends in Brasília (2026)
Effective short term rental pricing strategy in Brasília involves understanding monthly ADR fluctuations. The Average Daily Rate (ADR) for Airbnb in Brasília typically peaks in September and dips lowest during August. Leveraging Airbnb dynamic pricing tools or strategies based on this seasonality can significantly boost revenue. Here's a look at the typical nightly rates achieved:
- Best-in-class properties (Top 10%) command rates of $86+ per night, often due to premium features or locations.
- Strong performing properties (Top 25%) achieve nightly rates of $57 or more.
- Typical properties (Median) charge around $41 per night.
- Entry-level properties (Bottom 25%) earn around $30 per night.
Average Daily Rate (ADR) Trend by Month in Brasília
Get Live Brasília Market Intelligence 👇
Explore Real-time Analytics
Airbnb Seasonality Analysis & Trends in Brasília (2026)
Peak Season (April, March, February)
- Revenue averages $5,029 per month
- Occupancy rates average 76.2%
- Daily rates average $51
Shoulder Season
- Revenue averages $817 per month
- Occupancy maintains around 46.2%
- Daily rates hold near $55
Low Season (January, May, July)
- Revenue drops to average $433 per month
- Occupancy decreases to average 28.5%
- Daily rates adjust to average $51
Seasonality Insights for Brasília
- The Airbnb seasonality in Brasília shows highly seasonal trends requiring careful strategy. While the sections above show seasonal averages, it's also insightful to look at the extremes:
- During the high season, the absolute peak month showcases Brasília's highest earning potential, with monthly revenues capable of climbing to $6,524, occupancy reaching a high of 96.7%, and ADRs peaking at $60.
- Conversely, the slowest single month of the year, typically falling within the low season, marks the market's lowest point. In this month, revenue might dip to $183, occupancy could drop to 11.6%, and ADRs may adjust down to $49.
- Understanding both the seasonal averages and these monthly peaks and troughs in revenue, occupancy, and ADR is crucial for maximizing your Airbnb profit potential in Brasília.
Seasonal Strategies for Maximizing Profit
- Peak Season: Maximize revenue through premium pricing and potentially longer minimum stays. Ensure high availability.
- Low Season: Offer competitive pricing, special promotions (e.g., extended stay discounts), and flexible cancellation policies. Target off-season travelers like remote workers or budget-conscious guests.
- Shoulder Seasons: Implement dynamic pricing that balances peak and low rates. Target weekend travelers or specific events. Offer slightly more flexible terms than peak season.
- Regularly analyze your own performance against these Brasília seasonality benchmarks and adjust your pricing and availability strategy accordingly.
Best Areas for Airbnb Investment in Brasília (2026)
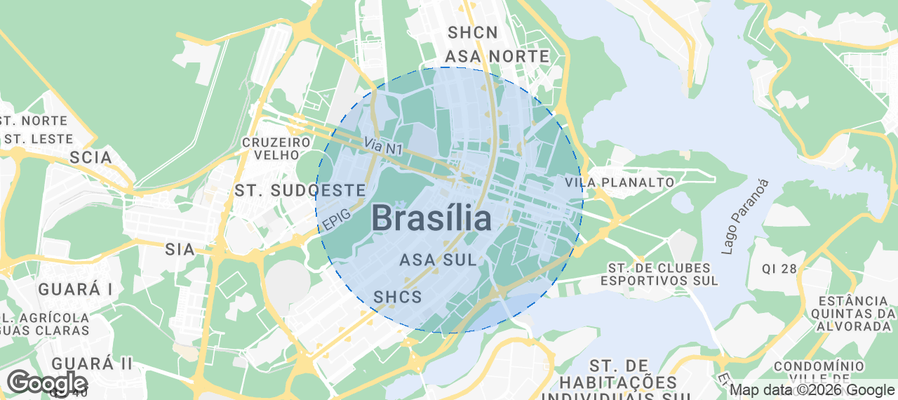
Exploring the top neighborhoods for short-term rentals in Brasília? This section highlights key areas, outlining why they are attractive for hosts and guests, along with notable local attractions. Consider these locations based on your target guest profile and investment strategy.
| Neighborhood / Area | Why Host Here? (Target Guests & Appeal) | Key Attractions & Landmarks |
|---|---|---|
| Asa Sul | Popular residential and commercial area with easy access to cultural attractions, restaurants, and nightlife. Ideal for tourists looking for a local experience and convenient transportation options. | Cathedral of Brasília, Palácio da Alvorada, Palácio do Planalto, Clube do Choro, Cultural Complex of the Republic |
| Asa Norte | Lively neighborhood with parks, shopping centers, and a variety of dining options. Attracts visitors who want to experience the city's local lifestyle and excellent amenities. | Museu Nacional, Jardim Botânico, Shopping Iguatemi, Cultural Complex of the Republic, Parque da Cidade |
| Lago Sul | Upscale neighborhood known for its luxury homes and beautiful lake views. A favored spot for those seeking tranquility and scenic beauty close to the city center. | Lake Paranoá, Ilha do Lago, Clube de Golfe de Brasília, Parque Ecológico do SESC |
| Lago Norte | Another picturesque area near Lake Paranoá, popular for its serene environment. Ideal for families and nature lovers who want a peaceful retreat while being close to city attractions. | Parque da Cidade, Lago Paranoá, Clube do Choro, Eixão do Lazer |
| Sudoeste | Modern neighborhood with a mix of residential and commercial developments. It's becoming increasingly popular among tourists for its proximity to various cultural sites and amenities. | Complexo Cultural da República, Parque da Cidade, Teatro Nacional, Shopping Pátio Brasil |
| Plano Piloto | The heart of Brasília, known for its unique architectural landmarks and historical significance. Prime area for tourists looking to explore the capital's heritage and attractions. | Congresso Nacional, Palácio da Justiça, Jardim Botânico, Centro Cultural Banco do Brasil |
| Setor de Clubes Esportivos | Area along the lake with recreational activities and sports clubs. Great for active visitors and those who enjoy outdoor activities in a scenic setting. | Parque da Cidade, Lago Paranoá, Esporte Clube Pinheiros |
| Setor Comercial Sul | Business district with a mix of hotels, restaurants, and offices. Perfect for business travelers and those looking for easy access to the city's commercial centers. | Teatro Nacional, Parque da Cidade, Shopping Center Casas Bahia |
Understanding Airbnb License Requirements & STR Laws in Brasília (2026)
While Brasília, Federal District, Brazil currently shows low STR regulations, specific Airbnb license requirements might still exist or change. Always verify the latest short term rental regulations and Airbnb license requirements directly with local government authorities for Brasília to ensure full compliance before hosting.
(Source: AirROI data, 2026, finding no licensed listings among those analyzed)
Top Performing Airbnb Properties in Brasília (2026)
Benchmark your potential! Explore examples of top-performing Airbnb properties in Brasíliabased on Trailing Twelve Month (TTM) revenue. Analyze their characteristics, revenue, occupancy rate, and ADR to understand what drives success in this market.

Mawê Falls Family Suite Natural Pool
Entire Place • 1 bedroom

Essential Prime North Lake House
Entire Place • 3 bedrooms

Brisa do Lago Pool View By Rei dos Flats
Entire Place • 1 bedroom

Round House, with hot pool, barbecue area
Entire Place • 6 bedrooms

João de Barro Recreation Area
Entire Place • 4 bedrooms

Beautiful Flat-Excellent Location- Hotel Sector
Entire Place • 1 bedroom
Note: Performance varies based on location, size, amenities, seasonality, and management quality. Data reflects the past 12 months.
Top Performing Airbnb Hosts in Brasília (2026)
Learn from the best! This table showcases top-performing Airbnb hosts in Brasília based on the number of properties managed and estimated total revenue over the past year. Analyze their scale and performance metrics.
| Host Name | Properties | Grossing Revenue | Stay Reviews | Avg Rating |
|---|---|---|---|---|
| Luciano | 40 | $327,209 | 350 | 4.86/5.0 |
| Diária Brasil | 20 | $179,300 | 540 | 4.74/5.0 |
| Pedro | 14 | $161,823 | 181 | 4.70/5.0 |
| Rei Dos Flats | 10 | $97,791 | 84 | 4.16/5.0 |
| Cyntia Moura | 5 | $73,162 | 67 | 4.90/5.0 |
| Pedro Henrique | 14 | $73,157 | 174 | 4.83/5.0 |
| Ana Maria | 1 | $70,315 | 14 | 4.93/5.0 |
| Alugueasy | 10 | $63,959 | 191 | 4.14/5.0 |
| Le Jardin | 5 | $48,549 | 131 | 4.92/5.0 |
| Prime Hospedagens | 12 | $42,640 | 263 | 4.47/5.0 |
Analyzing the strategies of top hosts, such as their property selection, pricing, and guest communication, can offer valuable lessons for optimizing your own Airbnb operations in Brasília.
Dive Deeper: Advanced Brasília STR Market Data (2026)
Ready to unlock more insights? AirROI provides access to advanced metrics and comprehensive Airbnb data for Brasília. Explore detailed analytics beyond this report to refine your investment strategy, optimize pricing, and maximize your vacation rental profits.
Explore Advanced MetricsBrasília Short-Term Rental Market Composition (2026): Property & Room Types
Room Type Distribution
Property Type Distribution
Market Composition Insights for Brasília
- The Brasília Airbnb market composition is heavily skewed towards Entire Home/Apt listings, which make up 82.4% of the 683 active rentals. This indicates strong guest preference for privacy and space.
- Looking at the property type distribution in Brasília, Apartment/Condo properties are the most common (80.1%), reflecting the local real estate landscape.
- The presence of 8.9% Hotel/Boutique listings indicates integration with traditional hospitality.
- Smaller segments like unique stays, outdoor/unique, others (combined 1.4%) offer potential for unique stay experiences.
Brasília Airbnb Room Capacity Analysis (2026): Bedroom Distribution
Distribution of Listings by Number of Bedrooms
Room Capacity Insights for Brasília
- The dominant room capacity in Brasília is 1 bedroom listings, making up 71.7% of the market. This suggests a strong demand for properties suitable for couples or solo travelers.
- Together, 1 bedroom and 2 bedrooms properties represent 82.2% of the active Airbnb listings in Brasília, indicating a high concentration in these sizes.
- With over half the market (71.7%) consisting of studios or 1-bedroom units, Brasília is particularly well-suited for individuals or couples.
- Listings with 3+ bedrooms (4.2%) represent a smaller niche, potentially indicating an underserved market for larger group accommodations in Brasília.
Brasília Vacation Rental Guest Capacity Trends (2026)
Distribution of Listings by Guest Capacity
Guest Capacity Insights for Brasília
- The most common guest capacity trend in Brasília vacation rentals is listings accommodating 2 guests (37.5%). This suggests the primary traveler segment is likely couples or solo travelers.
- Properties designed for 2 guests and 3 guests dominate the Brasília STR market, accounting for 58.0% of listings.
- On average, properties in Brasília are equipped to host 2.9 guests.
Brasília Airbnb Booking Patterns (2026): Available vs. Booked Days
Available Days Distribution
Booked Days Distribution
Booking Pattern Insights for Brasília
- The most common availability pattern in Brasília falls within the 271-366 days range, representing 58.1% of listings. This suggests many properties have significant open periods on their calendars.
- Approximately 95.4% of listings show high availability (181+ days open annually), indicating potential for increased bookings or specific owner usage patterns.
- For booked days, the 91-180 days range is most frequent in Brasília (39.5%), reflecting common guest stay durations or potential owner blocking patterns.
- A notable 5.7% of properties secure long booking periods (181+ days booked per year), highlighting successful long-term rental strategies or significant owner usage.
Brasília Airbnb Minimum Stay Requirements Analysis
Distribution of Listings by Minimum Night Requirement
1 Night
255 listings
37.3% of total
2 Nights
127 listings
18.6% of total
3 Nights
46 listings
6.7% of total
4-6 Nights
22 listings
3.2% of total
7-29 Nights
5 listings
0.7% of total
30+ Nights
228 listings
33.4% of total
Key Insights
- The most prevalent minimum stay requirement in Brasília is 1 Night, adopted by 37.3% of listings. This highlights the market's preference for shorter, flexible bookings.
- A significant segment (33.4%) caters to monthly stays (30+ nights) in Brasília, pointing to opportunities in the extended-stay market.
Recommendations
- Align with the market by considering a 1 Night minimum stay, as 37.3% of Brasília hosts use this setting.
- Explore offering discounts for stays of 30+ nights to attract the 33.4% of the market seeking extended stays.
- Adjust minimum nights based on seasonality – potentially shorter during low season and longer during peak demand periods in Brasília.
Brasília Airbnb Cancellation Policy Trends Analysis (2026)
Super Strict 30 Days
3 listings
0.4% of total
Limited
6 listings
0.9% of total
Flexible
216 listings
31.6% of total
Moderate
266 listings
38.9% of total
Firm
141 listings
20.6% of total
Strict
51 listings
7.5% of total
Cancellation Policy Insights for Brasília
- The prevailing Airbnb cancellation policy trend in Brasília is Moderate, used by 38.9% of listings.
- The market strongly favors guest-friendly terms, with 70.5% of listings offering Flexible or Moderate policies. This suggests guests in Brasília may expect booking flexibility.
- Strict cancellation policies are quite rare (7.5%), potentially making listings with this policy less competitive unless justified by high demand or property type.
Recommendations for Hosts
- Consider adopting a Moderate policy to align with the 38.9% market standard in Brasília.
- Using a Strict policy might deter some guests, as only 7.5% of listings use it. Evaluate if potential revenue protection outweighs possible lower booking rates.
- Regularly review your cancellation policy against competitors and market demand shifts in Brasília.
Brasília STR Booking Lead Time Analysis (2026)
Average Booking Lead Time by Month
Booking Lead Time Insights for Brasília
- The overall average booking lead time for vacation rentals in Brasília is 15 days.
- Guests book furthest in advance for stays during April (average 34 days), likely coinciding with peak travel demand or local events.
- The shortest booking windows occur for stays in May (average 1 days), indicating more last-minute travel plans during this time.
- Seasonally, Spring (20 days avg.) sees the longest lead times, while Summer (12 days avg.) has the shortest, reflecting typical travel planning cycles.
Recommendations for Hosts
- Use the overall average lead time (15 days) as a baseline for your pricing and availability strategy in Brasília.
- For April stays, consider implementing length-of-stay discounts or slightly higher rates for bookings made less than 34 days out to capitalize on advance planning.
- During May, focus on last-minute booking availability and promotions, as guests book with very short notice (1 days avg.).
- Target marketing efforts for the Spring season well in advance (at least 20 days) to capture early planners.
- Monitor your own booking lead times against these Brasília averages to identify opportunities for dynamic pricing adjustments.
Popular & Essential Airbnb Amenities in Brasília (2026)
Amenity Prevalence
Amenity Insights for Brasília
- Essential amenities in Brasília that guests expect include: Wifi. Lacking these (this) could significantly impact bookings.
- Popular amenities like TV, Kitchen, Air conditioning are common but not universal. Offering these can provide a competitive edge.
Recommendations for Hosts
- Ensure your listing includes all essential amenities for Brasília: Wifi.
- Prioritize adding missing essentials: Wifi.
- Consider adding popular differentiators like TV or Kitchen to increase appeal.
- Highlight unique or less common amenities you offer (e.g., hot tub, dedicated workspace, EV charger) in your listing description and photos.
- Regularly check competitor amenities in Brasília to stay competitive.
Brasília Airbnb Guest Demographics & Profile Analysis (2026)
Guest Profile Summary for Brasília
- The typical guest profile for Airbnb in Brasília consists of primarily domestic travelers (95%), often arriving from nearby São Paulo, typically belonging to the Post-2000s (Gen Z/Alpha) group (50%), primarily speaking Portuguese or English.
- Domestic travelers account for 95.0% of guests.
- Key international markets include Brazil (95%) and United States (1.4%).
- Top languages spoken are Portuguese (44.6%) followed by English (29.5%).
- A significant demographic segment is the Post-2000s (Gen Z/Alpha) group, representing 50% of guests.
Recommendations for Hosts
- Target domestic marketing efforts towards travelers from São Paulo and Brasília.
- Tailor amenities and listing descriptions to appeal to the dominant Post-2000s (Gen Z/Alpha) demographic (e.g., highlight fast WiFi, smart home features, local guides).
- Highlight unique local experiences or amenities relevant to the primary guest profile.
- Consider seasonal promotions aligned with peak travel times for key origin markets.
Nearby Short-Term Rental Market Comparison
How does the Brasília Airbnb market stack up against its neighbors? Compare key performance metrics like average monthly revenue, ADR, and occupancy rates in surrounding areas to understand the broader regional STR landscape.
| Market | Active Properties | Monthly Revenue | Daily Rate | Avg. Occupancy |
|---|---|---|---|---|
| Paranoá | 40 | $1,283 | $123.23 | 40% |
| Jardim Botânico | 56 | $994 | $105.50 | 39% |
| Pirenópolis | 1,571 | $848 | $122.51 | 28% |
| Alexânia | 119 | $826 | $157.61 | 23% |
| Santa Maria | 15 | $758 | $146.58 | 23% |
| Park Way | 25 | $751 | $91.48 | 28% |
| Ceilândia | 20 | $746 | $92.42 | 42% |
| Planaltina | 19 | $672 | $116.12 | 31% |
| Plano Piloto | 2,448 | $671 | $62.73 | 46% |
| Sobradinho | 80 | $661 | $103.99 | 33% |