Candangolândia Airbnb Market Analysis 2025: Short Term Rental Data & Vacation Rental Statistics in Federal District, Brazil
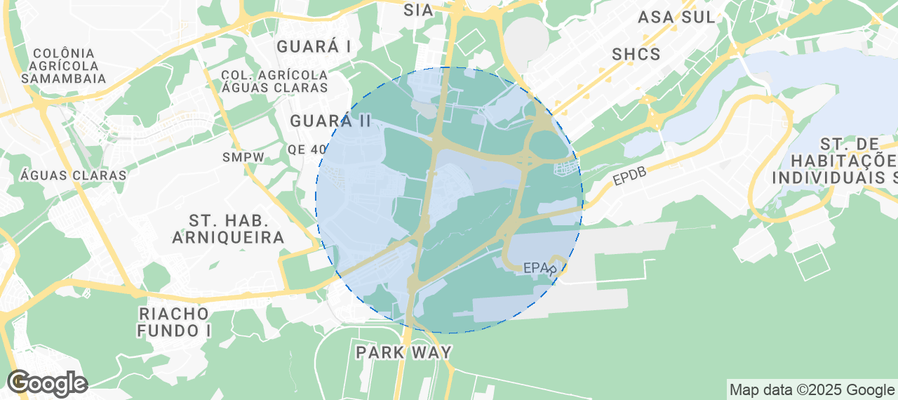
Is Airbnb profitable in Candangolândia in 2025? Explore comprehensive Airbnb analytics for Candangolândia, Federal District, Brazil to uncover income potential. This 2025 STR market report for Candangolândia, based on AirROI data from November 2024 to October 2025, reveals key trends in the niche market of 17 active listings.
Whether you're considering an Airbnb investment in Candangolândia, optimizing your existing vacation rental, or exploring rental arbitrage opportunities, understanding the Candangolândia Airbnb data is crucial. Leveraging the low regulation environment is key to maximizing your short term rental income potential. Let's dive into the specifics.
Key Candangolândia Airbnb Performance Metrics Overview
Monthly Airbnb Revenue Variations & Income Potential in Candangolândia (2025)
Understanding the monthly revenue variations for Airbnb listings in Candangolândia is key to maximizing your short term rental income potential. Seasonality significantly impacts earnings. Our analysis, based on data from the past 12 months, shows that the peak revenue month for STRs in Candangolândia is typically December, while September often presents the lowest earnings, highlighting opportunities for strategic pricing adjustments during shoulder and low seasons. Explore the typical Airbnb income in Candangolândia across different performance tiers:
- Best-in-class properties (Top 10%) achieve $871+ monthly, often utilizing dynamic pricing and superior guest experiences.
- Strong performing properties (Top 25%) earn $642 or more, indicating effective management and desirable locations/amenities.
- Typical properties (Median) generate around $398 per month, representing the average market performance.
- Entry-level properties (Bottom 25%) see earnings around $241, often with potential for optimization.
Average Monthly Airbnb Earnings Trend in Candangolândia
Candangolândia Airbnb Occupancy Rate Trends (2025)
Maximize your bookings by understanding the Candangolândia STR occupancy trends. Seasonal demand shifts significantly influence how often properties are booked. Typically, Novembersees the highest demand (peak season occupancy), while September experiences the lowest (low season). Effective strategies, like adjusting minimum stays or offering promotions, can boost occupancy during slower periods. Here's how different property tiers perform in Candangolândia:
- Best-in-class properties (Top 10%) achieve 81%+ occupancy, indicating high desirability and potentially optimized availability.
- Strong performing properties (Top 25%) maintain 71% or higher occupancy, suggesting good market fit and guest satisfaction.
- Typical properties (Median) have an occupancy rate around 56%.
- Entry-level properties (Bottom 25%) average 33% occupancy, potentially facing higher vacancy.
Average Monthly Occupancy Rate Trend in Candangolândia
Average Daily Rate (ADR) Airbnb Trends in Candangolândia (2025)
Effective short term rental pricing strategy in Candangolândia involves understanding monthly ADR fluctuations. The Average Daily Rate (ADR) for Airbnb in Candangolândia typically peaks in May and dips lowest during August. Leveraging Airbnb dynamic pricing tools or strategies based on this seasonality can significantly boost revenue. Here's a look at the typical nightly rates achieved:
- Best-in-class properties (Top 10%) command rates of $55+ per night, often due to premium features or locations.
- Strong performing properties (Top 25%) achieve nightly rates of $36 or more.
- Typical properties (Median) charge around $26 per night.
- Entry-level properties (Bottom 25%) earn around $20 per night.
Average Daily Rate (ADR) Trend by Month in Candangolândia
Get Live Candangolândia Market Intelligence 👇
Explore Real-time Analytics
Airbnb Seasonality Analysis & Trends in Candangolândia (2025)
Peak Season (December, November, October)
- Revenue averages $586 per month
- Occupancy rates average 58.9%
- Daily rates average $38
Shoulder Season
- Revenue averages $498 per month
- Occupancy maintains around 53.2%
- Daily rates hold near $37
Low Season (February, June, September)
- Revenue drops to average $414 per month
- Occupancy decreases to average 46.9%
- Daily rates adjust to average $36
Seasonality Insights for Candangolândia
- The Airbnb seasonality in Candangolândia shows moderate seasonality with distinct peak and low periods. While the sections above show seasonal averages, it's also insightful to look at the extremes:
- During the high season, the absolute peak month showcases Candangolândia's highest earning potential, with monthly revenues capable of climbing to $612, occupancy reaching a high of 69.8%, and ADRs peaking at $41.
- Conversely, the slowest single month of the year, typically falling within the low season, marks the market's lowest point. In this month, revenue might dip to $409, occupancy could drop to 41.1%, and ADRs may adjust down to $32.
- Understanding both the seasonal averages and these monthly peaks and troughs in revenue, occupancy, and ADR is crucial for maximizing your Airbnb profit potential in Candangolândia.
Seasonal Strategies for Maximizing Profit
- Peak Season: Maximize revenue through premium pricing and potentially longer minimum stays. Ensure high availability.
- Low Season: Offer competitive pricing, special promotions (e.g., extended stay discounts), and flexible cancellation policies. Target off-season travelers like remote workers or budget-conscious guests.
- Shoulder Seasons: Implement dynamic pricing that balances peak and low rates. Target weekend travelers or specific events. Offer slightly more flexible terms than peak season.
- Regularly analyze your own performance against these Candangolândia seasonality benchmarks and adjust your pricing and availability strategy accordingly.
Best Areas for Airbnb Investment in Candangolândia (2025)
Exploring the top neighborhoods for short-term rentals in Candangolândia? This section highlights key areas, outlining why they are attractive for hosts and guests, along with notable local attractions. Consider these locations based on your target guest profile and investment strategy.
| Neighborhood / Area | Why Host Here? (Target Guests & Appeal) | Key Attractions & Landmarks |
|---|---|---|
| Centro | Candangolândia's commercial hub with access to local shops and services. A great location for visitors wanting to explore the local lifestyle and amenities. | Candangolândia Cultural Center, local markets, Candangolândia Park |
| Setor de Mansões | A residential area known for its spacious houses and green spaces. Appeals to families and long-term visitors looking for a peaceful stay. | local parks, residential comfort, quiet streets |
| Setor de Habitação | Primarily residential, this area offers a glimpse into everyday life in Candangolândia, ideal for tourists wanting a local experience. | community events, local dining, close to main roads |
| Shopping Candangolândia | The main shopping area in town, featuring many stores, eateries, and entertainment. Ideal for tourists who enjoy shopping and dining. | Shopping malls, restaurants, cinemas |
| Lago Norte | A nearby upscale neighborhood known for its lakeside views and tranquil atmosphere. Great for those seeking relaxation and scenic beauty. | Lago Norte waterfront, parks, walking trails |
| Estação do Metro | Conveniently located near transportation hubs, making it easy for guests to access other areas of the Federal District. | Metro station, buses, local shops |
| Parque Nacional de Brasília | Though a bit further from Candangolândia, this national park offers amazing nature views and outdoor activities, popular among nature lovers. | hiking trails, picnic areas, nature tours |
| Avenida principal | The main avenue in the region, bustling with restaurants and shops, ideal for tourists looking for accessibility and local flavor. | restaurants, cafes, local businesses |
Understanding Airbnb License Requirements & STR Laws in Candangolândia (2025)
While Candangolândia, Federal District, Brazil currently shows low STR regulations, specific Airbnb license requirements might still exist or change. Always verify the latest short term rental regulations and Airbnb license requirements directly with local government authorities for Candangolândia to ensure full compliance before hosting.
(Source: AirROI data, 2025, finding no licensed listings among those analyzed)
Top Performing Airbnb Properties in Candangolândia (2025)
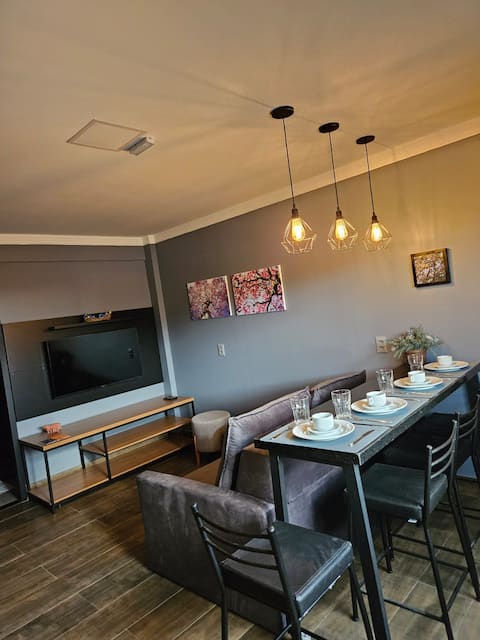
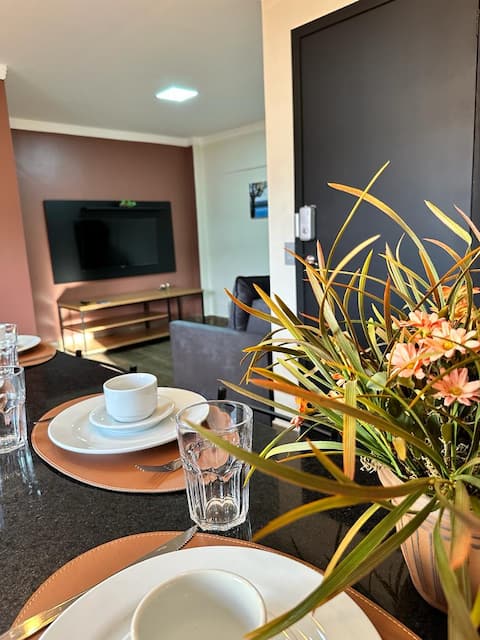
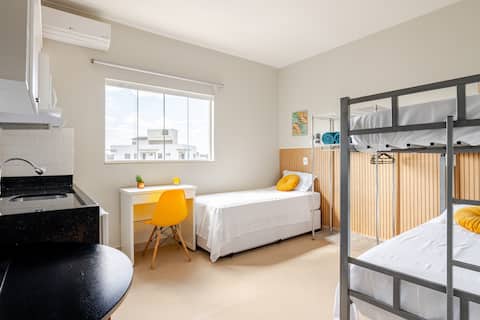
Benchmark your potential! Explore examples of top-performing Airbnb properties in Candangolândiabased on Trailing Twelve Month (TTM) revenue. Analyze their characteristics, revenue, occupancy rate, and ADR to understand what drives success in this market.
House of God
Entire Place • 4 bedrooms
Apartment 02-Up to 4 people-Near the airport
Entire Place • 1 bedroom
beautiful 2-bedroom ground floor apartment
Entire Place • 2 bedrooms
Apartment 03-Up to 4 people-Near the airport
Entire Place • 1 bedroom
Apartment 01-Up to 4 people-Near the airport
Entire Place • 1 bedroom
Modern, Cozy and well located
Entire Place • 1 bedroom
Note: Performance varies based on location, size, amenities, seasonality, and management quality. Data reflects the past 12 months.
Top Performing Airbnb Hosts in Candangolândia (2025)
Learn from the best! This table showcases top-performing Airbnb hosts in Candangolândia based on the number of properties managed and estimated total revenue over the past year. Analyze their scale and performance metrics.
| Host Name | Properties | Grossing Revenue | Stay Reviews | Avg Rating |
|---|---|---|---|---|
| Marlene | 3 | $22,708 | 219 | 5.00/5.0 |
| D. Dió. | 1 | $14,792 | 46 | 4.89/5.0 |
| Teles | 3 | $10,064 | 237 | 4.94/5.0 |
| Regina | 2 | $8,773 | 106 | 5.00/5.0 |
| Junior Lima | 1 | $8,372 | 15 | 4.93/5.0 |
| Lótus Flat & Studio (Hudson) | 3 | $7,235 | 43 | 4.74/5.0 |
| Mourão | 1 | $4,253 | 19 | 4.84/5.0 |
| Cristiane | 1 | $3,081 | 48 | 4.98/5.0 |
| Débora | 1 | $2,671 | 12 | 5.00/5.0 |
| Maria Helena | 1 | $174 | 21 | 4.95/5.0 |
Analyzing the strategies of top hosts, such as their property selection, pricing, and guest communication, can offer valuable lessons for optimizing your own Airbnb operations in Candangolândia.
Dive Deeper: Advanced Candangolândia STR Market Data (2025)
Ready to unlock more insights? AirROI provides access to advanced metrics and comprehensive Airbnb data for Candangolândia. Explore detailed analytics beyond this report to refine your investment strategy, optimize pricing, and maximize your vacation rental profits.
Explore Advanced MetricsCandangolândia Short-Term Rental Market Composition (2025): Property & Room Types
Room Type Distribution
Property Type Distribution
Market Composition Insights for Candangolândia
- The Candangolândia Airbnb market composition is heavily skewed towards Entire Home/Apt listings, which make up 100% of the 17 active rentals. This indicates strong guest preference for privacy and space.
- Looking at the property type distribution in Candangolândia, Apartment/Condo properties are the most common (76.5%), reflecting the local real estate landscape.
Candangolândia Airbnb Room Capacity Analysis (2025): Bedroom Distribution
Distribution of Listings by Number of Bedrooms
Room Capacity Insights for Candangolândia
- The dominant room capacity in Candangolândia is 1 bedroom listings, making up 70.6% of the market. This suggests a strong demand for properties suitable for couples or solo travelers.
- Together, 1 bedroom and 2 bedrooms properties represent 94.1% of the active Airbnb listings in Candangolândia, indicating a high concentration in these sizes.
- With over half the market (70.6%) consisting of studios or 1-bedroom units, Candangolândia is particularly well-suited for individuals or couples.
- Listings with 3+ bedrooms (5.9%) represent a smaller niche, potentially indicating an underserved market for larger group accommodations in Candangolândia.
Candangolândia Vacation Rental Guest Capacity Trends (2025)
Distribution of Listings by Guest Capacity
Guest Capacity Insights for Candangolândia
- The most common guest capacity trend in Candangolândia vacation rentals is listings accommodating 4 guests (52.9%). This suggests the primary traveler segment is likely small families or groups.
- Properties designed for 4 guests and 3 guests dominate the Candangolândia STR market, accounting for 76.4% of listings.
- 11.8% of properties accommodate 6+ guests, serving the market segment for larger families or group travel in Candangolândia.
- On average, properties in Candangolândia are equipped to host 3.9 guests.
Candangolândia Airbnb Booking Patterns (2025): Available vs. Booked Days
Available Days Distribution
Booked Days Distribution
Booking Pattern Insights for Candangolândia
- The most common availability pattern in Candangolândia falls within the 91-180 days range, representing 41.2% of listings. This suggests many properties have significant open periods on their calendars.
- Approximately 52.9% of listings show high availability (181+ days open annually), indicating potential for increased bookings or specific owner usage patterns.
- For booked days, the 181-270 days range is most frequent in Candangolândia (41.2%), reflecting common guest stay durations or potential owner blocking patterns.
- A notable 47.1% of properties secure long booking periods (181+ days booked per year), highlighting successful long-term rental strategies or significant owner usage.
Candangolândia Airbnb Minimum Stay Requirements Analysis
Distribution of Listings by Minimum Night Requirement
1 Night
5 listings
29.4% of total
2 Nights
6 listings
35.3% of total
3 Nights
2 listings
11.8% of total
7-29 Nights
1 listings
5.9% of total
30+ Nights
3 listings
17.6% of total
Key Insights
- The most prevalent minimum stay requirement in Candangolândia is 2 Nights, adopted by 35.3% of listings. This highlights the market's preference for shorter, flexible bookings.
- A strong majority (64.7%) of the Candangolândia Airbnb data shows acceptance of very short stays (1-2 nights), indicating a dynamic, high-turnover market.
- A significant segment (17.6%) caters to monthly stays (30+ nights) in Candangolândia, pointing to opportunities in the extended-stay market.
Recommendations
- Align with the market by considering a 2 Nights minimum stay, as 35.3% of Candangolândia hosts use this setting.
- If feasible, allowing 1-night stays, especially midweek or during low season, could capture last-minute bookings, as only 29.4% currently do.
- Explore offering discounts for stays of 30+ nights to attract the 17.6% of the market seeking extended stays.
- Adjust minimum nights based on seasonality – potentially shorter during low season and longer during peak demand periods in Candangolândia.
Candangolândia Airbnb Cancellation Policy Trends Analysis (2025)
Flexible
8 listings
47.1% of total
Moderate
4 listings
23.5% of total
Firm
5 listings
29.4% of total
Cancellation Policy Insights for Candangolândia
- The prevailing Airbnb cancellation policy trend in Candangolândia is Flexible, used by 47.1% of listings.
- The market strongly favors guest-friendly terms, with 70.6% of listings offering Flexible or Moderate policies. This suggests guests in Candangolândia may expect booking flexibility.
Recommendations for Hosts
- Consider adopting a Flexible policy to align with the 47.1% market standard in Candangolândia.
- Regularly review your cancellation policy against competitors and market demand shifts in Candangolândia.
Candangolândia STR Booking Lead Time Analysis (2025)
Average Booking Lead Time by Month
Booking Lead Time Insights for Candangolândia
- The overall average booking lead time for vacation rentals in Candangolândia is 20 days.
- Guests book furthest in advance for stays during January (average 33 days), likely coinciding with peak travel demand or local events.
- The shortest booking windows occur for stays in February (average 10 days), indicating more last-minute travel plans during this time.
- Seasonally, Winter (21 days avg.) sees the longest lead times, while Fall (17 days avg.) has the shortest, reflecting typical travel planning cycles.
Recommendations for Hosts
- Use the overall average lead time (20 days) as a baseline for your pricing and availability strategy in Candangolândia.
- For January stays, consider implementing length-of-stay discounts or slightly higher rates for bookings made less than 33 days out to capitalize on advance planning.
- During February, focus on last-minute booking availability and promotions, as guests book with very short notice (10 days avg.).
- Target marketing efforts for the Winter season well in advance (at least 21 days) to capture early planners.
- Monitor your own booking lead times against these Candangolândia averages to identify opportunities for dynamic pricing adjustments.
Popular & Essential Airbnb Amenities in Candangolândia (2025)
Amenity Prevalence
Amenity Insights for Candangolândia
- Essential amenities in Candangolândia that guests expect include: TV. Lacking these (this) could significantly impact bookings.
- Popular amenities like Wifi, Kitchen, Dishes and silverware are common but not universal. Offering these can provide a competitive edge.
- Warning: Wifi is not universally provided but is considered essential globally. Ensure reliable Wifi is offered.
Recommendations for Hosts
- Ensure your listing includes all essential amenities for Candangolândia: TV.
- Consider adding popular differentiators like Wifi or Kitchen to increase appeal.
- Highlight unique or less common amenities you offer (e.g., hot tub, dedicated workspace, EV charger) in your listing description and photos.
- Regularly check competitor amenities in Candangolândia to stay competitive.
Candangolândia Airbnb Guest Demographics & Profile Analysis (2025)
Guest Profile Summary for Candangolândia
- The typical guest profile for Airbnb in Candangolândia consists of primarily domestic travelers (91%), often arriving from nearby São Paulo, typically belonging to the Post-2000s (Gen Z/Alpha) group (50%), primarily speaking Portuguese or English.
- Domestic travelers account for 91.1% of guests.
- Key international markets include Brazil (91.1%) and United States (2.4%).
- Top languages spoken are Portuguese (49.5%) followed by English (28.6%).
- A significant demographic segment is the Post-2000s (Gen Z/Alpha) group, representing 50% of guests.
Recommendations for Hosts
- Target domestic marketing efforts towards travelers from São Paulo and Goiânia.
- Tailor amenities and listing descriptions to appeal to the dominant Post-2000s (Gen Z/Alpha) demographic (e.g., highlight fast WiFi, smart home features, local guides).
- Highlight unique local experiences or amenities relevant to the primary guest profile.
- Consider seasonal promotions aligned with peak travel times for key origin markets.
Nearby Short-Term Rental Market Comparison
How does the Candangolândia Airbnb market stack up against its neighbors? Compare key performance metrics like average monthly revenue, ADR, and occupancy rates in surrounding areas to understand the broader regional STR landscape.
| Market | Active Properties | Monthly Revenue | Daily Rate | Avg. Occupancy |
|---|---|---|---|---|
| Paranoá | 41 | $1,237 | $117.06 | 38% |
| Jardim Botânico | 65 | $977 | $111.85 | 38% |
| Santa Maria | 15 | $960 | $139.34 | 25% |
| Pirenópolis | 1,510 | $919 | $123.88 | 29% |
| Alexânia | 125 | $820 | $158.17 | 22% |
| Lago Sul | 57 | $777 | $90.49 | 32% |
| Ceilândia | 22 | $771 | $88.79 | 44% |
| Planaltina | 17 | $752 | $121.04 | 34% |
| Plano Piloto | 2,616 | $667 | $62.31 | 46% |
| Park Way | 31 | $664 | $92.52 | 27% |