Ceilândia Airbnb Market Analysis 2026: Short Term Rental Data & Vacation Rental Statistics in Federal District, Brazil
Is Airbnb profitable in Ceilândia in 2026? Explore comprehensive Airbnb analytics for Ceilândia, Federal District, Brazil to uncover income potential. This 2026 STR market report for Ceilândia, based on AirROI data from February 2025 to January 2026, reveals key trends in the niche market of 20 active listings.
Whether you're considering an Airbnb investment in Ceilândia, optimizing your existing vacation rental, or exploring rental arbitrage opportunities, understanding the Ceilândia Airbnb data is crucial. Leveraging the low regulation environment is key to maximizing your short term rental income potential. Let's dive into the specifics.
Key Ceilândia Airbnb Performance Metrics Overview
Monthly Airbnb Revenue Variations & Income Potential in Ceilândia (2026)
Understanding the monthly revenue variations for Airbnb listings in Ceilândia is key to maximizing your short term rental income potential. Seasonality significantly impacts earnings. Our analysis, based on data from the past 12 months, shows that the peak revenue month for STRs in Ceilândia is typically March, while October often presents the lowest earnings, highlighting opportunities for strategic pricing adjustments during shoulder and low seasons. Explore the typical Airbnb income in Ceilândia across different performance tiers:
- Best-in-class properties (Top 10%) achieve $2,306+ monthly, often utilizing dynamic pricing and superior guest experiences.
- Strong performing properties (Top 25%) earn $1,243 or more, indicating effective management and desirable locations/amenities.
- Typical properties (Median) generate around $592 per month, representing the average market performance.
- Entry-level properties (Bottom 25%) see earnings around $296, often with potential for optimization.
Average Monthly Airbnb Earnings Trend in Ceilândia
Ceilândia Airbnb Occupancy Rate Trends (2026)
Maximize your bookings by understanding the Ceilândia STR occupancy trends. Seasonal demand shifts significantly influence how often properties are booked. Typically, Februarysees the highest demand (peak season occupancy), while January experiences the lowest (low season). Effective strategies, like adjusting minimum stays or offering promotions, can boost occupancy during slower periods. Here's how different property tiers perform in Ceilândia:
- Best-in-class properties (Top 10%) achieve 75%+ occupancy, indicating high desirability and potentially optimized availability.
- Strong performing properties (Top 25%) maintain 56% or higher occupancy, suggesting good market fit and guest satisfaction.
- Typical properties (Median) have an occupancy rate around 39%.
- Entry-level properties (Bottom 25%) average 26% occupancy, potentially facing higher vacancy.
Average Monthly Occupancy Rate Trend in Ceilândia
Average Daily Rate (ADR) Airbnb Trends in Ceilândia (2026)
Effective short term rental pricing strategy in Ceilândia involves understanding monthly ADR fluctuations. The Average Daily Rate (ADR) for Airbnb in Ceilândia typically peaks in December and dips lowest during February. Leveraging Airbnb dynamic pricing tools or strategies based on this seasonality can significantly boost revenue. Here's a look at the typical nightly rates achieved:
- Best-in-class properties (Top 10%) command rates of $286+ per night, often due to premium features or locations.
- Strong performing properties (Top 25%) achieve nightly rates of $101 or more.
- Typical properties (Median) charge around $36 per night.
- Entry-level properties (Bottom 25%) earn around $20 per night.
Average Daily Rate (ADR) Trend by Month in Ceilândia
Get Live Ceilândia Market Intelligence 👇

Explore Real-time Analytics
Airbnb Seasonality Analysis & Trends in Ceilândia (2026)
Peak Season (March, April, December)
- Revenue averages $1,397 per month
- Occupancy rates average 44.1%
- Daily rates average $86
Shoulder Season
- Revenue averages $1,060 per month
- Occupancy maintains around 47.3%
- Daily rates hold near $85
Low Season (January, June, October)
- Revenue drops to average $746 per month
- Occupancy decreases to average 32.2%
- Daily rates adjust to average $89
Seasonality Insights for Ceilândia
- The Airbnb seasonality in Ceilândia shows highly seasonal trends requiring careful strategy. While the sections above show seasonal averages, it's also insightful to look at the extremes:
- During the high season, the absolute peak month showcases Ceilândia's highest earning potential, with monthly revenues capable of climbing to $1,428, occupancy reaching a high of 63.6%, and ADRs peaking at $99.
- Conversely, the slowest single month of the year, typically falling within the low season, marks the market's lowest point. In this month, revenue might dip to $666, occupancy could drop to 23.7%, and ADRs may adjust down to $75.
- Understanding both the seasonal averages and these monthly peaks and troughs in revenue, occupancy, and ADR is crucial for maximizing your Airbnb profit potential in Ceilândia.
Seasonal Strategies for Maximizing Profit
- Peak Season: Maximize revenue through premium pricing and potentially longer minimum stays. Ensure high availability.
- Low Season: Offer competitive pricing, special promotions (e.g., extended stay discounts), and flexible cancellation policies. Target off-season travelers like remote workers or budget-conscious guests.
- Shoulder Seasons: Implement dynamic pricing that balances peak and low rates. Target weekend travelers or specific events. Offer slightly more flexible terms than peak season.
- Regularly analyze your own performance against these Ceilândia seasonality benchmarks and adjust your pricing and availability strategy accordingly.
Best Areas for Airbnb Investment in Ceilândia (2026)
Exploring the top neighborhoods for short-term rentals in Ceilândia? This section highlights key areas, outlining why they are attractive for hosts and guests, along with notable local attractions. Consider these locations based on your target guest profile and investment strategy.
| Neighborhood / Area | Why Host Here? (Target Guests & Appeal) | Key Attractions & Landmarks |
|---|---|---|
| Centro | The heart of Ceilândia, offering proximity to public transportation, shopping, and local services. Popular among visitors for its accessibility and vibrant local life. | Ceilândia Shopping, Catedral de Ceilândia, Cultural Center, Public Parks, Local Markets |
| Ceilândia Sul | A residential area known for its community feel and local amenities. Attractive for visitors seeking a more authentic and laid-back experience away from the hustle and bustle. | Parque da Cidade 2, Local eateries, Artisan markets, Community events, Nearby sports facilities |
| Ceilândia Norte | Vibrant area with a mix of residential and commercial spaces, ideal for families traveling to the region. Offers various attractions and easy access to main roads. | Stadiums, Local parks, Children's play areas, Shopping options, Transport hubs |
| Taguatinga | Close to Ceilândia, Taguatinga has a lively commercial atmosphere and is an attractive option for guests looking to explore the wider Federal District. | Taguatinga Shopping, Padre Lúcio de Souza Park, Associação Cultural, Dining and nightlife options, Art fairs |
| Samambaia | A quieter suburban area, perfect for families or short-term visitors wanting to stay in a residential environment yet close to urban conveniences. | Parks, Local restaurants, Sports clubs, Cultural activities, Shopping centers |
| Recanto das Emas | Known for its nature spots and peaceful atmosphere, it is a good choice for nature lovers and those looking for a break from city life while still being near Ceilândia. | Natural parks, Hiking trails, Riverside activities, Community events, Local festivals |
| São Sebastião | A neighboring region with several cultural events and local attractions, appealing to guests looking for authentic regional experiences. | Local artisan markets, Cultural festivals, Parks, Historical sites, Dining spots |
| Lago Sul | An upscale area with beautiful views and luxurious amenities, appealing to high-end travelers seeking exclusivity while being close to urban attractions. | Luxury dining, High-end shopping, Natural reserves, Cultural institutions, Art galleries |
Understanding Airbnb License Requirements & STR Laws in Ceilândia (2026)
While Ceilândia, Federal District, Brazil currently shows low STR regulations, specific Airbnb license requirements might still exist or change. Always verify the latest short term rental regulations and Airbnb license requirements directly with local government authorities for Ceilândia to ensure full compliance before hosting.
(Source: AirROI data, 2026, finding no licensed listings among those analyzed)
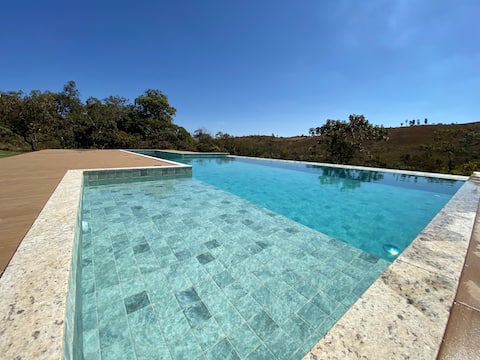
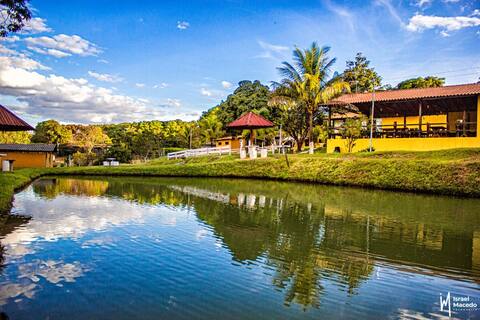
Top Performing Airbnb Properties in Ceilândia (2026)
Benchmark your potential! Explore examples of top-performing Airbnb properties in Ceilândiabased on Trailing Twelve Month (TTM) revenue. Analyze their characteristics, revenue, occupancy rate, and ADR to understand what drives success in this market.
Need to Rest?
Entire Place • 6 bedrooms
Ranch, exclusive with swimming pool and fishing - 14P
Entire Place • 6 bedrooms

Nice country house with heated pool
Entire Place • 3 bedrooms

Soberano - Bungalow in DF
Entire Place • 1 bedroom

Apollo-O bangalô mais acolhedor do DF
Entire Place • 1 bedroom

Beautiful landscape, Swimming pool, Nature, country house
Entire Place • 1 bedroom
Note: Performance varies based on location, size, amenities, seasonality, and management quality. Data reflects the past 12 months.
Top Performing Airbnb Hosts in Ceilândia (2026)
Learn from the best! This table showcases top-performing Airbnb hosts in Ceilândia based on the number of properties managed and estimated total revenue over the past year. Analyze their scale and performance metrics.
| Host Name | Properties | Grossing Revenue | Stay Reviews | Avg Rating |
|---|---|---|---|---|
| Jônatas | 1 | $59,174 | 27 | 5.00/5.0 |
| Alexandre | 2 | $28,123 | 33 | 4.95/5.0 |
| Ronan Vander | 1 | $25,347 | 9 | 4.78/5.0 |
| Evandro | 1 | $14,578 | 51 | 4.96/5.0 |
| Carlos | 3 | $10,118 | 67 | 4.54/5.0 |
| Geraldo Neto | 1 | $9,895 | 95 | 4.93/5.0 |
| Glauber | 1 | $7,983 | 3 | 5.00/5.0 |
| Pedro | 3 | $7,276 | 70 | 4.80/5.0 |
| Raquel | 1 | $5,966 | 28 | 4.86/5.0 |
| Marcos | 1 | $4,932 | 14 | 5.00/5.0 |
Analyzing the strategies of top hosts, such as their property selection, pricing, and guest communication, can offer valuable lessons for optimizing your own Airbnb operations in Ceilândia.
Dive Deeper: Advanced Ceilândia STR Market Data (2026)
Ready to unlock more insights? AirROI provides access to advanced metrics and comprehensive Airbnb data for Ceilândia. Explore detailed analytics beyond this report to refine your investment strategy, optimize pricing, and maximize your vacation rental profits.
Explore Advanced MetricsCeilândia Short-Term Rental Market Composition (2026): Property & Room Types
Room Type Distribution
Property Type Distribution
Market Composition Insights for Ceilândia
- The Ceilândia Airbnb market composition is heavily skewed towards Entire Home/Apt listings, which make up 95% of the 20 active rentals. This indicates strong guest preference for privacy and space.
- Looking at the property type distribution in Ceilândia, Apartment/Condo properties are the most common (50%), reflecting the local real estate landscape.
- Houses represent a significant 35% portion, catering likely to families or larger groups.
Ceilândia Airbnb Room Capacity Analysis (2026): Bedroom Distribution
Distribution of Listings by Number of Bedrooms
Room Capacity Insights for Ceilândia
- The dominant room capacity in Ceilândia is 1 bedroom listings, making up 55% of the market. This suggests a strong demand for properties suitable for couples or solo travelers.
- Together, 1 bedroom and 5+ bedrooms properties represent 70.0% of the active Airbnb listings in Ceilândia, indicating a high concentration in these sizes.
- With over half the market (55%) consisting of studios or 1-bedroom units, Ceilândia is particularly well-suited for individuals or couples.
- A significant 30.0% of listings offer 3+ bedrooms, catering to larger groups and families seeking more space in Ceilândia.
Ceilândia Vacation Rental Guest Capacity Trends (2026)
Distribution of Listings by Guest Capacity
Guest Capacity Insights for Ceilândia
- The most common guest capacity trend in Ceilândia vacation rentals is listings accommodating 2 guests (35%). This suggests the primary traveler segment is likely couples or solo travelers.
- Properties designed for 2 guests and 8+ guests dominate the Ceilândia STR market, accounting for 65.0% of listings.
- 30.0% of properties accommodate 6+ guests, serving the market segment for larger families or group travel in Ceilândia.
- On average, properties in Ceilândia are equipped to host 4.3 guests.
Ceilândia Airbnb Booking Patterns (2026): Available vs. Booked Days
Available Days Distribution
Booked Days Distribution
Booking Pattern Insights for Ceilândia
- The most common availability pattern in Ceilândia falls within the 181-270 days range, representing 65% of listings. This suggests many properties have significant open periods on their calendars.
- Approximately 95.0% of listings show high availability (181+ days open annually), indicating potential for increased bookings or specific owner usage patterns.
- For booked days, the 91-180 days range is most frequent in Ceilândia (65%), reflecting common guest stay durations or potential owner blocking patterns.
- A notable 5.0% of properties secure long booking periods (181+ days booked per year), highlighting successful long-term rental strategies or significant owner usage.
Ceilândia Airbnb Minimum Stay Requirements Analysis
Distribution of Listings by Minimum Night Requirement
1 Night
4 listings
20% of total
2 Nights
4 listings
20% of total
4-6 Nights
7 listings
35% of total
30+ Nights
5 listings
25% of total
Key Insights
- The most prevalent minimum stay requirement in Ceilândia is 4-6 Nights, adopted by 35% of listings. This highlights the market's preference for longer commitments.
- A significant segment (25%) caters to monthly stays (30+ nights) in Ceilândia, pointing to opportunities in the extended-stay market.
Recommendations
- Align with the market by considering a 4-6 Nights minimum stay, as 35% of Ceilândia hosts use this setting.
- If feasible, allowing 1-night stays, especially midweek or during low season, could capture last-minute bookings, as only 20% currently do.
- Explore offering discounts for stays of 30+ nights to attract the 25% of the market seeking extended stays.
- Adjust minimum nights based on seasonality – potentially shorter during low season and longer during peak demand periods in Ceilândia.
Ceilândia Airbnb Cancellation Policy Trends Analysis (2026)
Flexible
5 listings
25% of total
Moderate
5 listings
25% of total
Firm
10 listings
50% of total
Cancellation Policy Insights for Ceilândia
- The prevailing Airbnb cancellation policy trend in Ceilândia is Firm, used by 50% of listings.
- There's a relatively balanced mix between guest-friendly (50.0%) and stricter (50.0%) policies, offering choices for different guest needs.
Recommendations for Hosts
- Consider adopting a Firm policy to align with the 50% market standard in Ceilândia.
- Regularly review your cancellation policy against competitors and market demand shifts in Ceilândia.
Ceilândia STR Booking Lead Time Analysis (2026)
Average Booking Lead Time by Month
Booking Lead Time Insights for Ceilândia
- The overall average booking lead time for vacation rentals in Ceilândia is 24 days.
- Guests book furthest in advance for stays during December (average 49 days), likely coinciding with peak travel demand or local events.
- The shortest booking windows occur for stays in October (average 13 days), indicating more last-minute travel plans during this time.
- Seasonally, Winter (32 days avg.) sees the longest lead times, while Spring (19 days avg.) has the shortest, reflecting typical travel planning cycles.
Recommendations for Hosts
- Use the overall average lead time (24 days) as a baseline for your pricing and availability strategy in Ceilândia.
- For December stays, consider implementing length-of-stay discounts or slightly higher rates for bookings made less than 49 days out to capitalize on advance planning.
- During October, focus on last-minute booking availability and promotions, as guests book with very short notice (13 days avg.).
- Target marketing efforts for the Winter season well in advance (at least 32 days) to capture early planners.
- Monitor your own booking lead times against these Ceilândia averages to identify opportunities for dynamic pricing adjustments.
Popular & Essential Airbnb Amenities in Ceilândia (2026)
Amenity Prevalence
Amenity Insights for Ceilândia
- Essential amenities in Ceilândia that guests expect include: Kitchen, Wifi, TV. Lacking these (any) could significantly impact bookings.
- Popular amenities like Pets allowed, Dishes and silverware, Washer are common but not universal. Offering these can provide a competitive edge.
Recommendations for Hosts
- Ensure your listing includes all essential amenities for Ceilândia: Kitchen, Wifi, TV.
- Prioritize adding missing essentials: TV.
- Consider adding popular differentiators like Pets allowed or Dishes and silverware to increase appeal.
- Highlight unique or less common amenities you offer (e.g., hot tub, dedicated workspace, EV charger) in your listing description and photos.
- Regularly check competitor amenities in Ceilândia to stay competitive.
Ceilândia Airbnb Guest Demographics & Profile Analysis (2026)
Guest Profile Summary for Ceilândia
- The typical guest profile for Airbnb in Ceilândia consists of primarily domestic travelers (93%), often arriving from nearby Brasilia, typically belonging to the Post-2000s (Gen Z/Alpha) group (50%), primarily speaking Portuguese or English.
- Domestic travelers account for 93.1% of guests.
- Key international markets include Brazil (93.1%) and United States (3.4%).
- Top languages spoken are Portuguese (65.2%) followed by English (21.7%).
- A significant demographic segment is the Post-2000s (Gen Z/Alpha) group, representing 50% of guests.
Recommendations for Hosts
- Target domestic marketing efforts towards travelers from Brasilia and São Paulo.
- Tailor amenities and listing descriptions to appeal to the dominant Post-2000s (Gen Z/Alpha) demographic (e.g., highlight fast WiFi, smart home features, local guides).
- Highlight unique local experiences or amenities relevant to the primary guest profile.
- Consider seasonal promotions aligned with peak travel times for key origin markets.
Nearby Short-Term Rental Market Comparison
How does the Ceilândia Airbnb market stack up against its neighbors? Compare key performance metrics like average monthly revenue, ADR, and occupancy rates in surrounding areas to understand the broader regional STR landscape.
| Market | Active Properties | Monthly Revenue | Daily Rate | Avg. Occupancy |
|---|---|---|---|---|
| Paranoá | 40 | $1,283 | $123.23 | 40% |
| Jardim Botânico | 56 | $994 | $105.50 | 39% |
| Pirenópolis | 1,571 | $848 | $122.51 | 28% |
| Alexânia | 119 | $826 | $157.61 | 23% |
| Santa Maria | 15 | $758 | $146.58 | 23% |
| Park Way | 25 | $751 | $91.48 | 28% |
| Senador Canedo | 22 | $691 | $139.79 | 25% |
| Planaltina | 19 | $672 | $116.12 | 31% |
| Plano Piloto | 2,448 | $671 | $62.73 | 46% |
| Sobradinho | 80 | $661 | $103.99 | 33% |