Jardim Botânico Airbnb Market Analysis 2026: Short Term Rental Data & Vacation Rental Statistics in Federal District, Brazil
Is Airbnb profitable in Jardim Botânico in 2026? Explore comprehensive Airbnb analytics for Jardim Botânico, Federal District, Brazil to uncover income potential. This 2026 STR market report for Jardim Botânico, based on AirROI data from February 2025 to January 2026, reveals key trends in the niche market of 56 active listings.
Whether you're considering an Airbnb investment in Jardim Botânico, optimizing your existing vacation rental, or exploring rental arbitrage opportunities, understanding the Jardim Botânico Airbnb data is crucial. Leveraging the low regulation environment is key to maximizing your short term rental income potential. Let's dive into the specifics.
Key Jardim Botânico Airbnb Performance Metrics Overview
Monthly Airbnb Revenue Variations & Income Potential in Jardim Botânico (2026)
Understanding the monthly revenue variations for Airbnb listings in Jardim Botânico is key to maximizing your short term rental income potential. Seasonality significantly impacts earnings. Our analysis, based on data from the past 12 months, shows that the peak revenue month for STRs in Jardim Botânico is typically March, while June often presents the lowest earnings, highlighting opportunities for strategic pricing adjustments during shoulder and low seasons. Explore the typical Airbnb income in Jardim Botânico across different performance tiers:
- Best-in-class properties (Top 10%) achieve $3,612+ monthly, often utilizing dynamic pricing and superior guest experiences.
- Strong performing properties (Top 25%) earn $1,783 or more, indicating effective management and desirable locations/amenities.
- Typical properties (Median) generate around $813 per month, representing the average market performance.
- Entry-level properties (Bottom 25%) see earnings around $365, often with potential for optimization.
Average Monthly Airbnb Earnings Trend in Jardim Botânico
Jardim Botânico Airbnb Occupancy Rate Trends (2026)
Maximize your bookings by understanding the Jardim Botânico STR occupancy trends. Seasonal demand shifts significantly influence how often properties are booked. Typically, Marchsees the highest demand (peak season occupancy), while January experiences the lowest (low season). Effective strategies, like adjusting minimum stays or offering promotions, can boost occupancy during slower periods. Here's how different property tiers perform in Jardim Botânico:
- Best-in-class properties (Top 10%) achieve 81%+ occupancy, indicating high desirability and potentially optimized availability.
- Strong performing properties (Top 25%) maintain 65% or higher occupancy, suggesting good market fit and guest satisfaction.
- Typical properties (Median) have an occupancy rate around 38%.
- Entry-level properties (Bottom 25%) average 19% occupancy, potentially facing higher vacancy.
Average Monthly Occupancy Rate Trend in Jardim Botânico
Average Daily Rate (ADR) Airbnb Trends in Jardim Botânico (2026)
Effective short term rental pricing strategy in Jardim Botânico involves understanding monthly ADR fluctuations. The Average Daily Rate (ADR) for Airbnb in Jardim Botânico typically peaks in January and dips lowest during February. Leveraging Airbnb dynamic pricing tools or strategies based on this seasonality can significantly boost revenue. Here's a look at the typical nightly rates achieved:
- Best-in-class properties (Top 10%) command rates of $228+ per night, often due to premium features or locations.
- Strong performing properties (Top 25%) achieve nightly rates of $155 or more.
- Typical properties (Median) charge around $68 per night.
- Entry-level properties (Bottom 25%) earn around $34 per night.
Average Daily Rate (ADR) Trend by Month in Jardim Botânico
Get Live Jardim Botânico Market Intelligence 👇

Explore Real-time Analytics
Airbnb Seasonality Analysis & Trends in Jardim Botânico (2026)
Peak Season (March, July, January)
- Revenue averages $1,659 per month
- Occupancy rates average 43.8%
- Daily rates average $105
Shoulder Season
- Revenue averages $1,417 per month
- Occupancy maintains around 42.1%
- Daily rates hold near $107
Low Season (February, June, September)
- Revenue drops to average $1,226 per month
- Occupancy decreases to average 41.4%
- Daily rates adjust to average $101
Seasonality Insights for Jardim Botânico
- The Airbnb seasonality in Jardim Botânico shows moderate seasonality with distinct peak and low periods. While the sections above show seasonal averages, it's also insightful to look at the extremes:
- During the high season, the absolute peak month showcases Jardim Botânico's highest earning potential, with monthly revenues capable of climbing to $1,683, occupancy reaching a high of 47.6%, and ADRs peaking at $122.
- Conversely, the slowest single month of the year, typically falling within the low season, marks the market's lowest point. In this month, revenue might dip to $1,128, occupancy could drop to 36.4%, and ADRs may adjust down to $90.
- Understanding both the seasonal averages and these monthly peaks and troughs in revenue, occupancy, and ADR is crucial for maximizing your Airbnb profit potential in Jardim Botânico.
Seasonal Strategies for Maximizing Profit
- Peak Season: Maximize revenue through premium pricing and potentially longer minimum stays. Ensure high availability.
- Low Season: Offer competitive pricing, special promotions (e.g., extended stay discounts), and flexible cancellation policies. Target off-season travelers like remote workers or budget-conscious guests.
- Shoulder Seasons: Implement dynamic pricing that balances peak and low rates. Target weekend travelers or specific events. Offer slightly more flexible terms than peak season.
- Regularly analyze your own performance against these Jardim Botânico seasonality benchmarks and adjust your pricing and availability strategy accordingly.
Best Areas for Airbnb Investment in Jardim Botânico (2026)
Exploring the top neighborhoods for short-term rentals in Jardim Botânico? This section highlights key areas, outlining why they are attractive for hosts and guests, along with notable local attractions. Consider these locations based on your target guest profile and investment strategy.
| Neighborhood / Area | Why Host Here? (Target Guests & Appeal) | Key Attractions & Landmarks |
|---|---|---|
| Lagoa | Charming neighborhood known for its natural beauty, proximity to parks, and iconic lake views. Ideal for families and nature lovers who frequent the area for its outdoor activities and relaxation. | Jardim Botânico de Brasília, Parque da Cidade, Lago Paranoá, Museu Nacional, Catedral Metropolitana, Ponte JK |
| Asa Sul | A vibrant area that combines culture and modernity with cafes, restaurants, and shopping. This neighborhood is favored by both locals and tourists for its central location and lively atmosphere. | Feira da Torre de TV, Parque da Cidade, Shoppings (P norte e sul), Teatro Nacional, Museu Nacional, Igreja de Santa Teresa |
| Çruzeiro | A well-established residential area with a mix of commercial facilities and access to green spaces. Loved by those looking for a quieter yet central location. | Parque da Cidade, Centro Cultural Banco do Brasil, Estádio Mané Garrincha, Restaurantes e bares locais |
| Sudoeste | Known for its architecture and wide streets, Sudoeste is an upscale neighborhood favorable for families and business travelers with its boutique hotels and amenities. | Praça do Cruzeiro, Parque Nacional de Brasília, Cine Brasília, Mercado Local Sudoeste |
| Núcleo Bandeirante | A bustling neighborhood close to the main highways and government buildings, popular among government officials and business travelers. | Esplanada dos Ministérios, Parque da Cidade, Palácio da Alvorada |
| Águas Claras | Emerging hot spot with a strong influx of residents and visitors due to its lively atmosphere, shopping centers, and modern infrastructure. | Shopping Águas Claras, Parque Ecológico de Águas Claras, Praça do Relógio |
| Taguatinga | A thriving municipality close to Brasília, known for its shopping, entertainment, and cultural events, making it a good spot for vacation rental investments. | Taguatinga Shopping, Catedral de Taguatinga, Parque Taguatinga |
| Guará | Another residential area that offers affordable options and is well-connected to Brasília’s key locations, popular among budget travelers and locals. | Parque Ecológico do Guará, Feira do Guará, Shopping Guará |
Understanding Airbnb License Requirements & STR Laws in Jardim Botânico (2026)
While Jardim Botânico, Federal District, Brazil currently shows low STR regulations, specific Airbnb license requirements might still exist or change. Always verify the latest short term rental regulations and Airbnb license requirements directly with local government authorities for Jardim Botânico to ensure full compliance before hosting.
(Source: AirROI data, 2026, finding no licensed listings among those analyzed)
Top Performing Airbnb Properties in Jardim Botânico (2026)
Benchmark your potential! Explore examples of top-performing Airbnb properties in Jardim Botânicobased on Trailing Twelve Month (TTM) revenue. Analyze their characteristics, revenue, occupancy rate, and ADR to understand what drives success in this market.
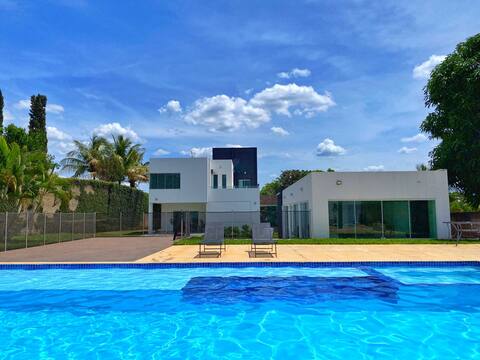
Casa Mayor - Botanical Garden @casamayorbsb
Entire Place • 4 bedrooms
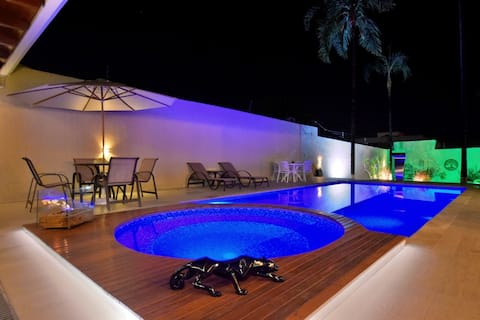
Heated Pool 10 guests Vacation Home in Bsb
Entire Place • 3 bedrooms
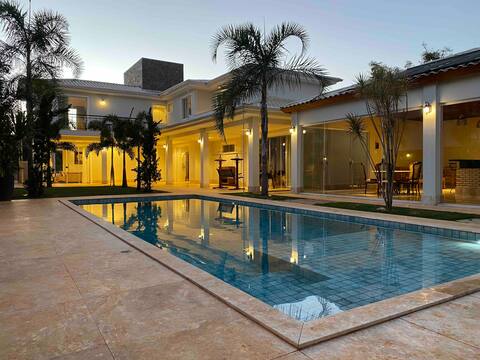
Dream house
Entire Place • 4 bedrooms

Garden House – Forest Retreat with Pool and Hydro.
Entire Place • 3 bedrooms

Next to Lago Sul, 3 km from JK Bridge, Gated Community
Entire Place • 4 bedrooms

Ideal vacation home for families
Entire Place • 4 bedrooms
Note: Performance varies based on location, size, amenities, seasonality, and management quality. Data reflects the past 12 months.
Top Performing Airbnb Hosts in Jardim Botânico (2026)
Learn from the best! This table showcases top-performing Airbnb hosts in Jardim Botânico based on the number of properties managed and estimated total revenue over the past year. Analyze their scale and performance metrics.
| Host Name | Properties | Grossing Revenue | Stay Reviews | Avg Rating |
|---|---|---|---|---|
| Célida | 1 | $73,591 | 50 | 4.96/5.0 |
| Roberval | 1 | $65,270 | 117 | 4.98/5.0 |
| Rafael | 3 | $50,929 | 125 | 4.78/5.0 |
| Ériclis | 1 | $50,200 | 87 | 4.87/5.0 |
| Le Jardin | 2 | $43,750 | 115 | 4.93/5.0 |
| Glauber | 1 | $38,663 | 14 | 5.00/5.0 |
| Cindy | 1 | $37,551 | 8 | 5.00/5.0 |
| Nicole Monteiro | 3 | $34,174 | 173 | 4.92/5.0 |
| Raphaella | 1 | $26,900 | 27 | 4.96/5.0 |
| Michele | 2 | $25,277 | 118 | 4.95/5.0 |
Analyzing the strategies of top hosts, such as their property selection, pricing, and guest communication, can offer valuable lessons for optimizing your own Airbnb operations in Jardim Botânico.
Dive Deeper: Advanced Jardim Botânico STR Market Data (2026)
Ready to unlock more insights? AirROI provides access to advanced metrics and comprehensive Airbnb data for Jardim Botânico. Explore detailed analytics beyond this report to refine your investment strategy, optimize pricing, and maximize your vacation rental profits.
Explore Advanced MetricsJardim Botânico Short-Term Rental Market Composition (2026): Property & Room Types
Room Type Distribution
Property Type Distribution
Market Composition Insights for Jardim Botânico
- The Jardim Botânico Airbnb market composition is heavily skewed towards Entire Home/Apt listings, which make up 82.1% of the 56 active rentals. This indicates strong guest preference for privacy and space.
- Looking at the property type distribution in Jardim Botânico, House properties are the most common (75%), reflecting the local real estate landscape.
- Houses represent a significant 75% portion, catering likely to families or larger groups.
- The presence of 12.5% Hotel/Boutique listings indicates integration with traditional hospitality.
Jardim Botânico Airbnb Room Capacity Analysis (2026): Bedroom Distribution
Distribution of Listings by Number of Bedrooms
Room Capacity Insights for Jardim Botânico
- The dominant room capacity in Jardim Botânico is 3 bedrooms listings, making up 23.2% of the market. This suggests a strong demand for properties suitable for families or small groups.
- Together, 3 bedrooms and 2 bedrooms properties represent 42.8% of the active Airbnb listings in Jardim Botânico, indicating a high concentration in these sizes.
- A significant 49.9% of listings offer 3+ bedrooms, catering to larger groups and families seeking more space in Jardim Botânico.
Jardim Botânico Vacation Rental Guest Capacity Trends (2026)
Distribution of Listings by Guest Capacity
Guest Capacity Insights for Jardim Botânico
- The most common guest capacity trend in Jardim Botânico vacation rentals is listings accommodating 8+ guests (32.1%). This suggests the primary traveler segment is likely larger groups.
- Properties designed for 8+ guests and 6 guests dominate the Jardim Botânico STR market, accounting for 50.0% of listings.
- 58.9% of properties accommodate 6+ guests, serving the market segment for larger families or group travel in Jardim Botânico.
- On average, properties in Jardim Botânico are equipped to host 5.0 guests.
Jardim Botânico Airbnb Booking Patterns (2026): Available vs. Booked Days
Available Days Distribution
Booked Days Distribution
Booking Pattern Insights for Jardim Botânico
- The most common availability pattern in Jardim Botânico falls within the 271-366 days range, representing 48.2% of listings. This suggests many properties have significant open periods on their calendars.
- Approximately 80.3% of listings show high availability (181+ days open annually), indicating potential for increased bookings or specific owner usage patterns.
- For booked days, the 91-180 days range is most frequent in Jardim Botânico (32.1%), reflecting common guest stay durations or potential owner blocking patterns.
- A notable 21.5% of properties secure long booking periods (181+ days booked per year), highlighting successful long-term rental strategies or significant owner usage.
Jardim Botânico Airbnb Minimum Stay Requirements Analysis
Distribution of Listings by Minimum Night Requirement
1 Night
14 listings
25% of total
2 Nights
15 listings
26.8% of total
3 Nights
3 listings
5.4% of total
4-6 Nights
3 listings
5.4% of total
30+ Nights
21 listings
37.5% of total
Key Insights
- The most prevalent minimum stay requirement in Jardim Botânico is 30+ Nights, adopted by 37.5% of listings. This highlights the market's preference for longer commitments.
- A significant segment (37.5%) caters to monthly stays (30+ nights) in Jardim Botânico, pointing to opportunities in the extended-stay market.
Recommendations
- Align with the market by considering a 30+ Nights minimum stay, as 37.5% of Jardim Botânico hosts use this setting.
- If feasible, allowing 1-night stays, especially midweek or during low season, could capture last-minute bookings, as only 25% currently do.
- Explore offering discounts for stays of 30+ nights to attract the 37.5% of the market seeking extended stays.
- Adjust minimum nights based on seasonality – potentially shorter during low season and longer during peak demand periods in Jardim Botânico.
Jardim Botânico Airbnb Cancellation Policy Trends Analysis (2026)
Limited
2 listings
3.6% of total
Flexible
7 listings
12.5% of total
Moderate
13 listings
23.2% of total
Firm
22 listings
39.3% of total
Strict
12 listings
21.4% of total
Cancellation Policy Insights for Jardim Botânico
- The prevailing Airbnb cancellation policy trend in Jardim Botânico is Firm, used by 39.3% of listings.
- A majority (60.7%) of hosts in Jardim Botânico utilize Firm or Strict policies, indicating a market where hosts prioritize booking security.
Recommendations for Hosts
- Consider adopting a Firm policy to align with the 39.3% market standard in Jardim Botânico.
- Regularly review your cancellation policy against competitors and market demand shifts in Jardim Botânico.
Jardim Botânico STR Booking Lead Time Analysis (2026)
Average Booking Lead Time by Month
Booking Lead Time Insights for Jardim Botânico
- The overall average booking lead time for vacation rentals in Jardim Botânico is 29 days.
- Guests book furthest in advance for stays during January (average 49 days), likely coinciding with peak travel demand or local events.
- The shortest booking windows occur for stays in March (average 15 days), indicating more last-minute travel plans during this time.
- Seasonally, Winter (35 days avg.) sees the longest lead times, while Spring (23 days avg.) has the shortest, reflecting typical travel planning cycles.
Recommendations for Hosts
- Use the overall average lead time (29 days) as a baseline for your pricing and availability strategy in Jardim Botânico.
- For January stays, consider implementing length-of-stay discounts or slightly higher rates for bookings made less than 49 days out to capitalize on advance planning.
- Target marketing efforts for the Winter season well in advance (at least 35 days) to capture early planners.
- Monitor your own booking lead times against these Jardim Botânico averages to identify opportunities for dynamic pricing adjustments.
Popular & Essential Airbnb Amenities in Jardim Botânico (2026)
Amenity Prevalence
Amenity Insights for Jardim Botânico
- Essential amenities in Jardim Botânico that guests expect include: Wifi. Lacking these (this) could significantly impact bookings.
- Popular amenities like Kitchen, Free parking on premises, Refrigerator are common but not universal. Offering these can provide a competitive edge.
Recommendations for Hosts
- Ensure your listing includes all essential amenities for Jardim Botânico: Wifi.
- Prioritize adding missing essentials: Wifi.
- Consider adding popular differentiators like Kitchen or Free parking on premises to increase appeal.
- Highlight unique or less common amenities you offer (e.g., hot tub, dedicated workspace, EV charger) in your listing description and photos.
- Regularly check competitor amenities in Jardim Botânico to stay competitive.
Jardim Botânico Airbnb Guest Demographics & Profile Analysis (2026)
Guest Profile Summary for Jardim Botânico
- The typical guest profile for Airbnb in Jardim Botânico consists of primarily domestic travelers (90%), often arriving from nearby São Paulo, typically belonging to the Post-2000s (Gen Z/Alpha) group (50%), primarily speaking Portuguese or English.
- Domestic travelers account for 89.5% of guests.
- Key international markets include Brazil (89.5%) and United States (2.5%).
- Top languages spoken are Portuguese (41.1%) followed by English (30.7%).
- A significant demographic segment is the Post-2000s (Gen Z/Alpha) group, representing 50% of guests.
Recommendations for Hosts
- Target domestic marketing efforts towards travelers from São Paulo and Brasília.
- Tailor amenities and listing descriptions to appeal to the dominant Post-2000s (Gen Z/Alpha) demographic (e.g., highlight fast WiFi, smart home features, local guides).
- Highlight unique local experiences or amenities relevant to the primary guest profile.
- Consider seasonal promotions aligned with peak travel times for key origin markets.
Nearby Short-Term Rental Market Comparison
How does the Jardim Botânico Airbnb market stack up against its neighbors? Compare key performance metrics like average monthly revenue, ADR, and occupancy rates in surrounding areas to understand the broader regional STR landscape.
| Market | Active Properties | Monthly Revenue | Daily Rate | Avg. Occupancy |
|---|---|---|---|---|
| Paranoá | 40 | $1,283 | $123.23 | 40% |
| Pirenópolis | 1,571 | $848 | $122.51 | 28% |
| Alexânia | 119 | $826 | $157.61 | 23% |
| Santa Maria | 15 | $758 | $146.58 | 23% |
| Park Way | 25 | $751 | $91.48 | 28% |
| Ceilândia | 20 | $746 | $92.42 | 42% |
| Planaltina | 19 | $672 | $116.12 | 31% |
| Plano Piloto | 2,448 | $671 | $62.73 | 46% |
| Sobradinho | 80 | $661 | $103.99 | 33% |
| São Sebastião | 51 | $651 | $83.71 | 32% |