Luziânia Airbnb Market Analysis 2026: Short Term Rental Data & Vacation Rental Statistics in Goiás, Brazil
Is Airbnb profitable in Luziânia in 2026? Explore comprehensive Airbnb analytics for Luziânia, Goiás, Brazil to uncover income potential. This 2026 STR market report for Luziânia, based on AirROI data from February 2025 to January 2026, reveals key trends in the niche market of 20 active listings.
Whether you're considering an Airbnb investment in Luziânia, optimizing your existing vacation rental, or exploring rental arbitrage opportunities, understanding the Luziânia Airbnb data is crucial. Leveraging the low regulation environment is key to maximizing your short term rental income potential. Let's dive into the specifics.
Key Luziânia Airbnb Performance Metrics Overview
Monthly Airbnb Revenue Variations & Income Potential in Luziânia (2026)
Understanding the monthly revenue variations for Airbnb listings in Luziânia is key to maximizing your short term rental income potential. Seasonality significantly impacts earnings. Our analysis, based on data from the past 12 months, shows that the peak revenue month for STRs in Luziânia is typically December, while August often presents the lowest earnings, highlighting opportunities for strategic pricing adjustments during shoulder and low seasons. Explore the typical Airbnb income in Luziânia across different performance tiers:
- Best-in-class properties (Top 10%) achieve $2,379+ monthly, often utilizing dynamic pricing and superior guest experiences.
- Strong performing properties (Top 25%) earn $1,326 or more, indicating effective management and desirable locations/amenities.
- Typical properties (Median) generate around $656 per month, representing the average market performance.
- Entry-level properties (Bottom 25%) see earnings around $278, often with potential for optimization.
Average Monthly Airbnb Earnings Trend in Luziânia
Luziânia Airbnb Occupancy Rate Trends (2026)
Maximize your bookings by understanding the Luziânia STR occupancy trends. Seasonal demand shifts significantly influence how often properties are booked. Typically, Decembersees the highest demand (peak season occupancy), while August experiences the lowest (low season). Effective strategies, like adjusting minimum stays or offering promotions, can boost occupancy during slower periods. Here's how different property tiers perform in Luziânia:
- Best-in-class properties (Top 10%) achieve 55%+ occupancy, indicating high desirability and potentially optimized availability.
- Strong performing properties (Top 25%) maintain 37% or higher occupancy, suggesting good market fit and guest satisfaction.
- Typical properties (Median) have an occupancy rate around 19%.
- Entry-level properties (Bottom 25%) average 10% occupancy, potentially facing higher vacancy.
Average Monthly Occupancy Rate Trend in Luziânia
Average Daily Rate (ADR) Airbnb Trends in Luziânia (2026)
Effective short term rental pricing strategy in Luziânia involves understanding monthly ADR fluctuations. The Average Daily Rate (ADR) for Airbnb in Luziânia typically peaks in December and dips lowest during February. Leveraging Airbnb dynamic pricing tools or strategies based on this seasonality can significantly boost revenue. Here's a look at the typical nightly rates achieved:
- Best-in-class properties (Top 10%) command rates of $257+ per night, often due to premium features or locations.
- Strong performing properties (Top 25%) achieve nightly rates of $187 or more.
- Typical properties (Median) charge around $85 per night.
- Entry-level properties (Bottom 25%) earn around $41 per night.
Average Daily Rate (ADR) Trend by Month in Luziânia
Get Live Luziânia Market Intelligence 👇

Explore Real-time Analytics
Airbnb Seasonality Analysis & Trends in Luziânia (2026)
Peak Season (December, January, July)
- Revenue averages $1,513 per month
- Occupancy rates average 30.4%
- Daily rates average $132
Shoulder Season
- Revenue averages $916 per month
- Occupancy maintains around 25.5%
- Daily rates hold near $127
Low Season (February, May, August)
- Revenue drops to average $691 per month
- Occupancy decreases to average 22.7%
- Daily rates adjust to average $124
Seasonality Insights for Luziânia
- The Airbnb seasonality in Luziânia shows highly seasonal trends requiring careful strategy. While the sections above show seasonal averages, it's also insightful to look at the extremes:
- During the high season, the absolute peak month showcases Luziânia's highest earning potential, with monthly revenues capable of climbing to $1,770, occupancy reaching a high of 36.5%, and ADRs peaking at $138.
- Conversely, the slowest single month of the year, typically falling within the low season, marks the market's lowest point. In this month, revenue might dip to $613, occupancy could drop to 19.1%, and ADRs may adjust down to $120.
- Understanding both the seasonal averages and these monthly peaks and troughs in revenue, occupancy, and ADR is crucial for maximizing your Airbnb profit potential in Luziânia.
Seasonal Strategies for Maximizing Profit
- Peak Season: Maximize revenue through premium pricing and potentially longer minimum stays. Ensure high availability.
- Low Season: Offer competitive pricing, special promotions (e.g., extended stay discounts), and flexible cancellation policies. Target off-season travelers like remote workers or budget-conscious guests.
- Shoulder Seasons: Implement dynamic pricing that balances peak and low rates. Target weekend travelers or specific events. Offer slightly more flexible terms than peak season.
- Regularly analyze your own performance against these Luziânia seasonality benchmarks and adjust your pricing and availability strategy accordingly.
Best Areas for Airbnb Investment in Luziânia (2026)
Exploring the top neighborhoods for short-term rentals in Luziânia? This section highlights key areas, outlining why they are attractive for hosts and guests, along with notable local attractions. Consider these locations based on your target guest profile and investment strategy.
| Neighborhood / Area | Why Host Here? (Target Guests & Appeal) | Key Attractions & Landmarks |
|---|---|---|
| Centro | The heart of Luziânia, offering easy access to local shops, restaurants, and cultural attractions. Ideal for tourists looking to experience the local lifestyle and history. | Igreja Matriz de Luziânia, Praça da Igreja Matriz, Museu Histórico de Luziânia, Shopping Luziânia |
| Jardim Luzia | A prominent residential area with a mix of local dining and parks. A good choice for families and travelers seeking a quieter stay with local charm. | Parque da Cidade, Restaurantes locais, Feiras de artesanato |
| São João | Known for its vibrant community and cultural events, making it attractive for visitors who want to immerse themselves in local traditions. | Festa de São João, Mercado Municipal, Eventos culturais locais |
| Setor Central | This area boasts a mix of commerce and leisure, providing travelers with numerous dining and shopping options nearby. | Praça do Riacho, Comércio local, Restaurantes variados |
| Parque Primavera | A residential area with green spaces and parks, appealing for those looking for a peaceful retreat while still being close to urban amenities. | Parque Primavera, Trilhas e áreas verdes, Escolas e centros culturais |
| Vila São Carlos | A growing neighborhood with potential for investment, attracting new residents and businesses, making it ideal for early investment in Airbnb. | Rua das Flores, Comércio emergente, Cafés e padarias locais |
| Jardim Planalto | This area is rapidly developing and is popular among families, offering a suburban feel with easy access to the city center. | Escolas, Praças, Ópticas e perfumarias locais |
| Setor O | A suburban area that offers a blend of local and international dining options, suitable for travelers looking for diverse culinary experiences and accessibility to the main attractions. | Restaurantes variados, Bares locais, Festas e eventos na região |
Understanding Airbnb License Requirements & STR Laws in Luziânia (2026)
While Luziânia, Goiás, Brazil currently shows low STR regulations, specific Airbnb license requirements might still exist or change. Always verify the latest short term rental regulations and Airbnb license requirements directly with local government authorities for Luziânia to ensure full compliance before hosting.
(Source: AirROI data, 2026, based on 5% licensed listings)
Top Performing Airbnb Properties in Luziânia (2026)
Benchmark your potential! Explore examples of top-performing Airbnb properties in Luziâniabased on Trailing Twelve Month (TTM) revenue. Analyze their characteristics, revenue, occupancy rate, and ADR to understand what drives success in this market.
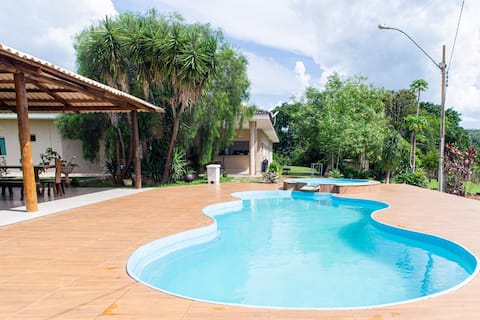
Rancho CB - Casa Caju 100% paved
Entire Place • 6 bedrooms
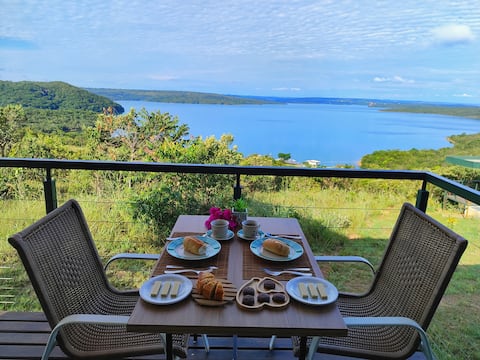
Beautiful Cabin Lake Corumbá 3
Entire Place • 1 bedroom

Recanto Pomaikai Lake Corumbá IV
Entire Place • 1 bedroom

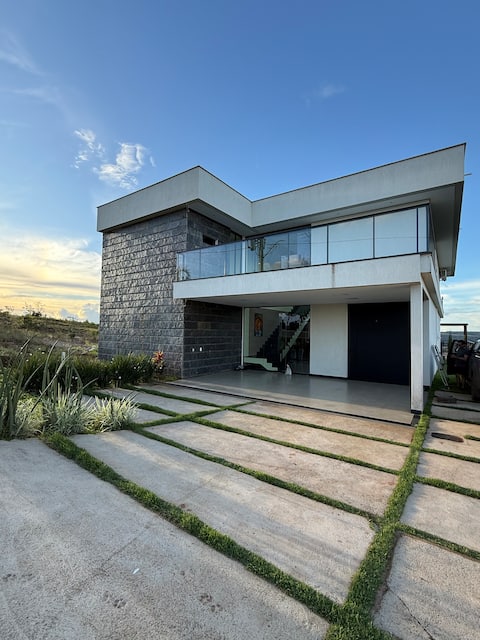
Casa Branca Resort, Paved Access, Lake View
Entire Place • 5 bedrooms
Dona Netinha Farm
Entire Place • 8 bedrooms
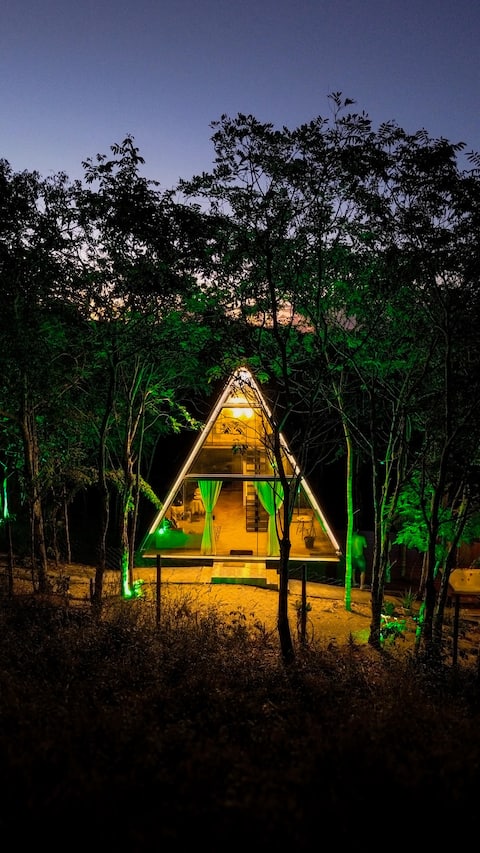
Chalet with spectacular view of Lake Corumbá IV
Entire Place • 1 bedroom
Note: Performance varies based on location, size, amenities, seasonality, and management quality. Data reflects the past 12 months.
Top Performing Airbnb Hosts in Luziânia (2026)
Learn from the best! This table showcases top-performing Airbnb hosts in Luziânia based on the number of properties managed and estimated total revenue over the past year. Analyze their scale and performance metrics.
| Host Name | Properties | Grossing Revenue | Stay Reviews | Avg Rating |
|---|---|---|---|---|
| Bianca | 2 | $41,294 | 19 | 4.86/5.0 |
| Guilherme E Elidaiane | 1 | $19,883 | 121 | 4.92/5.0 |
| Daniela | 1 | $14,389 | 47 | 4.89/5.0 |
| Adriana | 1 | $14,105 | 33 | 4.76/5.0 |
| Enseada Do Lago | 2 | $12,648 | 98 | 4.96/5.0 |
| Thiago | 1 | $8,637 | 14 | 4.50/5.0 |
| Lucas | 1 | $6,514 | 1 | Not Rated |
| Daniel | 2 | $5,908 | 14 | 4.67/5.0 |
| Lorena Fonseca De Medeiros | 1 | $5,822 | 39 | 4.87/5.0 |
| Fatima Mendonca | 1 | $3,510 | 1 | Not Rated |
Analyzing the strategies of top hosts, such as their property selection, pricing, and guest communication, can offer valuable lessons for optimizing your own Airbnb operations in Luziânia.
Dive Deeper: Advanced Luziânia STR Market Data (2026)
Ready to unlock more insights? AirROI provides access to advanced metrics and comprehensive Airbnb data for Luziânia. Explore detailed analytics beyond this report to refine your investment strategy, optimize pricing, and maximize your vacation rental profits.
Explore Advanced MetricsLuziânia Short-Term Rental Market Composition (2026): Property & Room Types
Room Type Distribution
Property Type Distribution
Market Composition Insights for Luziânia
- The Luziânia Airbnb market composition is heavily skewed towards Entire Home/Apt listings, which make up 95% of the 20 active rentals. This indicates strong guest preference for privacy and space.
- Looking at the property type distribution in Luziânia, House properties are the most common (55%), reflecting the local real estate landscape.
- Houses represent a significant 55% portion, catering likely to families or larger groups.
Luziânia Airbnb Room Capacity Analysis (2026): Bedroom Distribution
Distribution of Listings by Number of Bedrooms
Room Capacity Insights for Luziânia
- The dominant room capacity in Luziânia is 1 bedroom listings, making up 35% of the market. This suggests a strong demand for properties suitable for couples or solo travelers.
- Together, 1 bedroom and 2 bedrooms properties represent 55.0% of the active Airbnb listings in Luziânia, indicating a high concentration in these sizes.
- A significant 45.0% of listings offer 3+ bedrooms, catering to larger groups and families seeking more space in Luziânia.
Luziânia Vacation Rental Guest Capacity Trends (2026)
Distribution of Listings by Guest Capacity
Guest Capacity Insights for Luziânia
- The most common guest capacity trend in Luziânia vacation rentals is listings accommodating 8+ guests (40%). This suggests the primary traveler segment is likely larger groups.
- Properties designed for 8+ guests and 2 guests dominate the Luziânia STR market, accounting for 65.0% of listings.
- 55.0% of properties accommodate 6+ guests, serving the market segment for larger families or group travel in Luziânia.
- On average, properties in Luziânia are equipped to host 5.4 guests.
Luziânia Airbnb Booking Patterns (2026): Available vs. Booked Days
Available Days Distribution
Booked Days Distribution
Booking Pattern Insights for Luziânia
- The most common availability pattern in Luziânia falls within the 271-366 days range, representing 85% of listings. This suggests many properties have significant open periods on their calendars.
- Approximately 95.0% of listings show high availability (181+ days open annually), indicating potential for increased bookings or specific owner usage patterns.
- For booked days, the 1-30 days range is most frequent in Luziânia (45%), reflecting common guest stay durations or potential owner blocking patterns.
- A notable 5.0% of properties secure long booking periods (181+ days booked per year), highlighting successful long-term rental strategies or significant owner usage.
Luziânia Airbnb Minimum Stay Requirements Analysis
Distribution of Listings by Minimum Night Requirement
1 Night
9 listings
45% of total
2 Nights
5 listings
25% of total
30+ Nights
6 listings
30% of total
Key Insights
- The most prevalent minimum stay requirement in Luziânia is 1 Night, adopted by 45% of listings. This highlights the market's preference for shorter, flexible bookings.
- A strong majority (70.0%) of the Luziânia Airbnb data shows acceptance of very short stays (1-2 nights), indicating a dynamic, high-turnover market.
- A significant segment (30%) caters to monthly stays (30+ nights) in Luziânia, pointing to opportunities in the extended-stay market.
Recommendations
- Align with the market by considering a 1 Night minimum stay, as 45% of Luziânia hosts use this setting.
- Explore offering discounts for stays of 30+ nights to attract the 30% of the market seeking extended stays.
- Adjust minimum nights based on seasonality – potentially shorter during low season and longer during peak demand periods in Luziânia.
Luziânia Airbnb Cancellation Policy Trends Analysis (2026)
Flexible
11 listings
55% of total
Moderate
5 listings
25% of total
Firm
4 listings
20% of total
Cancellation Policy Insights for Luziânia
- The prevailing Airbnb cancellation policy trend in Luziânia is Flexible, used by 55% of listings.
- The market strongly favors guest-friendly terms, with 80.0% of listings offering Flexible or Moderate policies. This suggests guests in Luziânia may expect booking flexibility.
Recommendations for Hosts
- Consider adopting a Flexible policy to align with the 55% market standard in Luziânia.
- Given the high prevalence of Flexible policies (55%), offering this can enhance booking appeal, especially during shoulder seasons.
- Regularly review your cancellation policy against competitors and market demand shifts in Luziânia.
Luziânia STR Booking Lead Time Analysis (2026)
Average Booking Lead Time by Month
Booking Lead Time Insights for Luziânia
- The overall average booking lead time for vacation rentals in Luziânia is 26 days.
- Guests book furthest in advance for stays during July (average 48 days), likely coinciding with peak travel demand or local events.
- The shortest booking windows occur for stays in June (average 16 days), indicating more last-minute travel plans during this time.
- Seasonally, Summer (31 days avg.) sees the longest lead times, while Winter (18 days avg.) has the shortest, reflecting typical travel planning cycles.
Recommendations for Hosts
- Use the overall average lead time (26 days) as a baseline for your pricing and availability strategy in Luziânia.
- For July stays, consider implementing length-of-stay discounts or slightly higher rates for bookings made less than 48 days out to capitalize on advance planning.
- Target marketing efforts for the Summer season well in advance (at least 31 days) to capture early planners.
- Monitor your own booking lead times against these Luziânia averages to identify opportunities for dynamic pricing adjustments.
Popular & Essential Airbnb Amenities in Luziânia (2026)
Amenity Prevalence
Amenity Insights for Luziânia
- Popular amenities like Free parking on premises, Kitchen, Wifi are common but not universal. Offering these can provide a competitive edge.
- Warning: Wifi is not universally provided but is considered essential globally. Ensure reliable Wifi is offered.
Recommendations for Hosts
- Consider adding popular differentiators like Free parking on premises or Kitchen to increase appeal.
- Highlight unique or less common amenities you offer (e.g., hot tub, dedicated workspace, EV charger) in your listing description and photos.
- Regularly check competitor amenities in Luziânia to stay competitive.
Luziânia Airbnb Guest Demographics & Profile Analysis (2026)
Guest Profile Summary for Luziânia
- The typical guest profile for Airbnb in Luziânia consists of primarily domestic travelers (100%), often arriving from nearby Brasília, typically belonging to the Post-2000s (Gen Z/Alpha) group (50%), primarily speaking Portuguese or English.
- Domestic travelers account for 100.0% of guests.
- Top languages spoken are Portuguese (52%) followed by English (28%).
- A significant demographic segment is the Post-2000s (Gen Z/Alpha) group, representing 50% of guests.
Recommendations for Hosts
- Target domestic marketing efforts towards travelers from Brasília and Distrito Federal.
- Tailor amenities and listing descriptions to appeal to the dominant Post-2000s (Gen Z/Alpha) demographic (e.g., highlight fast WiFi, smart home features, local guides).
- Highlight unique local experiences or amenities relevant to the primary guest profile.
- Consider seasonal promotions aligned with peak travel times for key origin markets.
Nearby Short-Term Rental Market Comparison
How does the Luziânia Airbnb market stack up against its neighbors? Compare key performance metrics like average monthly revenue, ADR, and occupancy rates in surrounding areas to understand the broader regional STR landscape.
| Market | Active Properties | Monthly Revenue | Daily Rate | Avg. Occupancy |
|---|---|---|---|---|
| Paranoá | 40 | $1,283 | $123.23 | 40% |
| Jardim Botânico | 56 | $994 | $105.50 | 39% |
| Pirenópolis | 1,571 | $848 | $122.51 | 28% |
| Alexânia | 119 | $826 | $157.61 | 23% |
| Santa Maria | 15 | $758 | $146.58 | 23% |
| Park Way | 25 | $751 | $91.48 | 28% |
| Ceilândia | 20 | $746 | $92.42 | 42% |
| Senador Canedo | 22 | $691 | $139.79 | 25% |
| Planaltina | 19 | $672 | $116.12 | 31% |
| Plano Piloto | 2,448 | $671 | $62.73 | 46% |