Alagoa Airbnb Market Analysis 2026: Short Term Rental Data & Vacation Rental Statistics in Minas Gerais, Brazil
Is Airbnb profitable in Alagoa in 2026? Explore comprehensive Airbnb analytics for Alagoa, Minas Gerais, Brazil to uncover income potential. This 2026 STR market report for Alagoa, based on AirROI data from February 2025 to January 2026, reveals key trends in the niche market of 19 active listings.
Whether you're considering an Airbnb investment in Alagoa, optimizing your existing vacation rental, or exploring rental arbitrage opportunities, understanding the Alagoa Airbnb data is crucial. Leveraging the low regulation environment is key to maximizing your short term rental income potential. Let's dive into the specifics.
Key Alagoa Airbnb Performance Metrics Overview
Monthly Airbnb Revenue Variations & Income Potential in Alagoa (2026)
Understanding the monthly revenue variations for Airbnb listings in Alagoa is key to maximizing your short term rental income potential. Seasonality significantly impacts earnings. Our analysis, based on data from the past 12 months, shows that the peak revenue month for STRs in Alagoa is typically July, while February often presents the lowest earnings, highlighting opportunities for strategic pricing adjustments during shoulder and low seasons. Explore the typical Airbnb income in Alagoa across different performance tiers:
- Best-in-class properties (Top 10%) achieve $1,244+ monthly, often utilizing dynamic pricing and superior guest experiences.
- Strong performing properties (Top 25%) earn $652 or more, indicating effective management and desirable locations/amenities.
- Typical properties (Median) generate around $280 per month, representing the average market performance.
- Entry-level properties (Bottom 25%) see earnings around $143, often with potential for optimization.
Average Monthly Airbnb Earnings Trend in Alagoa
Alagoa Airbnb Occupancy Rate Trends (2026)
Maximize your bookings by understanding the Alagoa STR occupancy trends. Seasonal demand shifts significantly influence how often properties are booked. Typically, Julysees the highest demand (peak season occupancy), while January experiences the lowest (low season). Effective strategies, like adjusting minimum stays or offering promotions, can boost occupancy during slower periods. Here's how different property tiers perform in Alagoa:
- Best-in-class properties (Top 10%) achieve 49%+ occupancy, indicating high desirability and potentially optimized availability.
- Strong performing properties (Top 25%) maintain 36% or higher occupancy, suggesting good market fit and guest satisfaction.
- Typical properties (Median) have an occupancy rate around 21%.
- Entry-level properties (Bottom 25%) average 11% occupancy, potentially facing higher vacancy.
Average Monthly Occupancy Rate Trend in Alagoa
Average Daily Rate (ADR) Airbnb Trends in Alagoa (2026)
Effective short term rental pricing strategy in Alagoa involves understanding monthly ADR fluctuations. The Average Daily Rate (ADR) for Airbnb in Alagoa typically peaks in December and dips lowest during February. Leveraging Airbnb dynamic pricing tools or strategies based on this seasonality can significantly boost revenue. Here's a look at the typical nightly rates achieved:
- Best-in-class properties (Top 10%) command rates of $84+ per night, often due to premium features or locations.
- Strong performing properties (Top 25%) achieve nightly rates of $70 or more.
- Typical properties (Median) charge around $48 per night.
- Entry-level properties (Bottom 25%) earn around $30 per night.
Average Daily Rate (ADR) Trend by Month in Alagoa
Get Live Alagoa Market Intelligence 👇

Explore Real-time Analytics
Airbnb Seasonality Analysis & Trends in Alagoa (2026)
Peak Season (July, May, December)
- Revenue averages $664 per month
- Occupancy rates average 32.1%
- Daily rates average $52
Shoulder Season
- Revenue averages $472 per month
- Occupancy maintains around 25.8%
- Daily rates hold near $50
Low Season (January, February, November)
- Revenue drops to average $344 per month
- Occupancy decreases to average 20.4%
- Daily rates adjust to average $52
Seasonality Insights for Alagoa
- The Airbnb seasonality in Alagoa shows highly seasonal trends requiring careful strategy. While the sections above show seasonal averages, it's also insightful to look at the extremes:
- During the high season, the absolute peak month showcases Alagoa's highest earning potential, with monthly revenues capable of climbing to $832, occupancy reaching a high of 42.5%, and ADRs peaking at $59.
- Conversely, the slowest single month of the year, typically falling within the low season, marks the market's lowest point. In this month, revenue might dip to $304, occupancy could drop to 17.5%, and ADRs may adjust down to $45.
- Understanding both the seasonal averages and these monthly peaks and troughs in revenue, occupancy, and ADR is crucial for maximizing your Airbnb profit potential in Alagoa.
Seasonal Strategies for Maximizing Profit
- Peak Season: Maximize revenue through premium pricing and potentially longer minimum stays. Ensure high availability.
- Low Season: Offer competitive pricing, special promotions (e.g., extended stay discounts), and flexible cancellation policies. Target off-season travelers like remote workers or budget-conscious guests.
- Shoulder Seasons: Implement dynamic pricing that balances peak and low rates. Target weekend travelers or specific events. Offer slightly more flexible terms than peak season.
- Regularly analyze your own performance against these Alagoa seasonality benchmarks and adjust your pricing and availability strategy accordingly.
Best Areas for Airbnb Investment in Alagoa (2026)
Exploring the top neighborhoods for short-term rentals in Alagoa? This section highlights key areas, outlining why they are attractive for hosts and guests, along with notable local attractions. Consider these locations based on your target guest profile and investment strategy.
| Neighborhood / Area | Why Host Here? (Target Guests & Appeal) | Key Attractions & Landmarks |
|---|---|---|
| Centro | The historic center of Alagoa is charming and attracts visitors interested in local culture and heritage. It's a great spot for hosting Airbnb guests looking for a local experience. | Alagoa Museum, Church of Our Lady of Grace, Local artisan shops, Historical architecture, Scenic parks |
| Jardim do São José | A peaceful neighborhood, popular for its green spaces and proximity to local attractions. Perfect for families and those looking for relaxation in nature. | São José Park, Local hiking trails, Family-friendly restaurants, Botanical Gardens |
| Vila Nova | A vibrant neighborhood known for its community spirit and local markets. Great for visitors wanting a more immersive experience in Alagoa's daily life. | Vila Nova Market, Cultural festivals, Cafes and local eateries, Artisan workshops |
| Praia do Sol | A scenic area that offers beautiful views and access to outdoor activities. Ideal for travelers interested in nature and adventure. | Sunset viewpoints, Outdoor sports activities, Nature trails, Picnic spots |
| Bairro Alto | Known for its nightlife and local entertainment options. Attracts younger crowds and visitors looking to enjoy Alagoa's social scene. | Live music venues, Night markets, Bars and lounges, Cultural events |
| Poco Fundo | A tranquil and picturesque area known for its natural beauty. Perfect for those looking to escape the city and enjoy rural tourism. | Natural waterfalls, Hiking trails, Scenic landscapes, Camping areas |
| Caminho da Fé | A pilgrimage route that attracts visitors looking for spiritual experiences and nature. Great for hikers and cultural tourism. | Pilgrimage sites, Cultural heritage landmarks, Scenic vistas, Nature walks |
| Centro Histórico | The historical center of Alagoa offers charm and character, perfect for tourists interested in architecture and local history. | Historic buildings, Local museums, Traditional restaurants, Cultural landmarks |
Understanding Airbnb License Requirements & STR Laws in Alagoa (2026)
While Alagoa, Minas Gerais, Brazil currently shows low STR regulations, specific Airbnb license requirements might still exist or change. Always verify the latest short term rental regulations and Airbnb license requirements directly with local government authorities for Alagoa to ensure full compliance before hosting.
(Source: AirROI data, 2026, finding no licensed listings among those analyzed)
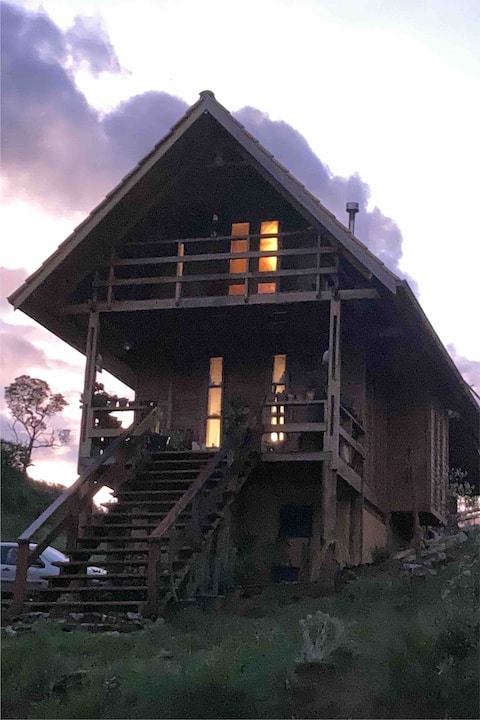
Top Performing Airbnb Properties in Alagoa (2026)
Benchmark your potential! Explore examples of top-performing Airbnb properties in Alagoabased on Trailing Twelve Month (TTM) revenue. Analyze their characteristics, revenue, occupancy rate, and ADR to understand what drives success in this market.
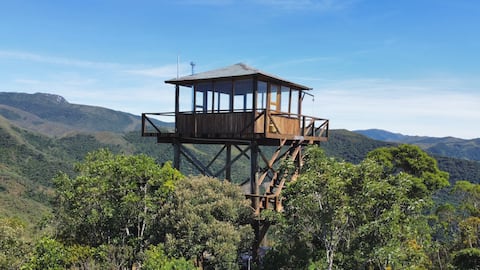
Forest Tower at 1,800m
Entire Place • N/A
Vale dos Lobos - Casa Azul. Peace and waterfalls
Entire Place • 4 bedrooms
Cozy cottage in Alagoa MG with Breakfast
Entire Place • 1 bedroom
Rustic Chalet in the Serra da Mantiqueira
Entire Place • 1 bedroom

Exclusive chalet in Alagoa MG with a view of the Mountain
Entire Place • 1 bedroom
Chalet of the Sky - Pico Pineal
Entire Place • 1 bedroom
Note: Performance varies based on location, size, amenities, seasonality, and management quality. Data reflects the past 12 months.
Top Performing Airbnb Hosts in Alagoa (2026)
Learn from the best! This table showcases top-performing Airbnb hosts in Alagoa based on the number of properties managed and estimated total revenue over the past year. Analyze their scale and performance metrics.
| Host Name | Properties | Grossing Revenue | Stay Reviews | Avg Rating |
|---|---|---|---|---|
| Leonardo | 3 | $21,079 | 83 | 4.97/5.0 |
| Daniel | 1 | $16,683 | 60 | 4.92/5.0 |
| Vera Lobo | 2 | $13,215 | 37 | 4.86/5.0 |
| Leticia | 2 | $4,498 | 57 | 4.95/5.0 |
| Cleide | 2 | $3,268 | 71 | 4.82/5.0 |
| Steven | 1 | $3,138 | 35 | 4.97/5.0 |
| Walkíria | 1 | $3,101 | 28 | 4.93/5.0 |
| Thaylane Siqueira | 1 | $2,898 | 16 | 5.00/5.0 |
| Adriano | 1 | $2,265 | 18 | 4.94/5.0 |
| Jose Mauricio | 1 | $2,256 | 2 | Not Rated |
Analyzing the strategies of top hosts, such as their property selection, pricing, and guest communication, can offer valuable lessons for optimizing your own Airbnb operations in Alagoa.
Dive Deeper: Advanced Alagoa STR Market Data (2026)
Ready to unlock more insights? AirROI provides access to advanced metrics and comprehensive Airbnb data for Alagoa. Explore detailed analytics beyond this report to refine your investment strategy, optimize pricing, and maximize your vacation rental profits.
Explore Advanced MetricsAlagoa Short-Term Rental Market Composition (2026): Property & Room Types
Room Type Distribution
Property Type Distribution
Market Composition Insights for Alagoa
- The Alagoa Airbnb market composition is heavily skewed towards Entire Home/Apt listings, which make up 84.2% of the 19 active rentals. This indicates strong guest preference for privacy and space.
- Looking at the property type distribution in Alagoa, House properties are the most common (84.2%), reflecting the local real estate landscape.
- Houses represent a significant 84.2% portion, catering likely to families or larger groups.
Alagoa Airbnb Room Capacity Analysis (2026): Bedroom Distribution
Distribution of Listings by Number of Bedrooms
Room Capacity Insights for Alagoa
- The dominant room capacity in Alagoa is 1 bedroom listings, making up 42.1% of the market. This suggests a strong demand for properties suitable for couples or solo travelers.
- Together, 1 bedroom and 2 bedrooms properties represent 63.2% of the active Airbnb listings in Alagoa, indicating a high concentration in these sizes.
- A significant 21.1% of listings offer 3+ bedrooms, catering to larger groups and families seeking more space in Alagoa.
Alagoa Vacation Rental Guest Capacity Trends (2026)
Distribution of Listings by Guest Capacity
Guest Capacity Insights for Alagoa
- The most common guest capacity trend in Alagoa vacation rentals is listings accommodating 4 guests (26.3%). This suggests the primary traveler segment is likely small families or groups.
- Properties designed for 4 guests and 2 guests dominate the Alagoa STR market, accounting for 47.4% of listings.
- 21.1% of properties accommodate 6+ guests, serving the market segment for larger families or group travel in Alagoa.
- On average, properties in Alagoa are equipped to host 3.6 guests.
Alagoa Airbnb Booking Patterns (2026): Available vs. Booked Days
Available Days Distribution
Booked Days Distribution
Booking Pattern Insights for Alagoa
- The most common availability pattern in Alagoa falls within the 271-366 days range, representing 73.7% of listings. This suggests many properties have significant open periods on their calendars.
- Approximately 100.0% of listings show high availability (181+ days open annually), indicating potential for increased bookings or specific owner usage patterns.
- For booked days, the 31-90 days range is most frequent in Alagoa (47.4%), reflecting common guest stay durations or potential owner blocking patterns.
Alagoa Airbnb Minimum Stay Requirements Analysis
Distribution of Listings by Minimum Night Requirement
1 Night
9 listings
47.4% of total
2 Nights
8 listings
42.1% of total
3 Nights
1 listings
5.3% of total
30+ Nights
1 listings
5.3% of total
Key Insights
- The most prevalent minimum stay requirement in Alagoa is 1 Night, adopted by 47.4% of listings. This highlights the market's preference for shorter, flexible bookings.
- A strong majority (89.5%) of the Alagoa Airbnb data shows acceptance of very short stays (1-2 nights), indicating a dynamic, high-turnover market.
Recommendations
- Align with the market by considering a 1 Night minimum stay, as 47.4% of Alagoa hosts use this setting.
- Explore offering discounts for stays of 30+ nights to attract the 5.3% of the market seeking extended stays.
- Adjust minimum nights based on seasonality – potentially shorter during low season and longer during peak demand periods in Alagoa.
Alagoa Airbnb Cancellation Policy Trends Analysis (2026)
Limited
2 listings
10.5% of total
Flexible
5 listings
26.3% of total
Moderate
9 listings
47.4% of total
Firm
3 listings
15.8% of total
Cancellation Policy Insights for Alagoa
- The prevailing Airbnb cancellation policy trend in Alagoa is Moderate, used by 47.4% of listings.
- The market strongly favors guest-friendly terms, with 73.7% of listings offering Flexible or Moderate policies. This suggests guests in Alagoa may expect booking flexibility.
Recommendations for Hosts
- Consider adopting a Moderate policy to align with the 47.4% market standard in Alagoa.
- Regularly review your cancellation policy against competitors and market demand shifts in Alagoa.
Alagoa STR Booking Lead Time Analysis (2026)
Average Booking Lead Time by Month
Booking Lead Time Insights for Alagoa
- The overall average booking lead time for vacation rentals in Alagoa is 29 days.
- Guests book furthest in advance for stays during August (average 45 days), likely coinciding with peak travel demand or local events.
- The shortest booking windows occur for stays in September (average 14 days), indicating more last-minute travel plans during this time.
- Seasonally, Summer (37 days avg.) sees the longest lead times, while Fall (17 days avg.) has the shortest, reflecting typical travel planning cycles.
Recommendations for Hosts
- Use the overall average lead time (29 days) as a baseline for your pricing and availability strategy in Alagoa.
- For August stays, consider implementing length-of-stay discounts or slightly higher rates for bookings made less than 45 days out to capitalize on advance planning.
- During September, focus on last-minute booking availability and promotions, as guests book with very short notice (14 days avg.).
- Target marketing efforts for the Summer season well in advance (at least 37 days) to capture early planners.
- Monitor your own booking lead times against these Alagoa averages to identify opportunities for dynamic pricing adjustments.
Popular & Essential Airbnb Amenities in Alagoa (2026)
Amenity Prevalence
Amenity Insights for Alagoa
- Popular amenities like Wifi, Free parking on premises, Hot water are common but not universal. Offering these can provide a competitive edge.
- Warning: Wifi is not universally provided but is considered essential globally. Ensure reliable Wifi is offered.
Recommendations for Hosts
- Consider adding popular differentiators like Wifi or Free parking on premises to increase appeal.
- Highlight unique or less common amenities you offer (e.g., hot tub, dedicated workspace, EV charger) in your listing description and photos.
- Regularly check competitor amenities in Alagoa to stay competitive.
Alagoa Airbnb Guest Demographics & Profile Analysis (2026)
Guest Profile Summary for Alagoa
- The typical guest profile for Airbnb in Alagoa consists of primarily domestic travelers (99%), often arriving from nearby São Paulo, typically belonging to the Post-2000s (Gen Z/Alpha) group (50%), primarily speaking Portuguese or English.
- Domestic travelers account for 98.7% of guests.
- Key international markets include Brazil (98.7%) and Germany (1.3%).
- Top languages spoken are Portuguese (44.6%) followed by English (36.5%).
- A significant demographic segment is the Post-2000s (Gen Z/Alpha) group, representing 50% of guests.
Recommendations for Hosts
- Target domestic marketing efforts towards travelers from São Paulo and Rio de Janeiro.
- Tailor amenities and listing descriptions to appeal to the dominant Post-2000s (Gen Z/Alpha) demographic (e.g., highlight fast WiFi, smart home features, local guides).
- Highlight unique local experiences or amenities relevant to the primary guest profile.
- Consider seasonal promotions aligned with peak travel times for key origin markets.
Nearby Short-Term Rental Market Comparison
How does the Alagoa Airbnb market stack up against its neighbors? Compare key performance metrics like average monthly revenue, ADR, and occupancy rates in surrounding areas to understand the broader regional STR landscape.
| Market | Active Properties | Monthly Revenue | Daily Rate | Avg. Occupancy |
|---|---|---|---|---|
| Ilha Grande | 11 | $1,783 | $166.42 | 38% |
| Areal | 82 | $1,532 | $198.25 | 30% |
| Queluz | 17 | $1,291 | $152.05 | 30% |
| Brazópolis | 21 | $1,209 | $152.11 | 29% |
| Santa Branca | 53 | $1,138 | $195.49 | 25% |
| Jambeiro | 22 | $1,135 | $185.50 | 24% |
| São Sebastião | 6,175 | $1,114 | $188.11 | 28% |
| Rio de Janeiro | 27,660 | $1,085 | $106.45 | 43% |
| Angra dos Reis | 2,446 | $1,017 | $158.25 | 33% |
| Paraisópolis | 104 | $1,004 | $108.16 | 32% |