Araguari Airbnb Market Analysis 2026: Short Term Rental Data & Vacation Rental Statistics in Minas Gerais, Brazil
Is Airbnb profitable in Araguari in 2026? Explore comprehensive Airbnb analytics for Araguari, Minas Gerais, Brazil to uncover income potential. This 2026 STR market report for Araguari, based on AirROI data from February 2025 to January 2026, reveals key trends in the niche market of 25 active listings.
Whether you're considering an Airbnb investment in Araguari, optimizing your existing vacation rental, or exploring rental arbitrage opportunities, understanding the Araguari Airbnb data is crucial. Leveraging the low regulation environment is key to maximizing your short term rental income potential. Let's dive into the specifics.
Key Araguari Airbnb Performance Metrics Overview
Monthly Airbnb Revenue Variations & Income Potential in Araguari (2026)
Understanding the monthly revenue variations for Airbnb listings in Araguari is key to maximizing your short term rental income potential. Seasonality significantly impacts earnings. Our analysis, based on data from the past 12 months, shows that the peak revenue month for STRs in Araguari is typically August, while March often presents the lowest earnings, highlighting opportunities for strategic pricing adjustments during shoulder and low seasons. Explore the typical Airbnb income in Araguari across different performance tiers:
- Best-in-class properties (Top 10%) achieve $746+ monthly, often utilizing dynamic pricing and superior guest experiences.
- Strong performing properties (Top 25%) earn $562 or more, indicating effective management and desirable locations/amenities.
- Typical properties (Median) generate around $367 per month, representing the average market performance.
- Entry-level properties (Bottom 25%) see earnings around $206, often with potential for optimization.
Average Monthly Airbnb Earnings Trend in Araguari
Araguari Airbnb Occupancy Rate Trends (2026)
Maximize your bookings by understanding the Araguari STR occupancy trends. Seasonal demand shifts significantly influence how often properties are booked. Typically, Novembersees the highest demand (peak season occupancy), while October experiences the lowest (low season). Effective strategies, like adjusting minimum stays or offering promotions, can boost occupancy during slower periods. Here's how different property tiers perform in Araguari:
- Best-in-class properties (Top 10%) achieve 79%+ occupancy, indicating high desirability and potentially optimized availability.
- Strong performing properties (Top 25%) maintain 61% or higher occupancy, suggesting good market fit and guest satisfaction.
- Typical properties (Median) have an occupancy rate around 41%.
- Entry-level properties (Bottom 25%) average 25% occupancy, potentially facing higher vacancy.
Average Monthly Occupancy Rate Trend in Araguari
Average Daily Rate (ADR) Airbnb Trends in Araguari (2026)
Effective short term rental pricing strategy in Araguari involves understanding monthly ADR fluctuations. The Average Daily Rate (ADR) for Airbnb in Araguari typically peaks in October and dips lowest during February. Leveraging Airbnb dynamic pricing tools or strategies based on this seasonality can significantly boost revenue. Here's a look at the typical nightly rates achieved:
- Best-in-class properties (Top 10%) command rates of $38+ per night, often due to premium features or locations.
- Strong performing properties (Top 25%) achieve nightly rates of $34 or more.
- Typical properties (Median) charge around $25 per night.
- Entry-level properties (Bottom 25%) earn around $17 per night.
Average Daily Rate (ADR) Trend by Month in Araguari
Get Live Araguari Market Intelligence 👇

Explore Real-time Analytics
Airbnb Seasonality Analysis & Trends in Araguari (2026)
Peak Season (August, July, December)
- Revenue averages $508 per month
- Occupancy rates average 47.5%
- Daily rates average $28
Shoulder Season
- Revenue averages $393 per month
- Occupancy maintains around 44.9%
- Daily rates hold near $27
Low Season (February, March, October)
- Revenue drops to average $298 per month
- Occupancy decreases to average 39.6%
- Daily rates adjust to average $26
Seasonality Insights for Araguari
- The Airbnb seasonality in Araguari shows highly seasonal trends requiring careful strategy. While the sections above show seasonal averages, it's also insightful to look at the extremes:
- During the high season, the absolute peak month showcases Araguari's highest earning potential, with monthly revenues capable of climbing to $579, occupancy reaching a high of 54.3%, and ADRs peaking at $35.
- Conversely, the slowest single month of the year, typically falling within the low season, marks the market's lowest point. In this month, revenue might dip to $284, occupancy could drop to 34.4%, and ADRs may adjust down to $22.
- Understanding both the seasonal averages and these monthly peaks and troughs in revenue, occupancy, and ADR is crucial for maximizing your Airbnb profit potential in Araguari.
Seasonal Strategies for Maximizing Profit
- Peak Season: Maximize revenue through premium pricing and potentially longer minimum stays. Ensure high availability.
- Low Season: Offer competitive pricing, special promotions (e.g., extended stay discounts), and flexible cancellation policies. Target off-season travelers like remote workers or budget-conscious guests.
- Shoulder Seasons: Implement dynamic pricing that balances peak and low rates. Target weekend travelers or specific events. Offer slightly more flexible terms than peak season.
- Regularly analyze your own performance against these Araguari seasonality benchmarks and adjust your pricing and availability strategy accordingly.
Best Areas for Airbnb Investment in Araguari (2026)
Exploring the top neighborhoods for short-term rentals in Araguari? This section highlights key areas, outlining why they are attractive for hosts and guests, along with notable local attractions. Consider these locations based on your target guest profile and investment strategy.
| Neighborhood / Area | Why Host Here? (Target Guests & Appeal) | Key Attractions & Landmarks |
|---|---|---|
| Centro | The historic center of Araguari, filled with cultural landmarks, shops, and restaurants. Ideal for guests wanting to explore local history and cuisine. | Igreja Matriz de São Sebastião, Museu Histórico de Araguari, Praça Pres. Tancredo Neves, Teatro Municipal de Araguari |
| Parque do Jacaré | A popular recreational area in Araguari featuring parks and outdoor activities. Great for families and nature lovers seeking leisure and relaxation. | Parque do Jacaré, Ponte do Jacaré, area for picnics and walking trails |
| Jardim das Oliveiras | A residential neighborhood known for its tranquility and hospitality. Perfect for family stays and longer visits. | Local parks, Friendly community atmosphere, Close access to local markets |
| Alto do São João | An elevated area providing great views of the city. It's a quieter area with a mix of residential and local businesses, embraced by nature. | Viewpoints over the city, Local cafes, Nature trails |
| São Sebastião | A neighborhood with a rich local culture, ideal for travelers interested in community events and local food experiences. | Local restaurants, Cultural events, Markets on weekends |
| Estação | The area surrounding the train station, buzzing with activity and commerce. It offers a unique urban experience for visitors. | Train station heritage, Local shops, Proximity to transportation |
| Santa Maria | A growing area with new developments and conveniences. Ideal for those looking for modern amenities while staying in Araguari. | Shopping centers, New restaurants, Cafes and boutiques |
| Crispim | A quieter suburb with beautiful landscapes, perfect for guests looking for peace and nature while still being close to the city. | Green spaces, Hiking trails, Neighborhood parks |
Understanding Airbnb License Requirements & STR Laws in Araguari (2026)
While Araguari, Minas Gerais, Brazil currently shows low STR regulations, specific Airbnb license requirements might still exist or change. Always verify the latest short term rental regulations and Airbnb license requirements directly with local government authorities for Araguari to ensure full compliance before hosting.
(Source: AirROI data, 2026, finding no licensed listings among those analyzed)
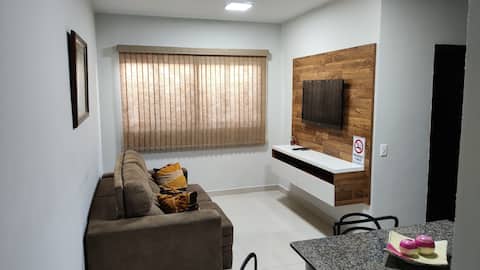
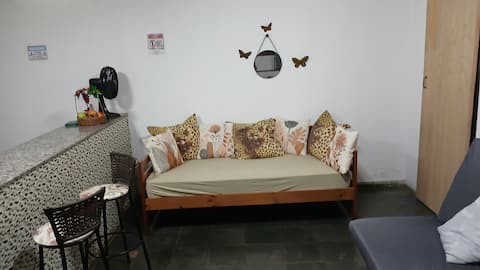
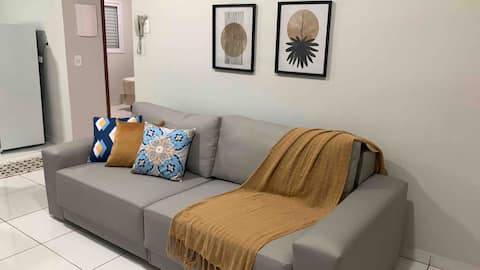
Top Performing Airbnb Properties in Araguari (2026)
Benchmark your potential! Explore examples of top-performing Airbnb properties in Araguaribased on Trailing Twelve Month (TTM) revenue. Analyze their characteristics, revenue, occupancy rate, and ADR to understand what drives success in this market.

Araguari Apartment with Pool
Entire Place • 2 bedrooms

Furnished apartment, comfortable, 5 min. Downtown
Entire Place • 2 bedrooms

Flat/Cozy with air-conditioning
Entire Place • 2 bedrooms
(A)Apt with 2 air-conditioned bedrooms 24H Security
Entire Place • 2 bedrooms
house/kitnet in Araguari
Entire Place • 2 bedrooms
Araguari apartment with pool
Entire Place • 2 bedrooms
Note: Performance varies based on location, size, amenities, seasonality, and management quality. Data reflects the past 12 months.
Top Performing Airbnb Hosts in Araguari (2026)
Learn from the best! This table showcases top-performing Airbnb hosts in Araguari based on the number of properties managed and estimated total revenue over the past year. Analyze their scale and performance metrics.
| Host Name | Properties | Grossing Revenue | Stay Reviews | Avg Rating |
|---|---|---|---|---|
| Teresa | 2 | $11,206 | 123 | 4.93/5.0 |
| Alexandre | 4 | $11,080 | 149 | 4.94/5.0 |
| Marcelo | 4 | $10,021 | 71 | 4.97/5.0 |
| Celso Rondini Carrasco | 2 | $6,169 | 25 | 5.00/5.0 |
| Lazara Patricia | 1 | $5,826 | 15 | 5.00/5.0 |
| Selmo | 1 | $4,852 | 70 | 4.93/5.0 |
| Rubi | 1 | $2,944 | 18 | 4.67/5.0 |
| Gabriel | 1 | $2,143 | 58 | 4.98/5.0 |
| Thais | 1 | $1,444 | 8 | 5.00/5.0 |
| Peter | 3 | $1,018 | 39 | 4.97/5.0 |
Analyzing the strategies of top hosts, such as their property selection, pricing, and guest communication, can offer valuable lessons for optimizing your own Airbnb operations in Araguari.
Dive Deeper: Advanced Araguari STR Market Data (2026)
Ready to unlock more insights? AirROI provides access to advanced metrics and comprehensive Airbnb data for Araguari. Explore detailed analytics beyond this report to refine your investment strategy, optimize pricing, and maximize your vacation rental profits.
Explore Advanced MetricsAraguari Short-Term Rental Market Composition (2026): Property & Room Types
Room Type Distribution
Property Type Distribution
Market Composition Insights for Araguari
- The Araguari Airbnb market composition is heavily skewed towards Entire Home/Apt listings, which make up 76% of the 25 active rentals. This indicates strong guest preference for privacy and space.
- Looking at the property type distribution in Araguari, House properties are the most common (44%), reflecting the local real estate landscape.
- Houses represent a significant 44% portion, catering likely to families or larger groups.
- The presence of 20% Hotel/Boutique listings indicates integration with traditional hospitality.
Araguari Airbnb Room Capacity Analysis (2026): Bedroom Distribution
Distribution of Listings by Number of Bedrooms
Room Capacity Insights for Araguari
- The dominant room capacity in Araguari is 2 bedrooms listings, making up 60% of the market. This suggests a strong demand for properties suitable for couples or solo travelers.
- Together, 2 bedrooms and 1 bedroom properties represent 76.0% of the active Airbnb listings in Araguari, indicating a high concentration in these sizes.
- Listings with 3+ bedrooms (4.0%) represent a smaller niche, potentially indicating an underserved market for larger group accommodations in Araguari.
Araguari Vacation Rental Guest Capacity Trends (2026)
Distribution of Listings by Guest Capacity
Guest Capacity Insights for Araguari
- The most common guest capacity trend in Araguari vacation rentals is listings accommodating 5 guests (36%). This suggests the primary traveler segment is likely larger groups.
- Properties designed for 5 guests and 2 guests dominate the Araguari STR market, accounting for 52.0% of listings.
- On average, properties in Araguari are equipped to host 3.3 guests.
Araguari Airbnb Booking Patterns (2026): Available vs. Booked Days
Available Days Distribution
Booked Days Distribution
Booking Pattern Insights for Araguari
- The most common availability pattern in Araguari falls within the 271-366 days range, representing 68% of listings. This suggests many properties have significant open periods on their calendars.
- Approximately 80.0% of listings show high availability (181+ days open annually), indicating potential for increased bookings or specific owner usage patterns.
- For booked days, the 1-30 days range is most frequent in Araguari (40%), reflecting common guest stay durations or potential owner blocking patterns.
- A notable 20.0% of properties secure long booking periods (181+ days booked per year), highlighting successful long-term rental strategies or significant owner usage.
Araguari Airbnb Minimum Stay Requirements Analysis
Distribution of Listings by Minimum Night Requirement
1 Night
7 listings
28% of total
2 Nights
6 listings
24% of total
4-6 Nights
3 listings
12% of total
30+ Nights
9 listings
36% of total
Key Insights
- The most prevalent minimum stay requirement in Araguari is 30+ Nights, adopted by 36% of listings. This highlights the market's preference for longer commitments.
- A significant segment (36%) caters to monthly stays (30+ nights) in Araguari, pointing to opportunities in the extended-stay market.
Recommendations
- Align with the market by considering a 30+ Nights minimum stay, as 36% of Araguari hosts use this setting.
- If feasible, allowing 1-night stays, especially midweek or during low season, could capture last-minute bookings, as only 28% currently do.
- Explore offering discounts for stays of 30+ nights to attract the 36% of the market seeking extended stays.
- Adjust minimum nights based on seasonality – potentially shorter during low season and longer during peak demand periods in Araguari.
Araguari Airbnb Cancellation Policy Trends Analysis (2026)
Flexible
11 listings
44% of total
Moderate
2 listings
8% of total
Firm
4 listings
16% of total
Strict
8 listings
32% of total
Cancellation Policy Insights for Araguari
- The prevailing Airbnb cancellation policy trend in Araguari is Flexible, used by 44% of listings.
- There's a relatively balanced mix between guest-friendly (52.0%) and stricter (48.0%) policies, offering choices for different guest needs.
Recommendations for Hosts
- Consider adopting a Flexible policy to align with the 44% market standard in Araguari.
- With 32% using Strict terms, this is a viable option in Araguari, particularly for high-value properties or during peak demand periods.
- Regularly review your cancellation policy against competitors and market demand shifts in Araguari.
Araguari STR Booking Lead Time Analysis (2026)
Average Booking Lead Time by Month
Booking Lead Time Insights for Araguari
- The overall average booking lead time for vacation rentals in Araguari is 19 days.
- Guests book furthest in advance for stays during August (average 43 days), likely coinciding with peak travel demand or local events.
- The shortest booking windows occur for stays in October (average 7 days), indicating more last-minute travel plans during this time.
- Seasonally, Fall (28 days avg.) sees the longest lead times, while Spring (13 days avg.) has the shortest, reflecting typical travel planning cycles.
Recommendations for Hosts
- Use the overall average lead time (19 days) as a baseline for your pricing and availability strategy in Araguari.
- For August stays, consider implementing length-of-stay discounts or slightly higher rates for bookings made less than 43 days out to capitalize on advance planning.
- During October, focus on last-minute booking availability and promotions, as guests book with very short notice (7 days avg.).
- Target marketing efforts for the Fall season well in advance (at least 28 days) to capture early planners.
- Monitor your own booking lead times against these Araguari averages to identify opportunities for dynamic pricing adjustments.
Popular & Essential Airbnb Amenities in Araguari (2026)
Amenity Prevalence
Amenity Insights for Araguari
- Essential amenities in Araguari that guests expect include: Wifi. Lacking these (this) could significantly impact bookings.
- Popular amenities like Kitchen, TV, Free parking on premises are common but not universal. Offering these can provide a competitive edge.
Recommendations for Hosts
- Ensure your listing includes all essential amenities for Araguari: Wifi.
- Prioritize adding missing essentials: Wifi.
- Consider adding popular differentiators like Kitchen or TV to increase appeal.
- Highlight unique or less common amenities you offer (e.g., hot tub, dedicated workspace, EV charger) in your listing description and photos.
- Regularly check competitor amenities in Araguari to stay competitive.
Araguari Airbnb Guest Demographics & Profile Analysis (2026)
Guest Profile Summary for Araguari
- The typical guest profile for Airbnb in Araguari consists of primarily domestic travelers (100%), often arriving from nearby São Paulo, typically belonging to the Post-2000s (Gen Z/Alpha) group (50%), primarily speaking Portuguese or English.
- Domestic travelers account for 100.0% of guests.
- Top languages spoken are Portuguese (66.7%) followed by English (15.4%).
- A significant demographic segment is the Post-2000s (Gen Z/Alpha) group, representing 50% of guests.
Recommendations for Hosts
- Target domestic marketing efforts towards travelers from São Paulo and Goiás.
- Tailor amenities and listing descriptions to appeal to the dominant Post-2000s (Gen Z/Alpha) demographic (e.g., highlight fast WiFi, smart home features, local guides).
- Highlight unique local experiences or amenities relevant to the primary guest profile.
- Consider seasonal promotions aligned with peak travel times for key origin markets.
Nearby Short-Term Rental Market Comparison
How does the Araguari Airbnb market stack up against its neighbors? Compare key performance metrics like average monthly revenue, ADR, and occupancy rates in surrounding areas to understand the broader regional STR landscape.
| Market | Active Properties | Monthly Revenue | Daily Rate | Avg. Occupancy |
|---|---|---|---|---|
| Três Ranchos | 11 | $624 | $124.60 | 19% |
| Rio Quente | 395 | $449 | $62.90 | 29% |
| Caldas Novas | 2,732 | $432 | $65.63 | 32% |
| Uberaba | 266 | $300 | $57.71 | 30% |
| Uberlândia | 765 | $267 | $35.81 | 38% |
| Catalão | 16 | $228 | $38.71 | 34% |
| Ituiutaba | 19 | $195 | $31.01 | 35% |