Bueno Brandão Airbnb Market Analysis 2026: Short Term Rental Data & Vacation Rental Statistics in Minas Gerais, Brazil
Is Airbnb profitable in Bueno Brandão in 2026? Explore comprehensive Airbnb analytics for Bueno Brandão, Minas Gerais, Brazil to uncover income potential. This 2026 STR market report for Bueno Brandão, based on AirROI data from February 2025 to January 2026, reveals key trends in the niche market of 112 active listings.
Whether you're considering an Airbnb investment in Bueno Brandão, optimizing your existing vacation rental, or exploring rental arbitrage opportunities, understanding the Bueno Brandão Airbnb data is crucial. Leveraging the low regulation environment is key to maximizing your short term rental income potential. Let's dive into the specifics.
Key Bueno Brandão Airbnb Performance Metrics Overview
Monthly Airbnb Revenue Variations & Income Potential in Bueno Brandão (2026)
Understanding the monthly revenue variations for Airbnb listings in Bueno Brandão is key to maximizing your short term rental income potential. Seasonality significantly impacts earnings. Our analysis, based on data from the past 12 months, shows that the peak revenue month for STRs in Bueno Brandão is typically December, while February often presents the lowest earnings, highlighting opportunities for strategic pricing adjustments during shoulder and low seasons. Explore the typical Airbnb income in Bueno Brandão across different performance tiers:
- Best-in-class properties (Top 10%) achieve $1,812+ monthly, often utilizing dynamic pricing and superior guest experiences.
- Strong performing properties (Top 25%) earn $1,195 or more, indicating effective management and desirable locations/amenities.
- Typical properties (Median) generate around $632 per month, representing the average market performance.
- Entry-level properties (Bottom 25%) see earnings around $280, often with potential for optimization.
Average Monthly Airbnb Earnings Trend in Bueno Brandão
Bueno Brandão Airbnb Occupancy Rate Trends (2026)
Maximize your bookings by understanding the Bueno Brandão STR occupancy trends. Seasonal demand shifts significantly influence how often properties are booked. Typically, Julysees the highest demand (peak season occupancy), while October experiences the lowest (low season). Effective strategies, like adjusting minimum stays or offering promotions, can boost occupancy during slower periods. Here's how different property tiers perform in Bueno Brandão:
- Best-in-class properties (Top 10%) achieve 62%+ occupancy, indicating high desirability and potentially optimized availability.
- Strong performing properties (Top 25%) maintain 44% or higher occupancy, suggesting good market fit and guest satisfaction.
- Typical properties (Median) have an occupancy rate around 29%.
- Entry-level properties (Bottom 25%) average 14% occupancy, potentially facing higher vacancy.
Average Monthly Occupancy Rate Trend in Bueno Brandão
Average Daily Rate (ADR) Airbnb Trends in Bueno Brandão (2026)
Effective short term rental pricing strategy in Bueno Brandão involves understanding monthly ADR fluctuations. The Average Daily Rate (ADR) for Airbnb in Bueno Brandão typically peaks in December and dips lowest during February. Leveraging Airbnb dynamic pricing tools or strategies based on this seasonality can significantly boost revenue. Here's a look at the typical nightly rates achieved:
- Best-in-class properties (Top 10%) command rates of $146+ per night, often due to premium features or locations.
- Strong performing properties (Top 25%) achieve nightly rates of $104 or more.
- Typical properties (Median) charge around $69 per night.
- Entry-level properties (Bottom 25%) earn around $53 per night.
Average Daily Rate (ADR) Trend by Month in Bueno Brandão
Get Live Bueno Brandão Market Intelligence 👇

Explore Real-time Analytics
Airbnb Seasonality Analysis & Trends in Bueno Brandão (2026)
Peak Season (December, July, June)
- Revenue averages $1,059 per month
- Occupancy rates average 35.6%
- Daily rates average $88
Shoulder Season
- Revenue averages $868 per month
- Occupancy maintains around 31.7%
- Daily rates hold near $83
Low Season (February, September, October)
- Revenue drops to average $724 per month
- Occupancy decreases to average 28.7%
- Daily rates adjust to average $83
Seasonality Insights for Bueno Brandão
- The Airbnb seasonality in Bueno Brandão shows moderate seasonality with distinct peak and low periods. While the sections above show seasonal averages, it's also insightful to look at the extremes:
- During the high season, the absolute peak month showcases Bueno Brandão's highest earning potential, with monthly revenues capable of climbing to $1,126, occupancy reaching a high of 38.4%, and ADRs peaking at $95.
- Conversely, the slowest single month of the year, typically falling within the low season, marks the market's lowest point. In this month, revenue might dip to $658, occupancy could drop to 27.7%, and ADRs may adjust down to $77.
- Understanding both the seasonal averages and these monthly peaks and troughs in revenue, occupancy, and ADR is crucial for maximizing your Airbnb profit potential in Bueno Brandão.
Seasonal Strategies for Maximizing Profit
- Peak Season: Maximize revenue through premium pricing and potentially longer minimum stays. Ensure high availability.
- Low Season: Offer competitive pricing, special promotions (e.g., extended stay discounts), and flexible cancellation policies. Target off-season travelers like remote workers or budget-conscious guests.
- Shoulder Seasons: Implement dynamic pricing that balances peak and low rates. Target weekend travelers or specific events. Offer slightly more flexible terms than peak season.
- Regularly analyze your own performance against these Bueno Brandão seasonality benchmarks and adjust your pricing and availability strategy accordingly.
Best Areas for Airbnb Investment in Bueno Brandão (2026)
Exploring the top neighborhoods for short-term rentals in Bueno Brandão? This section highlights key areas, outlining why they are attractive for hosts and guests, along with notable local attractions. Consider these locations based on your target guest profile and investment strategy.
| Neighborhood / Area | Why Host Here? (Target Guests & Appeal) | Key Attractions & Landmarks |
|---|---|---|
| Centro | The central area of Bueno Brandão, filled with charming shops and local cafes. It's the heart of the town, making it easily accessible for guests looking to explore. | Igreja Matriz de Nossa Senhora do Rosário, Praça da Matriz, Mercado Municipal, Cascata do Salto do Leão |
| Cachoeiras | Known for its stunning waterfalls, this area is perfect for nature enthusiasts and families looking to enjoy outdoor activities and beautiful scenery. | Cachoeira da Sereia, Cachoeira do Novembro, Cachoeira do Salto, Trilha do Pico do Selado |
| Serra do Lopo | A mountainous region offering breathtaking views and hiking opportunities. Ideal for travelers who seek tranquility and adventure in nature. | Mirante da Serra do Lopo, Pico do Selado, Trilhas e caminhadas, Vista panorâmica |
| Rural | The rural areas around Bueno Brandão provide a peaceful escape from city life, with opportunities for agro-tourism and experiencing local farming and traditions. | Caminhadas nas Fazendas, Visitas a Produção de Queijo, Observação de Aves, Experiências Culturais Locais |
| Santa Terezinha | A picturesque neighborhood known for its tranquility and lush landscapes, ideal for families and couples looking for a peaceful getaway. | Praça Santa Terezinha, Lagoa da Terezinha, Trilhas Ecológicas, Rios e Lagoas |
| Parque Nacional da Serra da Bocaina | A national park nearby featuring rich biodiversity, perfect for those who enjoy hiking, camping, and observing wildlife. | Trilha do Ouro, Cachoeiras e Poços Naturais, Pontos de Observação de Aves |
| Pousadas e Chalés | This area is known for its many charming lodges and cabins, offering cozy accommodations amidst nature, appealing to couples and families alike. | Pousadas com vista para as montanhas, Chalés com acesso a trilhas, Gastronomia local |
| Cultural Tours | Focus on cultural experiences, including local artisan workshops and traditional food courses. Great for guests looking to immerse themselves in local culture. | Oficinas de Cerâmica, Cursos de Culinária Mineira, Visitas a Ateliês de Artesanato, Festas Tradicionais |
Understanding Airbnb License Requirements & STR Laws in Bueno Brandão (2026)
While Bueno Brandão, Minas Gerais, Brazil currently shows low STR regulations, specific Airbnb license requirements might still exist or change. Always verify the latest short term rental regulations and Airbnb license requirements directly with local government authorities for Bueno Brandão to ensure full compliance before hosting.
(Source: AirROI data, 2026, finding no licensed listings among those analyzed)
Top Performing Airbnb Properties in Bueno Brandão (2026)
Benchmark your potential! Explore examples of top-performing Airbnb properties in Bueno Brandãobased on Trailing Twelve Month (TTM) revenue. Analyze their characteristics, revenue, occupancy rate, and ADR to understand what drives success in this market.

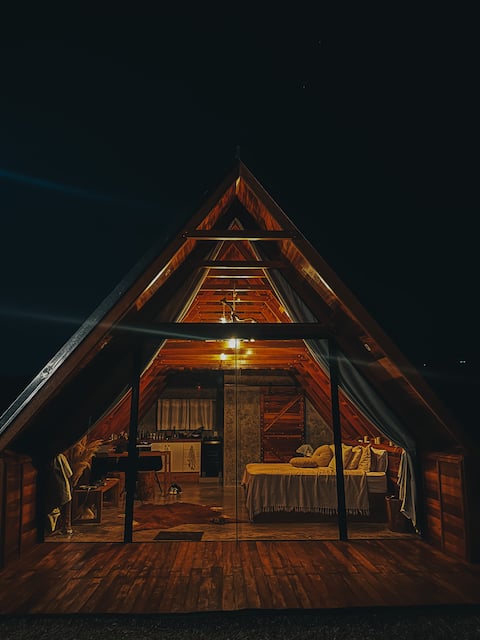
The Cinematic Mountain Beach
Entire Place • 4 bedrooms
Recanto do Berzelai Farmhouse
Entire Place • 8 bedrooms

Casa Kuará: comfort and rest in the South of Minas Gerais
Entire Place • 1 bedroom
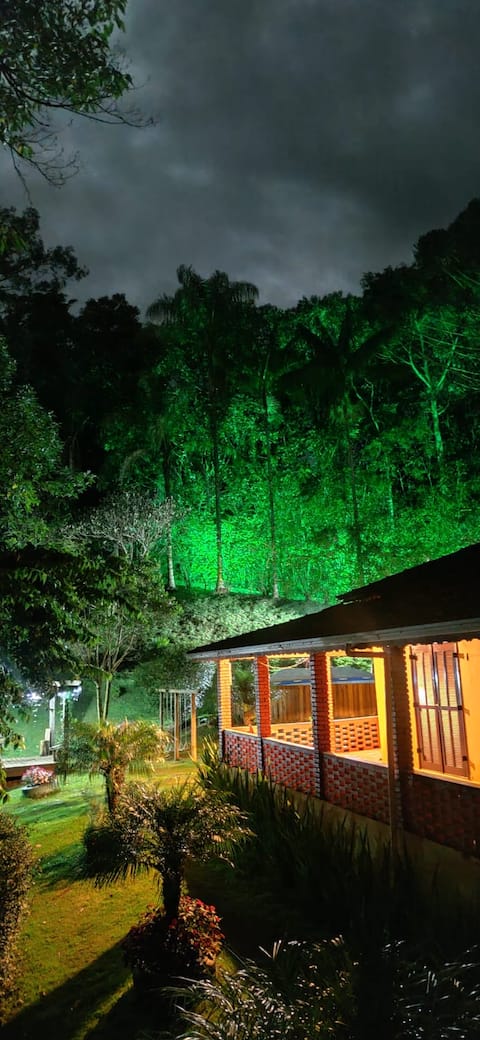
Cabin with incredible view of Mantiqueira Mountain.
Entire Place • 1 bedroom

Country House in the Mountains for the season.
Entire Place • 3 bedrooms
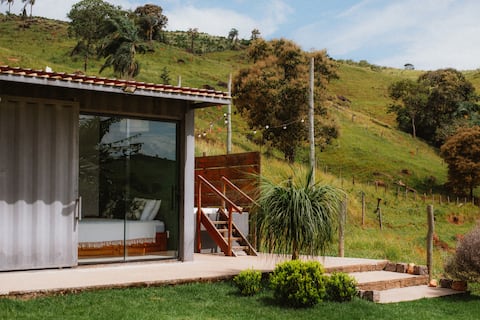
Container House with Spa and beautiful view of the Valley
Entire Place • 2 bedrooms
Note: Performance varies based on location, size, amenities, seasonality, and management quality. Data reflects the past 12 months.
Top Performing Airbnb Hosts in Bueno Brandão (2026)
Learn from the best! This table showcases top-performing Airbnb hosts in Bueno Brandão based on the number of properties managed and estimated total revenue over the past year. Analyze their scale and performance metrics.
| Host Name | Properties | Grossing Revenue | Stay Reviews | Avg Rating |
|---|---|---|---|---|
| Thiago | 4 | $91,426 | 371 | 4.98/5.0 |
| Bento | 4 | $89,479 | 587 | 4.98/5.0 |
| Leandro | 7 | $83,896 | 560 | 4.91/5.0 |
| Icaro | 1 | $79,426 | 31 | 4.97/5.0 |
| Rose Souza Lima | 2 | $37,831 | 205 | 5.00/5.0 |
| Georgia | 4 | $35,687 | 155 | 4.84/5.0 |
| Marcio Costa | 3 | $34,129 | 48 | 4.99/5.0 |
| Marcela | 1 | $32,319 | 14 | 5.00/5.0 |
| Rafael | 3 | $30,873 | 131 | 5.00/5.0 |
| Sarah | 7 | $27,594 | 131 | 4.94/5.0 |
Analyzing the strategies of top hosts, such as their property selection, pricing, and guest communication, can offer valuable lessons for optimizing your own Airbnb operations in Bueno Brandão.
Dive Deeper: Advanced Bueno Brandão STR Market Data (2026)
Ready to unlock more insights? AirROI provides access to advanced metrics and comprehensive Airbnb data for Bueno Brandão. Explore detailed analytics beyond this report to refine your investment strategy, optimize pricing, and maximize your vacation rental profits.
Explore Advanced MetricsBueno Brandão Short-Term Rental Market Composition (2026): Property & Room Types
Room Type Distribution
Property Type Distribution
Market Composition Insights for Bueno Brandão
- The Bueno Brandão Airbnb market composition is heavily skewed towards Entire Home/Apt listings, which make up 71.4% of the 112 active rentals. This indicates strong guest preference for privacy and space.
- Looking at the property type distribution in Bueno Brandão, House properties are the most common (59.8%), reflecting the local real estate landscape.
- Houses represent a significant 59.8% portion, catering likely to families or larger groups.
- The presence of 8% Hotel/Boutique listings indicates integration with traditional hospitality.
- Smaller segments like apartment/condo (combined 0.9%) offer potential for unique stay experiences.
Bueno Brandão Airbnb Room Capacity Analysis (2026): Bedroom Distribution
Distribution of Listings by Number of Bedrooms
Room Capacity Insights for Bueno Brandão
- The dominant room capacity in Bueno Brandão is 1 bedroom listings, making up 44.6% of the market. This suggests a strong demand for properties suitable for couples or solo travelers.
- Together, 1 bedroom and 2 bedrooms properties represent 60.7% of the active Airbnb listings in Bueno Brandão, indicating a high concentration in these sizes.
- A significant 20.6% of listings offer 3+ bedrooms, catering to larger groups and families seeking more space in Bueno Brandão.
Bueno Brandão Vacation Rental Guest Capacity Trends (2026)
Distribution of Listings by Guest Capacity
Guest Capacity Insights for Bueno Brandão
- The most common guest capacity trend in Bueno Brandão vacation rentals is listings accommodating 2 guests (26.8%). This suggests the primary traveler segment is likely couples or solo travelers.
- Properties designed for 2 guests and 8+ guests dominate the Bueno Brandão STR market, accounting for 47.3% of listings.
- 33.0% of properties accommodate 6+ guests, serving the market segment for larger families or group travel in Bueno Brandão.
- On average, properties in Bueno Brandão are equipped to host 3.8 guests.
Bueno Brandão Airbnb Booking Patterns (2026): Available vs. Booked Days
Available Days Distribution
Booked Days Distribution
Booking Pattern Insights for Bueno Brandão
- The most common availability pattern in Bueno Brandão falls within the 271-366 days range, representing 56.3% of listings. This suggests many properties have significant open periods on their calendars.
- Approximately 89.3% of listings show high availability (181+ days open annually), indicating potential for increased bookings or specific owner usage patterns.
- For booked days, the 31-90 days range is most frequent in Bueno Brandão (35.7%), reflecting common guest stay durations or potential owner blocking patterns.
- A notable 11.6% of properties secure long booking periods (181+ days booked per year), highlighting successful long-term rental strategies or significant owner usage.
Bueno Brandão Airbnb Minimum Stay Requirements Analysis
Distribution of Listings by Minimum Night Requirement
1 Night
52 listings
46.4% of total
2 Nights
36 listings
32.1% of total
3 Nights
1 listings
0.9% of total
30+ Nights
23 listings
20.5% of total
Key Insights
- The most prevalent minimum stay requirement in Bueno Brandão is 1 Night, adopted by 46.4% of listings. This highlights the market's preference for shorter, flexible bookings.
- A strong majority (78.5%) of the Bueno Brandão Airbnb data shows acceptance of very short stays (1-2 nights), indicating a dynamic, high-turnover market.
- A significant segment (20.5%) caters to monthly stays (30+ nights) in Bueno Brandão, pointing to opportunities in the extended-stay market.
Recommendations
- Align with the market by considering a 1 Night minimum stay, as 46.4% of Bueno Brandão hosts use this setting.
- Explore offering discounts for stays of 30+ nights to attract the 20.5% of the market seeking extended stays.
- Adjust minimum nights based on seasonality – potentially shorter during low season and longer during peak demand periods in Bueno Brandão.
Bueno Brandão Airbnb Cancellation Policy Trends Analysis (2026)
Limited
4 listings
3.6% of total
Flexible
35 listings
31.3% of total
Moderate
51 listings
45.5% of total
Firm
21 listings
18.8% of total
Strict
1 listings
0.9% of total
Cancellation Policy Insights for Bueno Brandão
- The prevailing Airbnb cancellation policy trend in Bueno Brandão is Moderate, used by 45.5% of listings.
- The market strongly favors guest-friendly terms, with 76.8% of listings offering Flexible or Moderate policies. This suggests guests in Bueno Brandão may expect booking flexibility.
- Strict cancellation policies are quite rare (0.9%), potentially making listings with this policy less competitive unless justified by high demand or property type.
Recommendations for Hosts
- Consider adopting a Moderate policy to align with the 45.5% market standard in Bueno Brandão.
- Using a Strict policy might deter some guests, as only 0.9% of listings use it. Evaluate if potential revenue protection outweighs possible lower booking rates.
- Regularly review your cancellation policy against competitors and market demand shifts in Bueno Brandão.
Bueno Brandão STR Booking Lead Time Analysis (2026)
Average Booking Lead Time by Month
Booking Lead Time Insights for Bueno Brandão
- The overall average booking lead time for vacation rentals in Bueno Brandão is 36 days.
- Guests book furthest in advance for stays during December (average 62 days), likely coinciding with peak travel demand or local events.
- The shortest booking windows occur for stays in May (average 25 days), indicating more last-minute travel plans during this time.
- Seasonally, Winter (45 days avg.) sees the longest lead times, while Spring (30 days avg.) has the shortest, reflecting typical travel planning cycles.
Recommendations for Hosts
- Use the overall average lead time (36 days) as a baseline for your pricing and availability strategy in Bueno Brandão.
- For December stays, consider implementing length-of-stay discounts or slightly higher rates for bookings made less than 62 days out to capitalize on advance planning.
- Target marketing efforts for the Winter season well in advance (at least 45 days) to capture early planners.
- Monitor your own booking lead times against these Bueno Brandão averages to identify opportunities for dynamic pricing adjustments.
Popular & Essential Airbnb Amenities in Bueno Brandão (2026)
Amenity Prevalence
Amenity Insights for Bueno Brandão
- Essential amenities in Bueno Brandão that guests expect include: Wifi. Lacking these (this) could significantly impact bookings.
- Popular amenities like Free parking on premises, TV, Dishes and silverware are common but not universal. Offering these can provide a competitive edge.
Recommendations for Hosts
- Ensure your listing includes all essential amenities for Bueno Brandão: Wifi.
- Prioritize adding missing essentials: Wifi.
- Consider adding popular differentiators like Free parking on premises or TV to increase appeal.
- Highlight unique or less common amenities you offer (e.g., hot tub, dedicated workspace, EV charger) in your listing description and photos.
- Regularly check competitor amenities in Bueno Brandão to stay competitive.
Bueno Brandão Airbnb Guest Demographics & Profile Analysis (2026)
Guest Profile Summary for Bueno Brandão
- The typical guest profile for Airbnb in Bueno Brandão consists of primarily domestic travelers (99%), often arriving from nearby São Paulo, typically belonging to the Post-2000s (Gen Z/Alpha) group (50%), primarily speaking Portuguese or English.
- Domestic travelers account for 99.1% of guests.
- Key international markets include Brazil (99.1%) and United States (0.3%).
- Top languages spoken are Portuguese (49.5%) followed by English (32.1%).
- A significant demographic segment is the Post-2000s (Gen Z/Alpha) group, representing 50% of guests.
Recommendations for Hosts
- Target domestic marketing efforts towards travelers from São Paulo and Campinas.
- Tailor amenities and listing descriptions to appeal to the dominant Post-2000s (Gen Z/Alpha) demographic (e.g., highlight fast WiFi, smart home features, local guides).
- Highlight unique local experiences or amenities relevant to the primary guest profile.
- Consider seasonal promotions aligned with peak travel times for key origin markets.
Nearby Short-Term Rental Market Comparison
How does the Bueno Brandão Airbnb market stack up against its neighbors? Compare key performance metrics like average monthly revenue, ADR, and occupancy rates in surrounding areas to understand the broader regional STR landscape.
| Market | Active Properties | Monthly Revenue | Daily Rate | Avg. Occupancy |
|---|---|---|---|---|
| Riviera de São Lourenço | 10 | $2,868 | $213.78 | 46% |
| Tuiuti | 18 | $1,686 | $156.45 | 30% |
| Itupeva | 136 | $1,561 | $225.82 | 28% |
| Morungaba | 31 | $1,435 | $263.39 | 27% |
| Campo Limpo Paulista | 49 | $1,428 | $181.02 | 30% |
| Valinhos | 61 | $1,370 | $176.28 | 33% |
| Itatiba | 171 | $1,331 | $177.58 | 29% |
| Vargem | 48 | $1,319 | $190.42 | 28% |
| Elias Fausto | 13 | $1,296 | $143.78 | 30% |
| Porto Feliz | 69 | $1,279 | $260.86 | 27% |