Espera Feliz Airbnb Market Analysis 2026: Short Term Rental Data & Vacation Rental Statistics in Minas Gerais, Brazil
Is Airbnb profitable in Espera Feliz in 2026? Explore comprehensive Airbnb analytics for Espera Feliz, Minas Gerais, Brazil to uncover income potential. This 2026 STR market report for Espera Feliz, based on AirROI data from February 2025 to January 2026, reveals key trends in the niche market of 33 active listings.
Whether you're considering an Airbnb investment in Espera Feliz, optimizing your existing vacation rental, or exploring rental arbitrage opportunities, understanding the Espera Feliz Airbnb data is crucial. Leveraging the low regulation environment is key to maximizing your short term rental income potential. Let's dive into the specifics.
Key Espera Feliz Airbnb Performance Metrics Overview
Monthly Airbnb Revenue Variations & Income Potential in Espera Feliz (2026)
Understanding the monthly revenue variations for Airbnb listings in Espera Feliz is key to maximizing your short term rental income potential. Seasonality significantly impacts earnings. Our analysis, based on data from the past 12 months, shows that the peak revenue month for STRs in Espera Feliz is typically July, while January often presents the lowest earnings, highlighting opportunities for strategic pricing adjustments during shoulder and low seasons. Explore the typical Airbnb income in Espera Feliz across different performance tiers:
- Best-in-class properties (Top 10%) achieve $1,878+ monthly, often utilizing dynamic pricing and superior guest experiences.
- Strong performing properties (Top 25%) earn $928 or more, indicating effective management and desirable locations/amenities.
- Typical properties (Median) generate around $455 per month, representing the average market performance.
- Entry-level properties (Bottom 25%) see earnings around $237, often with potential for optimization.
Average Monthly Airbnb Earnings Trend in Espera Feliz
Espera Feliz Airbnb Occupancy Rate Trends (2026)
Maximize your bookings by understanding the Espera Feliz STR occupancy trends. Seasonal demand shifts significantly influence how often properties are booked. Typically, Julysees the highest demand (peak season occupancy), while December experiences the lowest (low season). Effective strategies, like adjusting minimum stays or offering promotions, can boost occupancy during slower periods. Here's how different property tiers perform in Espera Feliz:
- Best-in-class properties (Top 10%) achieve 55%+ occupancy, indicating high desirability and potentially optimized availability.
- Strong performing properties (Top 25%) maintain 31% or higher occupancy, suggesting good market fit and guest satisfaction.
- Typical properties (Median) have an occupancy rate around 16%.
- Entry-level properties (Bottom 25%) average 9% occupancy, potentially facing higher vacancy.
Average Monthly Occupancy Rate Trend in Espera Feliz
Average Daily Rate (ADR) Airbnb Trends in Espera Feliz (2026)
Effective short term rental pricing strategy in Espera Feliz involves understanding monthly ADR fluctuations. The Average Daily Rate (ADR) for Airbnb in Espera Feliz typically peaks in December and dips lowest during February. Leveraging Airbnb dynamic pricing tools or strategies based on this seasonality can significantly boost revenue. Here's a look at the typical nightly rates achieved:
- Best-in-class properties (Top 10%) command rates of $150+ per night, often due to premium features or locations.
- Strong performing properties (Top 25%) achieve nightly rates of $120 or more.
- Typical properties (Median) charge around $80 per night.
- Entry-level properties (Bottom 25%) earn around $62 per night.
Average Daily Rate (ADR) Trend by Month in Espera Feliz
Get Live Espera Feliz Market Intelligence 👇

Explore Real-time Analytics
Airbnb Seasonality Analysis & Trends in Espera Feliz (2026)
Peak Season (July, November, August)
- Revenue averages $980 per month
- Occupancy rates average 30.0%
- Daily rates average $96
Shoulder Season
- Revenue averages $792 per month
- Occupancy maintains around 23.9%
- Daily rates hold near $94
Low Season (January, February, December)
- Revenue drops to average $466 per month
- Occupancy decreases to average 17.7%
- Daily rates adjust to average $97
Seasonality Insights for Espera Feliz
- The Airbnb seasonality in Espera Feliz shows highly seasonal trends requiring careful strategy. While the sections above show seasonal averages, it's also insightful to look at the extremes:
- During the high season, the absolute peak month showcases Espera Feliz's highest earning potential, with monthly revenues capable of climbing to $1,082, occupancy reaching a high of 34.7%, and ADRs peaking at $101.
- Conversely, the slowest single month of the year, typically falling within the low season, marks the market's lowest point. In this month, revenue might dip to $432, occupancy could drop to 16.0%, and ADRs may adjust down to $90.
- Understanding both the seasonal averages and these monthly peaks and troughs in revenue, occupancy, and ADR is crucial for maximizing your Airbnb profit potential in Espera Feliz.
Seasonal Strategies for Maximizing Profit
- Peak Season: Maximize revenue through premium pricing and potentially longer minimum stays. Ensure high availability.
- Low Season: Offer competitive pricing, special promotions (e.g., extended stay discounts), and flexible cancellation policies. Target off-season travelers like remote workers or budget-conscious guests.
- Shoulder Seasons: Implement dynamic pricing that balances peak and low rates. Target weekend travelers or specific events. Offer slightly more flexible terms than peak season.
- Regularly analyze your own performance against these Espera Feliz seasonality benchmarks and adjust your pricing and availability strategy accordingly.
Best Areas for Airbnb Investment in Espera Feliz (2026)
Exploring the top neighborhoods for short-term rentals in Espera Feliz? This section highlights key areas, outlining why they are attractive for hosts and guests, along with notable local attractions. Consider these locations based on your target guest profile and investment strategy.
| Neighborhood / Area | Why Host Here? (Target Guests & Appeal) | Key Attractions & Landmarks |
|---|---|---|
| Centro | The heart of Espera Feliz, offering easy access to local shops, restaurants, and cultural attractions. It’s a vibrant hub for tourists and locals alike, making it an ideal spot for Airbnb hosting. | Igreja Matriz de Espera Feliz, Parque das Águas, Museu Histórico, feiras de artesanato, restaurantes locais |
| Cascatinha | Known for its beautiful waterfalls and natural landscapes, Cascatinha attracts nature lovers and those looking for relaxation. Ideal for eco-tourism and short getaways. | Cachoeira da Cascatinha, trilhas para caminhadas, pontos de observação, passeios de aventura, ambientação rural e tranquila |
| Mirante da Serra | A scenic viewpoint area perfect for those who enjoy breathtaking landscapes and outdoor activities like hiking. Attracts tourists looking for adventure and stunning views. | Mirante da Serra, trilhas ecológicas, esportes radicais, pontos de pesca, paisagens deslumbrantes |
| São Sebastião | A traditional neighborhood that showcases the local culture and lifestyle. Offers a genuine Brazilian experience with local cuisine and hospitality. | Festas tradicionais, gastronomia local, parques comunitários, cultura local, eventos culturais |
| Vale Verde | A tranquil area surrounded by nature, ideal for families and those seeking a peaceful retreat. Great for relaxation and enjoying the outdoors. | Espaço para picnics, áreas verdes, passeios a cavalo, caminhadas na natureza, observação de aves |
| Chácara do Campo | Located in the countryside, this area offers a rustic experience with farms and local produce. Attractive for tourists looking for a rural experience. | Visitas a fazendas, produtos agrícolas locais, passeios de bicicleta, natureza ao redor, calmaria e beleza natural |
| Riacho das Pedras | This area is known for its unique geological formations and natural beauty. It attracts those interested in nature and geology. | Formações rochosas, trilhas, pontos turísticos naturais, fotografia de paisagens, exploração geológica |
| Rio Doce | A scenic area along the river offering activities such as fishing and boating, appealing to adventurous tourists and nature enthusiasts. | Atividades aquáticas, pesca, ciclismo ao longo do rio, passeios de barco, natureza exuberante |
Understanding Airbnb License Requirements & STR Laws in Espera Feliz (2026)
While Espera Feliz, Minas Gerais, Brazil currently shows low STR regulations, specific Airbnb license requirements might still exist or change. Always verify the latest short term rental regulations and Airbnb license requirements directly with local government authorities for Espera Feliz to ensure full compliance before hosting.
(Source: AirROI data, 2026, finding no licensed listings among those analyzed)
Top Performing Airbnb Properties in Espera Feliz (2026)
Benchmark your potential! Explore examples of top-performing Airbnb properties in Espera Felizbased on Trailing Twelve Month (TTM) revenue. Analyze their characteristics, revenue, occupancy rate, and ADR to understand what drives success in this market.

Chácara Citelli
Entire Place • 3 bedrooms

cedar house
Entire Place • 1 bedroom
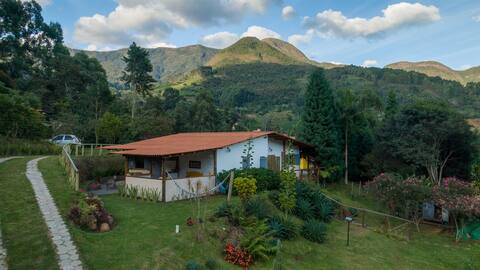
Mountain cabin next to Caparaó National Park
Entire Place • 3 bedrooms

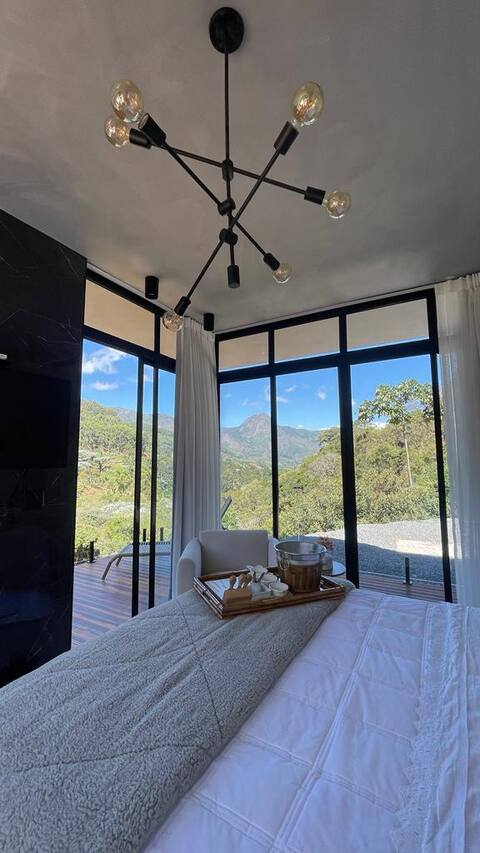
Pedra da Lua Cottage, Forquilha do Rio
Entire Place • 1 bedroom

Seriema Chalet - Waterfall in the Backyard!
Entire Place • 1 bedroom
Forquilha Caparaó | Araucária Cottage | Pedra Menina
Private Room • 1 bedroom
Note: Performance varies based on location, size, amenities, seasonality, and management quality. Data reflects the past 12 months.
Top Performing Airbnb Hosts in Espera Feliz (2026)
Learn from the best! This table showcases top-performing Airbnb hosts in Espera Feliz based on the number of properties managed and estimated total revenue over the past year. Analyze their scale and performance metrics.
| Host Name | Properties | Grossing Revenue | Stay Reviews | Avg Rating |
|---|---|---|---|---|
| Eduardo | 1 | $29,911 | 22 | 5.00/5.0 |
| Thalles | 4 | $28,524 | 37 | 5.00/5.0 |
| Raul | 1 | $23,137 | 65 | 4.95/5.0 |
| Ucha | 3 | $17,871 | 255 | 4.95/5.0 |
| Ligia | 1 | $16,182 | 62 | 4.89/5.0 |
| Pousada Pedra Turmalina | 7 | $11,278 | 48 | 4.94/5.0 |
| Gleidson | 2 | $10,985 | 18 | 5.00/5.0 |
| Gotardo | 1 | $6,814 | 52 | 4.94/5.0 |
| Jair | 1 | $5,870 | 10 | 4.90/5.0 |
| Rhuagas | 1 | $5,718 | 16 | 4.63/5.0 |
Analyzing the strategies of top hosts, such as their property selection, pricing, and guest communication, can offer valuable lessons for optimizing your own Airbnb operations in Espera Feliz.
Dive Deeper: Advanced Espera Feliz STR Market Data (2026)
Ready to unlock more insights? AirROI provides access to advanced metrics and comprehensive Airbnb data for Espera Feliz. Explore detailed analytics beyond this report to refine your investment strategy, optimize pricing, and maximize your vacation rental profits.
Explore Advanced MetricsEspera Feliz Short-Term Rental Market Composition (2026): Property & Room Types
Room Type Distribution
Property Type Distribution
Market Composition Insights for Espera Feliz
- The Espera Feliz Airbnb market composition is heavily skewed towards Entire Home/Apt listings, which make up 75.8% of the 33 active rentals. This indicates strong guest preference for privacy and space.
- Looking at the property type distribution in Espera Feliz, House properties are the most common (45.5%), reflecting the local real estate landscape.
- Houses represent a significant 45.5% portion, catering likely to families or larger groups.
- The presence of 27.3% Hotel/Boutique listings indicates integration with traditional hospitality.
Espera Feliz Airbnb Room Capacity Analysis (2026): Bedroom Distribution
Distribution of Listings by Number of Bedrooms
Room Capacity Insights for Espera Feliz
- The dominant room capacity in Espera Feliz is 1 bedroom listings, making up 57.6% of the market. This suggests a strong demand for properties suitable for couples or solo travelers.
- Together, 1 bedroom and 2 bedrooms properties represent 78.8% of the active Airbnb listings in Espera Feliz, indicating a high concentration in these sizes.
- With over half the market (57.6%) consisting of studios or 1-bedroom units, Espera Feliz is particularly well-suited for individuals or couples.
Espera Feliz Vacation Rental Guest Capacity Trends (2026)
Distribution of Listings by Guest Capacity
Guest Capacity Insights for Espera Feliz
- The most common guest capacity trend in Espera Feliz vacation rentals is listings accommodating 2 guests (36.4%). This suggests the primary traveler segment is likely couples or solo travelers.
- Properties designed for 2 guests and 4 guests dominate the Espera Feliz STR market, accounting for 54.6% of listings.
- 33.4% of properties accommodate 6+ guests, serving the market segment for larger families or group travel in Espera Feliz.
- On average, properties in Espera Feliz are equipped to host 4.4 guests.
Espera Feliz Airbnb Booking Patterns (2026): Available vs. Booked Days
Available Days Distribution
Booked Days Distribution
Booking Pattern Insights for Espera Feliz
- The most common availability pattern in Espera Feliz falls within the 271-366 days range, representing 84.8% of listings. This suggests many properties have significant open periods on their calendars.
- Approximately 93.9% of listings show high availability (181+ days open annually), indicating potential for increased bookings or specific owner usage patterns.
- For booked days, the 31-90 days range is most frequent in Espera Feliz (45.5%), reflecting common guest stay durations or potential owner blocking patterns.
- A notable 6.1% of properties secure long booking periods (181+ days booked per year), highlighting successful long-term rental strategies or significant owner usage.
Espera Feliz Airbnb Minimum Stay Requirements Analysis
Distribution of Listings by Minimum Night Requirement
1 Night
19 listings
57.6% of total
2 Nights
9 listings
27.3% of total
30+ Nights
5 listings
15.2% of total
Key Insights
- The most prevalent minimum stay requirement in Espera Feliz is 1 Night, adopted by 57.6% of listings. This highlights the market's preference for shorter, flexible bookings.
- A strong majority (84.9%) of the Espera Feliz Airbnb data shows acceptance of very short stays (1-2 nights), indicating a dynamic, high-turnover market.
- A significant segment (15.2%) caters to monthly stays (30+ nights) in Espera Feliz, pointing to opportunities in the extended-stay market.
Recommendations
- Align with the market by considering a 1 Night minimum stay, as 57.6% of Espera Feliz hosts use this setting.
- Explore offering discounts for stays of 30+ nights to attract the 15.2% of the market seeking extended stays.
- Adjust minimum nights based on seasonality – potentially shorter during low season and longer during peak demand periods in Espera Feliz.
Espera Feliz Airbnb Cancellation Policy Trends Analysis (2026)
Limited
3 listings
9.1% of total
Flexible
9 listings
27.3% of total
Moderate
5 listings
15.2% of total
Firm
15 listings
45.5% of total
Strict
1 listings
3% of total
Cancellation Policy Insights for Espera Feliz
- The prevailing Airbnb cancellation policy trend in Espera Feliz is Firm, used by 45.5% of listings.
- There's a relatively balanced mix between guest-friendly (42.5%) and stricter (48.5%) policies, offering choices for different guest needs.
- Strict cancellation policies are quite rare (3%), potentially making listings with this policy less competitive unless justified by high demand or property type.
Recommendations for Hosts
- Consider adopting a Firm policy to align with the 45.5% market standard in Espera Feliz.
- Using a Strict policy might deter some guests, as only 3% of listings use it. Evaluate if potential revenue protection outweighs possible lower booking rates.
- Regularly review your cancellation policy against competitors and market demand shifts in Espera Feliz.
Espera Feliz STR Booking Lead Time Analysis (2026)
Average Booking Lead Time by Month
Booking Lead Time Insights for Espera Feliz
- The overall average booking lead time for vacation rentals in Espera Feliz is 32 days.
- Guests book furthest in advance for stays during December (average 67 days), likely coinciding with peak travel demand or local events.
- The shortest booking windows occur for stays in February (average 15 days), indicating more last-minute travel plans during this time.
- Seasonally, Fall (35 days avg.) sees the longest lead times, while Summer (24 days avg.) has the shortest, reflecting typical travel planning cycles.
Recommendations for Hosts
- Use the overall average lead time (32 days) as a baseline for your pricing and availability strategy in Espera Feliz.
- For December stays, consider implementing length-of-stay discounts or slightly higher rates for bookings made less than 67 days out to capitalize on advance planning.
- Target marketing efforts for the Fall season well in advance (at least 35 days) to capture early planners.
- Monitor your own booking lead times against these Espera Feliz averages to identify opportunities for dynamic pricing adjustments.
Popular & Essential Airbnb Amenities in Espera Feliz (2026)
Amenity Prevalence
Amenity Insights for Espera Feliz
- Essential amenities in Espera Feliz that guests expect include: Dishes and silverware, Free parking on premises, Wifi. Lacking these (any) could significantly impact bookings.
- Popular amenities like Kitchen, Backyard, Cooking basics are common but not universal. Offering these can provide a competitive edge.
Recommendations for Hosts
- Ensure your listing includes all essential amenities for Espera Feliz: Dishes and silverware, Free parking on premises, Wifi.
- Prioritize adding missing essentials: Free parking on premises, Wifi.
- Consider adding popular differentiators like Kitchen or Backyard to increase appeal.
- Highlight unique or less common amenities you offer (e.g., hot tub, dedicated workspace, EV charger) in your listing description and photos.
- Regularly check competitor amenities in Espera Feliz to stay competitive.
Espera Feliz Airbnb Guest Demographics & Profile Analysis (2026)
Guest Profile Summary for Espera Feliz
- The typical guest profile for Airbnb in Espera Feliz consists of primarily domestic travelers (93%), often arriving from nearby São Paulo, typically belonging to the Post-2000s (Gen Z/Alpha) group (50%), primarily speaking Portuguese or English.
- Domestic travelers account for 92.6% of guests.
- Key international markets include Brazil (92.6%) and United States (2.9%).
- Top languages spoken are Portuguese (42.6%) followed by English (31.9%).
- A significant demographic segment is the Post-2000s (Gen Z/Alpha) group, representing 50% of guests.
Recommendations for Hosts
- Target domestic marketing efforts towards travelers from São Paulo and Vila Velha.
- Tailor amenities and listing descriptions to appeal to the dominant Post-2000s (Gen Z/Alpha) demographic (e.g., highlight fast WiFi, smart home features, local guides).
- Highlight unique local experiences or amenities relevant to the primary guest profile.
- Consider seasonal promotions aligned with peak travel times for key origin markets.
Nearby Short-Term Rental Market Comparison
How does the Espera Feliz Airbnb market stack up against its neighbors? Compare key performance metrics like average monthly revenue, ADR, and occupancy rates in surrounding areas to understand the broader regional STR landscape.
| Market | Active Properties | Monthly Revenue | Daily Rate | Avg. Occupancy |
|---|---|---|---|---|
| Domingos Martins | 622 | $724 | $114.29 | 27% |
| Santa Teresa | 306 | $708 | $117.81 | 25% |
| Marechal Floriano | 129 | $682 | $110.48 | 26% |
| Venda Nova do Imigrante | 91 | $625 | $114.74 | 22% |
| Castelo | 15 | $587 | $165.25 | 19% |
| Vila Velha | 1,780 | $556 | $62.02 | 40% |
| Anchieta | 392 | $552 | $119.34 | 24% |
| Alfredo Chaves | 59 | $524 | $100.44 | 20% |
| Vitória | 780 | $502 | $48.94 | 44% |
| Vargem Alta | 24 | $490 | $104.97 | 21% |