Formiga Airbnb Market Analysis 2026: Short Term Rental Data & Vacation Rental Statistics in Minas Gerais, Brazil
Is Airbnb profitable in Formiga in 2026? Explore comprehensive Airbnb analytics for Formiga, Minas Gerais, Brazil to uncover income potential. This 2026 STR market report for Formiga, based on AirROI data from November 2024 to October 2025, reveals key trends in the niche market of 17 active listings.
Whether you're considering an Airbnb investment in Formiga, optimizing your existing vacation rental, or exploring rental arbitrage opportunities, understanding the Formiga Airbnb data is crucial. Leveraging the low regulation environment is key to maximizing your short term rental income potential. Let's dive into the specifics.
Key Formiga Airbnb Performance Metrics Overview
Monthly Airbnb Revenue Variations & Income Potential in Formiga (2026)
Understanding the monthly revenue variations for Airbnb listings in Formiga is key to maximizing your short term rental income potential. Seasonality significantly impacts earnings. Our analysis, based on data from the past 12 months, shows that the peak revenue month for STRs in Formiga is typically December, while February often presents the lowest earnings, highlighting opportunities for strategic pricing adjustments during shoulder and low seasons. Explore the typical Airbnb income in Formiga across different performance tiers:
- Best-in-class properties (Top 10%) achieve $773+ monthly, often utilizing dynamic pricing and superior guest experiences.
- Strong performing properties (Top 25%) earn $616 or more, indicating effective management and desirable locations/amenities.
- Typical properties (Median) generate around $334 per month, representing the average market performance.
- Entry-level properties (Bottom 25%) see earnings around $178, often with potential for optimization.
Average Monthly Airbnb Earnings Trend in Formiga
Formiga Airbnb Occupancy Rate Trends (2026)
Maximize your bookings by understanding the Formiga STR occupancy trends. Seasonal demand shifts significantly influence how often properties are booked. Typically, Augustsees the highest demand (peak season occupancy), while January experiences the lowest (low season). Effective strategies, like adjusting minimum stays or offering promotions, can boost occupancy during slower periods. Here's how different property tiers perform in Formiga:
- Best-in-class properties (Top 10%) achieve 76%+ occupancy, indicating high desirability and potentially optimized availability.
- Strong performing properties (Top 25%) maintain 49% or higher occupancy, suggesting good market fit and guest satisfaction.
- Typical properties (Median) have an occupancy rate around 26%.
- Entry-level properties (Bottom 25%) average 11% occupancy, potentially facing higher vacancy.
Average Monthly Occupancy Rate Trend in Formiga
Average Daily Rate (ADR) Airbnb Trends in Formiga (2026)
Effective short term rental pricing strategy in Formiga involves understanding monthly ADR fluctuations. The Average Daily Rate (ADR) for Airbnb in Formiga typically peaks in October and dips lowest during February. Leveraging Airbnb dynamic pricing tools or strategies based on this seasonality can significantly boost revenue. Here's a look at the typical nightly rates achieved:
- Best-in-class properties (Top 10%) command rates of $146+ per night, often due to premium features or locations.
- Strong performing properties (Top 25%) achieve nightly rates of $94 or more.
- Typical properties (Median) charge around $54 per night.
- Entry-level properties (Bottom 25%) earn around $34 per night.
Average Daily Rate (ADR) Trend by Month in Formiga
Get Live Formiga Market Intelligence 👇

Explore Real-time Analytics
Airbnb Seasonality Analysis & Trends in Formiga (2025)
Peak Season (December, August, June)
- Revenue averages $532 per month
- Occupancy rates average 41.0%
- Daily rates average $85
Shoulder Season
- Revenue averages $404 per month
- Occupancy maintains around 32.9%
- Daily rates hold near $79
Low Season (January, February, September)
- Revenue drops to average $317 per month
- Occupancy decreases to average 25.7%
- Daily rates adjust to average $81
Seasonality Insights for Formiga
- The Airbnb seasonality in Formiga shows highly seasonal trends requiring careful strategy. While the sections above show seasonal averages, it's also insightful to look at the extremes:
- During the high season, the absolute peak month showcases Formiga's highest earning potential, with monthly revenues capable of climbing to $592, occupancy reaching a high of 48.9%, and ADRs peaking at $91.
- Conversely, the slowest single month of the year, typically falling within the low season, marks the market's lowest point. In this month, revenue might dip to $291, occupancy could drop to 21.9%, and ADRs may adjust down to $72.
- Understanding both the seasonal averages and these monthly peaks and troughs in revenue, occupancy, and ADR is crucial for maximizing your Airbnb profit potential in Formiga.
Seasonal Strategies for Maximizing Profit
- Peak Season: Maximize revenue through premium pricing and potentially longer minimum stays. Ensure high availability.
- Low Season: Offer competitive pricing, special promotions (e.g., extended stay discounts), and flexible cancellation policies. Target off-season travelers like remote workers or budget-conscious guests.
- Shoulder Seasons: Implement dynamic pricing that balances peak and low rates. Target weekend travelers or specific events. Offer slightly more flexible terms than peak season.
- Regularly analyze your own performance against these Formiga seasonality benchmarks and adjust your pricing and availability strategy accordingly.
Best Areas for Airbnb Investment in Formiga (2026)
Exploring the top neighborhoods for short-term rentals in Formiga? This section highlights key areas, outlining why they are attractive for hosts and guests, along with notable local attractions. Consider these locations based on your target guest profile and investment strategy.
| Neighborhood / Area | Why Host Here? (Target Guests & Appeal) | Key Attractions & Landmarks |
|---|---|---|
| Centro | The historic center of Formiga, with vibrant local markets, shops, and restaurants. It's a hub for community events and a great place to experience the local culture and history. | Igreja Matriz de Nossa Senhora da Conceição, Museu Histórico de Formiga, Mercado Municipal, Praça do Rosário |
| Cascata do Dourado | A stunning natural attraction located just outside Formiga, known for its beautiful waterfalls and tranquil surroundings. Ideal for nature lovers and eco-tourism, making it a popular spot for visitors seeking outdoor adventures. | Cascata do Dourado, Trilhas para caminhadas, Áreas para piqueniques |
| Lagoa da Prata | Close to Formiga, this picturesque lake offers recreational activities such as fishing, boating, and swimming. It's a great spot for families and groups looking to spend a relaxing day outdoors, enhancing Airbnb appeal. | Lagoa da Prata, Praia de Areias Brancas, áreas para churrasco |
| Serra da Canastra | A national park that is a bit of a drive from Formiga, known for its stunning landscapes and wildlife. Great for adventure seekers and those interested in Brazil's natural beauty and biodiversity, attracting tourists who appreciate nature. | Cânion da Fazenda do Capão, Cachoeira Casca D'Anta, Trilhas ecológicas |
| Distrito de Candeias | A charming district known for its rural tourism and bio-diverse landscapes. This area attracts those looking for a tranquil place away from the urban hustle, ideal for Airbnb rentals that offer a unique experience. | Igreja de Candeias, Caminhadas no campo, Cultura rural |
| Praça do Bairro Lagoa | A vibrant local neighborhood with a community-focused atmosphere. It’s ideal for long-term stays or family trips, providing access to local eateries and shops popular among locals. | Parque Municipal, Feiras e eventos locais, Cafés e restaurantes regionais |
| Barragem de Formiga | This reservoir offers scenic views and recreational activities such as fishing and picnicking. It is a favored spot for holidaymakers and families looking for a weekend getaway. | Pesca esportiva, Passeios de barco, Trilhas ao redor da barragem |
| Parque de Exposições de Formiga | A venue for various local events, fairs, and exhibitions. It has the potential to attract visitors during event seasons, making it a strategic location for Airbnb. | Feira Agropecuária, Eventos culturais, Exposições de arte e história |
Understanding Airbnb License Requirements & STR Laws in Formiga (2026)
While Formiga, Minas Gerais, Brazil currently shows low STR regulations, specific Airbnb license requirements might still exist or change. Always verify the latest short term rental regulations and Airbnb license requirements directly with local government authorities for Formiga to ensure full compliance before hosting.
(Source: AirROI data, 2026, finding no licensed listings among those analyzed)
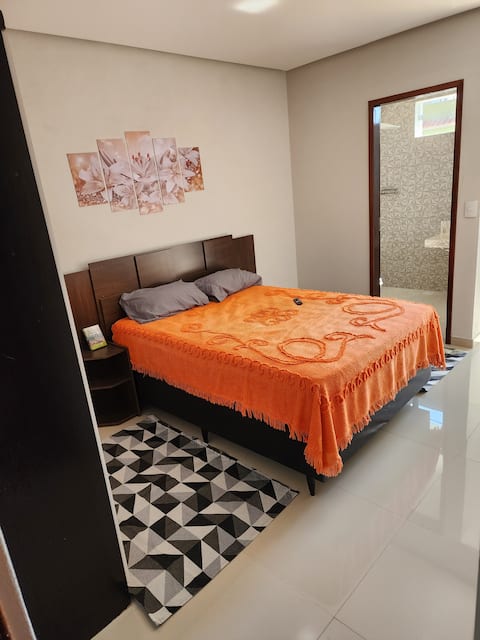
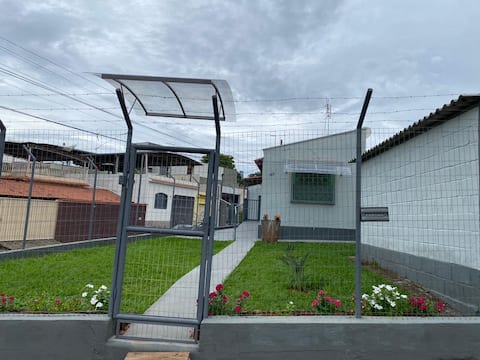
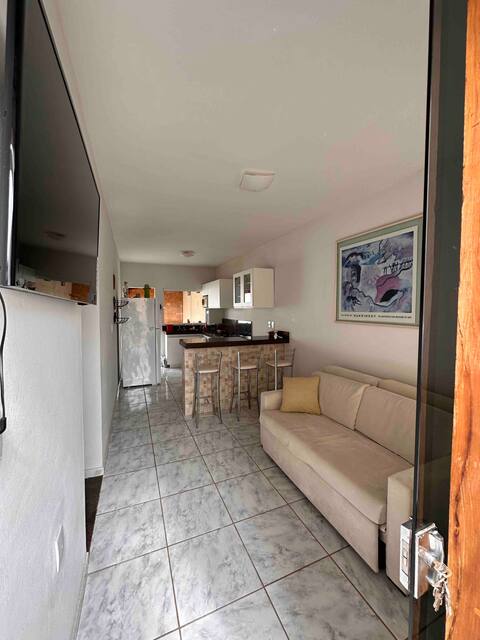
Top Performing Airbnb Properties in Formiga (2026)
Benchmark your potential! Explore examples of top-performing Airbnb properties in Formigabased on Trailing Twelve Month (TTM) revenue. Analyze their characteristics, revenue, occupancy rate, and ADR to understand what drives success in this market.

Spacious 3-bedroom house in the center of Formiga!
Entire Place • 3 bedrooms
Central apartment with garage
Entire Place • 2 bedrooms
Grandma's Little House
Entire Place • 1 bedroom
Friend's Corner
Entire Place • 2 bedrooms
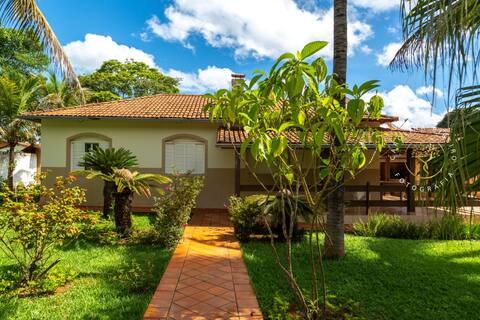
Entire House in Furnas
Entire Place • 3 bedrooms
Rancho Sô Ramus
Entire Place • 3 bedrooms
Note: Performance varies based on location, size, amenities, seasonality, and management quality. Data reflects the past 12 months.
Top Performing Airbnb Hosts in Formiga (2026)
Learn from the best! This table showcases top-performing Airbnb hosts in Formiga based on the number of properties managed and estimated total revenue over the past year. Analyze their scale and performance metrics.
| Host Name | Properties | Grossing Revenue | Stay Reviews | Avg Rating |
|---|---|---|---|---|
| Ana Lucia Rego | 1 | $8,223 | 136 | 4.88/5.0 |
| Evandro | 1 | $5,452 | 52 | 4.96/5.0 |
| Isa | 1 | $5,292 | 16 | 4.88/5.0 |
| Ronan | 1 | $4,199 | 59 | 4.97/5.0 |
| Diego | 1 | $4,047 | 2 | Not Rated |
| David | 1 | $3,696 | 29 | 5.00/5.0 |
| Ronie Adriano Dos | 1 | $3,369 | 2 | Not Rated |
| Stenio P | 1 | $1,794 | 15 | 5.00/5.0 |
| Roseli | 1 | $1,679 | 1 | Not Rated |
| Clayton | 1 | $1,574 | 1 | Not Rated |
Analyzing the strategies of top hosts, such as their property selection, pricing, and guest communication, can offer valuable lessons for optimizing your own Airbnb operations in Formiga.
Dive Deeper: Advanced Formiga STR Market Data (2026)
Ready to unlock more insights? AirROI provides access to advanced metrics and comprehensive Airbnb data for Formiga. Explore detailed analytics beyond this report to refine your investment strategy, optimize pricing, and maximize your vacation rental profits.
Explore Advanced MetricsFormiga Short-Term Rental Market Composition (2026): Property & Room Types
Room Type Distribution
Property Type Distribution
Market Composition Insights for Formiga
- The Formiga Airbnb market composition is heavily skewed towards Entire Home/Apt listings, which make up 94.1% of the 17 active rentals. This indicates strong guest preference for privacy and space.
- Looking at the property type distribution in Formiga, House properties are the most common (64.7%), reflecting the local real estate landscape.
- Houses represent a significant 64.7% portion, catering likely to families or larger groups.
- The presence of 11.8% Hotel/Boutique listings indicates integration with traditional hospitality.
Formiga Airbnb Room Capacity Analysis (2026): Bedroom Distribution
Distribution of Listings by Number of Bedrooms
Room Capacity Insights for Formiga
- The dominant room capacity in Formiga is 3 bedrooms listings, making up 47.1% of the market. This suggests a strong demand for properties suitable for families or small groups.
- Together, 3 bedrooms and 2 bedrooms properties represent 76.5% of the active Airbnb listings in Formiga, indicating a high concentration in these sizes.
- A significant 53.0% of listings offer 3+ bedrooms, catering to larger groups and families seeking more space in Formiga.
Formiga Vacation Rental Guest Capacity Trends (2026)
Distribution of Listings by Guest Capacity
Guest Capacity Insights for Formiga
- The most common guest capacity trend in Formiga vacation rentals is listings accommodating 8+ guests (41.2%). This suggests the primary traveler segment is likely larger groups.
- Properties designed for 8+ guests and 6 guests dominate the Formiga STR market, accounting for 53.0% of listings.
- 58.9% of properties accommodate 6+ guests, serving the market segment for larger families or group travel in Formiga.
- On average, properties in Formiga are equipped to host 5.5 guests.
Formiga Airbnb Booking Patterns (2026): Available vs. Booked Days
Available Days Distribution
Booked Days Distribution
Booking Pattern Insights for Formiga
- The most common availability pattern in Formiga falls within the 271-366 days range, representing 76.5% of listings. This suggests many properties have significant open periods on their calendars.
- Approximately 88.3% of listings show high availability (181+ days open annually), indicating potential for increased bookings or specific owner usage patterns.
- For booked days, the 1-30 days range is most frequent in Formiga (47.1%), reflecting common guest stay durations or potential owner blocking patterns.
- A notable 11.8% of properties secure long booking periods (181+ days booked per year), highlighting successful long-term rental strategies or significant owner usage.
Formiga Airbnb Minimum Stay Requirements Analysis
Distribution of Listings by Minimum Night Requirement
1 Night
5 listings
29.4% of total
2 Nights
6 listings
35.3% of total
3 Nights
2 listings
11.8% of total
30+ Nights
4 listings
23.5% of total
Key Insights
- The most prevalent minimum stay requirement in Formiga is 2 Nights, adopted by 35.3% of listings. This highlights the market's preference for shorter, flexible bookings.
- A strong majority (64.7%) of the Formiga Airbnb data shows acceptance of very short stays (1-2 nights), indicating a dynamic, high-turnover market.
- A significant segment (23.5%) caters to monthly stays (30+ nights) in Formiga, pointing to opportunities in the extended-stay market.
Recommendations
- Align with the market by considering a 2 Nights minimum stay, as 35.3% of Formiga hosts use this setting.
- If feasible, allowing 1-night stays, especially midweek or during low season, could capture last-minute bookings, as only 29.4% currently do.
- Explore offering discounts for stays of 30+ nights to attract the 23.5% of the market seeking extended stays.
- Adjust minimum nights based on seasonality – potentially shorter during low season and longer during peak demand periods in Formiga.
Formiga Airbnb Cancellation Policy Trends Analysis (2026)
Flexible
5 listings
29.4% of total
Moderate
6 listings
35.3% of total
Firm
6 listings
35.3% of total
Cancellation Policy Insights for Formiga
- The prevailing Airbnb cancellation policy trend in Formiga is Moderate, used by 35.3% of listings.
- There's a relatively balanced mix between guest-friendly (64.7%) and stricter (35.3%) policies, offering choices for different guest needs.
Recommendations for Hosts
- Consider adopting a Moderate policy to align with the 35.3% market standard in Formiga.
- Regularly review your cancellation policy against competitors and market demand shifts in Formiga.
Formiga STR Booking Lead Time Analysis (2026)
Average Booking Lead Time by Month
Booking Lead Time Insights for Formiga
- The overall average booking lead time for vacation rentals in Formiga is 25 days.
- Guests book furthest in advance for stays during December (average 48 days), likely coinciding with peak travel demand or local events.
- The shortest booking windows occur for stays in January (average 8 days), indicating more last-minute travel plans during this time.
- Seasonally, Winter (26 days avg.) sees the longest lead times, while Fall (16 days avg.) has the shortest, reflecting typical travel planning cycles.
Recommendations for Hosts
- Use the overall average lead time (25 days) as a baseline for your pricing and availability strategy in Formiga.
- For December stays, consider implementing length-of-stay discounts or slightly higher rates for bookings made less than 48 days out to capitalize on advance planning.
- During January, focus on last-minute booking availability and promotions, as guests book with very short notice (8 days avg.).
- Target marketing efforts for the Winter season well in advance (at least 26 days) to capture early planners.
- Monitor your own booking lead times against these Formiga averages to identify opportunities for dynamic pricing adjustments.
Popular & Essential Airbnb Amenities in Formiga (2026)
Amenity Prevalence
Amenity Insights for Formiga
- Essential amenities in Formiga that guests expect include: Wifi. Lacking these (this) could significantly impact bookings.
- Popular amenities like Kitchen, Free parking on premises, TV are common but not universal. Offering these can provide a competitive edge.
- A pool is a highly desired but not standard amenity, making it a key feature for attracting guests seeking leisure in Formiga.
Recommendations for Hosts
- Ensure your listing includes all essential amenities for Formiga: Wifi.
- Consider adding popular differentiators like Kitchen or Free parking on premises to increase appeal.
- Highlight unique or less common amenities you offer (e.g., hot tub, dedicated workspace, EV charger) in your listing description and photos.
- Regularly check competitor amenities in Formiga to stay competitive.
Formiga Airbnb Guest Demographics & Profile Analysis (2026)
Guest Profile Summary for Formiga
- The typical guest profile for Airbnb in Formiga consists of primarily domestic travelers (94%), often arriving from nearby Belo Horizonte, typically belonging to the Post-2000s (Gen Z/Alpha) group (50%), primarily speaking Portuguese or English.
- Domestic travelers account for 94.3% of guests.
- Key international markets include Brazil (94.3%) and United Kingdom (3.8%).
- Top languages spoken are Portuguese (59.4%) followed by English (28.1%).
- A significant demographic segment is the Post-2000s (Gen Z/Alpha) group, representing 50% of guests.
Recommendations for Hosts
- Target domestic marketing efforts towards travelers from Belo Horizonte and São Paulo.
- Tailor amenities and listing descriptions to appeal to the dominant Post-2000s (Gen Z/Alpha) demographic (e.g., highlight fast WiFi, smart home features, local guides).
- Highlight unique local experiences or amenities relevant to the primary guest profile.
- Consider seasonal promotions aligned with peak travel times for key origin markets.
Nearby Short-Term Rental Market Comparison
How does the Formiga Airbnb market stack up against its neighbors? Compare key performance metrics like average monthly revenue, ADR, and occupancy rates in surrounding areas to understand the broader regional STR landscape.
| Market | Active Properties | Monthly Revenue | Daily Rate | Avg. Occupancy |
|---|---|---|---|---|
| Cássia | 20 | $1,483 | $128.35 | 36% |
| São Joaquim de Bicas | 10 | $1,073 | $138.01 | 29% |
| Mateus Leme | 22 | $1,045 | $157.07 | 28% |
| Ijaci | 18 | $990 | $144.97 | 29% |
| Esmeraldas | 67 | $963 | $159.01 | 27% |
| Ribeirão das Neves | 21 | $915 | $119.34 | 33% |
| Igarapé | 28 | $914 | $138.91 | 30% |
| Caconde | 24 | $875 | $134.84 | 25% |
| Santa Cruz de Minas | 12 | $845 | $74.12 | 32% |
| Juatuba | 20 | $843 | $127.60 | 29% |