Igarapé Airbnb Market Analysis 2026: Short Term Rental Data & Vacation Rental Statistics in Minas Gerais, Brazil
Is Airbnb profitable in Igarapé in 2026? Explore comprehensive Airbnb analytics for Igarapé, Minas Gerais, Brazil to uncover income potential. This 2026 STR market report for Igarapé, based on AirROI data from February 2025 to January 2026, reveals key trends in the niche market of 31 active listings.
Whether you're considering an Airbnb investment in Igarapé, optimizing your existing vacation rental, or exploring rental arbitrage opportunities, understanding the Igarapé Airbnb data is crucial. Leveraging the low regulation environment is key to maximizing your short term rental income potential. Let's dive into the specifics.
Key Igarapé Airbnb Performance Metrics Overview
Monthly Airbnb Revenue Variations & Income Potential in Igarapé (2026)
Understanding the monthly revenue variations for Airbnb listings in Igarapé is key to maximizing your short term rental income potential. Seasonality significantly impacts earnings. Our analysis, based on data from the past 12 months, shows that the peak revenue month for STRs in Igarapé is typically December, while September often presents the lowest earnings, highlighting opportunities for strategic pricing adjustments during shoulder and low seasons. Explore the typical Airbnb income in Igarapé across different performance tiers:
- Best-in-class properties (Top 10%) achieve $2,451+ monthly, often utilizing dynamic pricing and superior guest experiences.
- Strong performing properties (Top 25%) earn $1,651 or more, indicating effective management and desirable locations/amenities.
- Typical properties (Median) generate around $844 per month, representing the average market performance.
- Entry-level properties (Bottom 25%) see earnings around $428, often with potential for optimization.
Average Monthly Airbnb Earnings Trend in Igarapé
Igarapé Airbnb Occupancy Rate Trends (2026)
Maximize your bookings by understanding the Igarapé STR occupancy trends. Seasonal demand shifts significantly influence how often properties are booked. Typically, Marchsees the highest demand (peak season occupancy), while September experiences the lowest (low season). Effective strategies, like adjusting minimum stays or offering promotions, can boost occupancy during slower periods. Here's how different property tiers perform in Igarapé:
- Best-in-class properties (Top 10%) achieve 64%+ occupancy, indicating high desirability and potentially optimized availability.
- Strong performing properties (Top 25%) maintain 44% or higher occupancy, suggesting good market fit and guest satisfaction.
- Typical properties (Median) have an occupancy rate around 24%.
- Entry-level properties (Bottom 25%) average 13% occupancy, potentially facing higher vacancy.
Average Monthly Occupancy Rate Trend in Igarapé
Average Daily Rate (ADR) Airbnb Trends in Igarapé (2026)
Effective short term rental pricing strategy in Igarapé involves understanding monthly ADR fluctuations. The Average Daily Rate (ADR) for Airbnb in Igarapé typically peaks in December and dips lowest during February. Leveraging Airbnb dynamic pricing tools or strategies based on this seasonality can significantly boost revenue. Here's a look at the typical nightly rates achieved:
- Best-in-class properties (Top 10%) command rates of $232+ per night, often due to premium features or locations.
- Strong performing properties (Top 25%) achieve nightly rates of $162 or more.
- Typical properties (Median) charge around $120 per night.
- Entry-level properties (Bottom 25%) earn around $83 per night.
Average Daily Rate (ADR) Trend by Month in Igarapé
Get Live Igarapé Market Intelligence 👇

Explore Real-time Analytics
Airbnb Seasonality Analysis & Trends in Igarapé (2026)
Peak Season (December, March, November)
- Revenue averages $1,382 per month
- Occupancy rates average 35.0%
- Daily rates average $139
Shoulder Season
- Revenue averages $1,091 per month
- Occupancy maintains around 30.6%
- Daily rates hold near $130
Low Season (June, August, September)
- Revenue drops to average $928 per month
- Occupancy decreases to average 26.1%
- Daily rates adjust to average $133
Seasonality Insights for Igarapé
- The Airbnb seasonality in Igarapé shows moderate seasonality with distinct peak and low periods. While the sections above show seasonal averages, it's also insightful to look at the extremes:
- During the high season, the absolute peak month showcases Igarapé's highest earning potential, with monthly revenues capable of climbing to $1,533, occupancy reaching a high of 40.3%, and ADRs peaking at $151.
- Conversely, the slowest single month of the year, typically falling within the low season, marks the market's lowest point. In this month, revenue might dip to $865, occupancy could drop to 21.7%, and ADRs may adjust down to $119.
- Understanding both the seasonal averages and these monthly peaks and troughs in revenue, occupancy, and ADR is crucial for maximizing your Airbnb profit potential in Igarapé.
Seasonal Strategies for Maximizing Profit
- Peak Season: Maximize revenue through premium pricing and potentially longer minimum stays. Ensure high availability.
- Low Season: Offer competitive pricing, special promotions (e.g., extended stay discounts), and flexible cancellation policies. Target off-season travelers like remote workers or budget-conscious guests.
- Shoulder Seasons: Implement dynamic pricing that balances peak and low rates. Target weekend travelers or specific events. Offer slightly more flexible terms than peak season.
- Regularly analyze your own performance against these Igarapé seasonality benchmarks and adjust your pricing and availability strategy accordingly.
Best Areas for Airbnb Investment in Igarapé (2026)
Exploring the top neighborhoods for short-term rentals in Igarapé? This section highlights key areas, outlining why they are attractive for hosts and guests, along with notable local attractions. Consider these locations based on your target guest profile and investment strategy.
| Neighborhood / Area | Why Host Here? (Target Guests & Appeal) | Key Attractions & Landmarks |
|---|---|---|
| Centro de Igarapé | The city center of Igarapé offers a mix of local culture, dining, and shopping opportunities. It's convenient for visitors wanting to explore the local life and attractions. | Igarapé Municipal Park, local craft shops, restaurants, Cultural Center of Igarapé |
| Represa de Igarapé | A beautiful reservoir area perfect for relaxation and outdoor activities. Great for tourists looking for nature and tranquility near the water. | water sports, fishing opportunities, nature trails, picnic areas |
| Praça do Pôr do Sol | A scenic viewpoint that attracts locals and visitors for sunsets and gatherings. It's an ideal spot for hosting guests who enjoy leisure activities. | sunset views, picnic areas, walking paths |
| Bairro São João | A cozy neighborhood with a friendly atmosphere. It's close to several amenities and provides a home-like experience for visitors. | local eateries, parks, grocery stores |
| Vereda Igarapé | A quiet and serene area that draws visitors looking for peace and nature while being close to the city. | nature reserve, walking trails |
| Bairro Nossa Senhora das Graças | A residential area known for its beautiful houses and gardens. Ideal for visitors looking for a more local experience. | local markets, parks, community events |
| Bairro Santa Luzia | Known for its lively community and cultural events. Attractive to visitors who want to experience local life in Igarapé. | cultural festivals, community centers, local food stalls |
| Cachoeira da Fumaça | A stunning waterfall located a short drive from Igarapé, ideal for nature enthusiasts and adventure seekers. Offers a great day-trip experience for guests. | hiking, swimming, picnicking |
Understanding Airbnb License Requirements & STR Laws in Igarapé (2026)
While Igarapé, Minas Gerais, Brazil currently shows low STR regulations, specific Airbnb license requirements might still exist or change. Always verify the latest short term rental regulations and Airbnb license requirements directly with local government authorities for Igarapé to ensure full compliance before hosting.
(Source: AirROI data, 2026, finding no licensed listings among those analyzed)
Top Performing Airbnb Properties in Igarapé (2026)
Benchmark your potential! Explore examples of top-performing Airbnb properties in Igarapébased on Trailing Twelve Month (TTM) revenue. Analyze their characteristics, revenue, occupancy rate, and ADR to understand what drives success in this market.
Loft Igarapé: Comfort integrated with Nature
Entire Place • 1 bedroom
Fazenda Vista da Serra - Parties, Events and Site
Entire Place • 5 bedrooms

Aconchego de Igarapé Ranch - 45 minutes from BH
Entire Place • 6 bedrooms
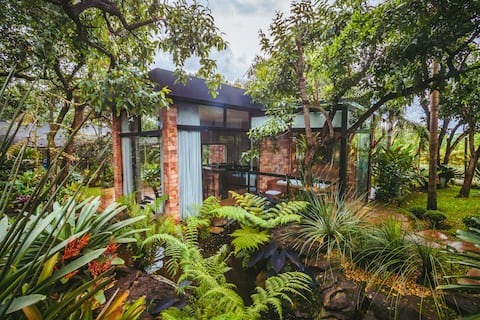
Cozy in nature!
Entire Place • 2 bedrooms
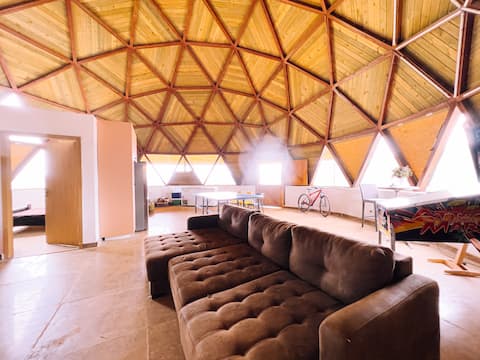
Dome with pool near Inhotim
Entire Place • 1 bedroom
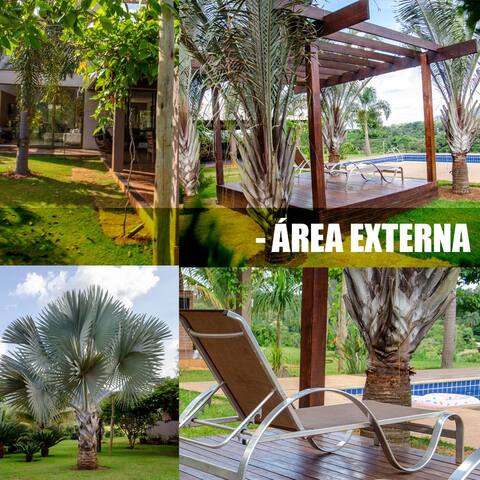
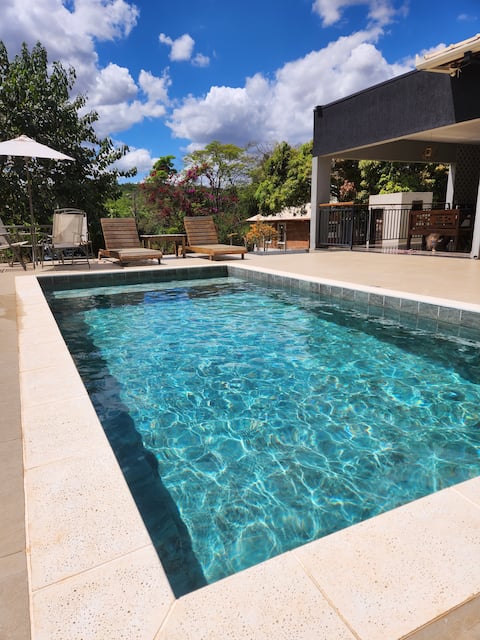
Lovely ranch with pool and 30 min from Inhotim
Entire Place • 4 bedrooms
Note: Performance varies based on location, size, amenities, seasonality, and management quality. Data reflects the past 12 months.
Top Performing Airbnb Hosts in Igarapé (2026)
Learn from the best! This table showcases top-performing Airbnb hosts in Igarapé based on the number of properties managed and estimated total revenue over the past year. Analyze their scale and performance metrics.
| Host Name | Properties | Grossing Revenue | Stay Reviews | Avg Rating |
|---|---|---|---|---|
| Gabriel Godoi | 1 | $34,990 | 98 | 4.97/5.0 |
| Cleber Machado. | 1 | $26,927 | 8 | 5.00/5.0 |
| Mardeline ( Deia) | 2 | $22,833 | 99 | 5.00/5.0 |
| Carlos Alves | 1 | $19,990 | 66 | 4.82/5.0 |
| Pedro | 1 | $18,981 | 83 | 4.93/5.0 |
| Isadora | 1 | $17,771 | 61 | 4.80/5.0 |
| Fernando | 1 | $16,451 | 14 | 5.00/5.0 |
| Jaqueline Arcia | 1 | $15,247 | 21 | 4.90/5.0 |
| Lucas | 1 | $15,082 | 32 | 5.00/5.0 |
| Adonias | 1 | $14,350 | 2 | Not Rated |
Analyzing the strategies of top hosts, such as their property selection, pricing, and guest communication, can offer valuable lessons for optimizing your own Airbnb operations in Igarapé.
Dive Deeper: Advanced Igarapé STR Market Data (2026)
Ready to unlock more insights? AirROI provides access to advanced metrics and comprehensive Airbnb data for Igarapé. Explore detailed analytics beyond this report to refine your investment strategy, optimize pricing, and maximize your vacation rental profits.
Explore Advanced MetricsIgarapé Short-Term Rental Market Composition (2026): Property & Room Types
Room Type Distribution
Property Type Distribution
Market Composition Insights for Igarapé
- The Igarapé Airbnb market composition is heavily skewed towards Entire Home/Apt listings, which make up 100% of the 31 active rentals. This indicates strong guest preference for privacy and space.
- Looking at the property type distribution in Igarapé, House properties are the most common (83.9%), reflecting the local real estate landscape.
- Houses represent a significant 83.9% portion, catering likely to families or larger groups.
- The presence of 9.7% Hotel/Boutique listings indicates integration with traditional hospitality.
- Smaller segments like outdoor/unique, unique stays (combined 6.4%) offer potential for unique stay experiences.
Igarapé Airbnb Room Capacity Analysis (2026): Bedroom Distribution
Distribution of Listings by Number of Bedrooms
Room Capacity Insights for Igarapé
- The dominant room capacity in Igarapé is 2 bedrooms listings, making up 29% of the market. This suggests a strong demand for properties suitable for couples or solo travelers.
- Together, 2 bedrooms and 3 bedrooms properties represent 54.8% of the active Airbnb listings in Igarapé, indicating a high concentration in these sizes.
- A significant 64.6% of listings offer 3+ bedrooms, catering to larger groups and families seeking more space in Igarapé.
Igarapé Vacation Rental Guest Capacity Trends (2026)
Distribution of Listings by Guest Capacity
Guest Capacity Insights for Igarapé
- The most common guest capacity trend in Igarapé vacation rentals is listings accommodating 8+ guests (74.2%). This suggests the primary traveler segment is likely larger groups.
- Properties designed for 8+ guests and 4 guests dominate the Igarapé STR market, accounting for 80.7% of listings.
- 87.2% of properties accommodate 6+ guests, serving the market segment for larger families or group travel in Igarapé.
- On average, properties in Igarapé are equipped to host 7.3 guests.
Igarapé Airbnb Booking Patterns (2026): Available vs. Booked Days
Available Days Distribution
Booked Days Distribution
Booking Pattern Insights for Igarapé
- The most common availability pattern in Igarapé falls within the 271-366 days range, representing 67.7% of listings. This suggests many properties have significant open periods on their calendars.
- Approximately 96.7% of listings show high availability (181+ days open annually), indicating potential for increased bookings or specific owner usage patterns.
- For booked days, the 31-90 days range is most frequent in Igarapé (32.3%), reflecting common guest stay durations or potential owner blocking patterns.
- A notable 3.2% of properties secure long booking periods (181+ days booked per year), highlighting successful long-term rental strategies or significant owner usage.
Igarapé Airbnb Minimum Stay Requirements Analysis
Distribution of Listings by Minimum Night Requirement
1 Night
17 listings
54.8% of total
2 Nights
9 listings
29% of total
30+ Nights
5 listings
16.1% of total
Key Insights
- The most prevalent minimum stay requirement in Igarapé is 1 Night, adopted by 54.8% of listings. This highlights the market's preference for shorter, flexible bookings.
- A strong majority (83.8%) of the Igarapé Airbnb data shows acceptance of very short stays (1-2 nights), indicating a dynamic, high-turnover market.
- A significant segment (16.1%) caters to monthly stays (30+ nights) in Igarapé, pointing to opportunities in the extended-stay market.
Recommendations
- Align with the market by considering a 1 Night minimum stay, as 54.8% of Igarapé hosts use this setting.
- Explore offering discounts for stays of 30+ nights to attract the 16.1% of the market seeking extended stays.
- Adjust minimum nights based on seasonality – potentially shorter during low season and longer during peak demand periods in Igarapé.
Igarapé Airbnb Cancellation Policy Trends Analysis (2026)
Limited
1 listings
3.2% of total
Flexible
5 listings
16.1% of total
Moderate
5 listings
16.1% of total
Firm
15 listings
48.4% of total
Strict
5 listings
16.1% of total
Cancellation Policy Insights for Igarapé
- The prevailing Airbnb cancellation policy trend in Igarapé is Firm, used by 48.4% of listings.
- A majority (64.5%) of hosts in Igarapé utilize Firm or Strict policies, indicating a market where hosts prioritize booking security.
Recommendations for Hosts
- Consider adopting a Firm policy to align with the 48.4% market standard in Igarapé.
- Regularly review your cancellation policy against competitors and market demand shifts in Igarapé.
Igarapé STR Booking Lead Time Analysis (2026)
Average Booking Lead Time by Month
Booking Lead Time Insights for Igarapé
- The overall average booking lead time for vacation rentals in Igarapé is 36 days.
- Guests book furthest in advance for stays during December (average 50 days), likely coinciding with peak travel demand or local events.
- The shortest booking windows occur for stays in February (average 21 days), indicating more last-minute travel plans during this time.
- Seasonally, Summer (35 days avg.) sees the longest lead times, while Winter (32 days avg.) has the shortest, reflecting typical travel planning cycles.
Recommendations for Hosts
- Use the overall average lead time (36 days) as a baseline for your pricing and availability strategy in Igarapé.
- For December stays, consider implementing length-of-stay discounts or slightly higher rates for bookings made less than 50 days out to capitalize on advance planning.
- Target marketing efforts for the Summer season well in advance (at least 35 days) to capture early planners.
- Monitor your own booking lead times against these Igarapé averages to identify opportunities for dynamic pricing adjustments.
Popular & Essential Airbnb Amenities in Igarapé (2026)
Amenity Prevalence
Amenity Insights for Igarapé
- Essential amenities in Igarapé that guests expect include: Kitchen, Free parking on premises, Wifi. Lacking these (any) could significantly impact bookings.
- Popular amenities like TV, BBQ grill, Pool are common but not universal. Offering these can provide a competitive edge.
- A pool is a highly desired but not standard amenity, making it a key feature for attracting guests seeking leisure in Igarapé.
Recommendations for Hosts
- Ensure your listing includes all essential amenities for Igarapé: Kitchen, Free parking on premises, Wifi.
- Prioritize adding missing essentials: Wifi.
- Consider adding popular differentiators like TV or BBQ grill to increase appeal.
- Highlight unique or less common amenities you offer (e.g., hot tub, dedicated workspace, EV charger) in your listing description and photos.
- Regularly check competitor amenities in Igarapé to stay competitive.
Igarapé Airbnb Guest Demographics & Profile Analysis (2026)
Guest Profile Summary for Igarapé
- The typical guest profile for Airbnb in Igarapé consists of primarily domestic travelers (96%), often arriving from nearby Belo Horizonte, typically belonging to the Post-2000s (Gen Z/Alpha) group (50%), primarily speaking Portuguese or English.
- Domestic travelers account for 95.7% of guests.
- Key international markets include Brazil (95.7%) and Chile (1.1%).
- Top languages spoken are Portuguese (46.2%) followed by English (24.6%).
- A significant demographic segment is the Post-2000s (Gen Z/Alpha) group, representing 50% of guests.
Recommendations for Hosts
- Target domestic marketing efforts towards travelers from Belo Horizonte and São Paulo.
- Tailor amenities and listing descriptions to appeal to the dominant Post-2000s (Gen Z/Alpha) demographic (e.g., highlight fast WiFi, smart home features, local guides).
- Highlight unique local experiences or amenities relevant to the primary guest profile.
- Consider seasonal promotions aligned with peak travel times for key origin markets.
Nearby Short-Term Rental Market Comparison
How does the Igarapé Airbnb market stack up against its neighbors? Compare key performance metrics like average monthly revenue, ADR, and occupancy rates in surrounding areas to understand the broader regional STR landscape.
| Market | Active Properties | Monthly Revenue | Daily Rate | Avg. Occupancy |
|---|---|---|---|---|
| Nova Lima | 172 | $965 | $108.86 | 37% |
| Moeda | 40 | $944 | $126.55 | 26% |
| São Joaquim de Bicas | 10 | $935 | $130.63 | 27% |
| Esmeraldas | 64 | $924 | $159.89 | 24% |
| Confins | 17 | $867 | $147.70 | 30% |
| Mateus Leme | 25 | $860 | $145.93 | 24% |
| Jaboticatubas | 198 | $820 | $130.91 | 27% |
| Ijaci | 16 | $792 | $140.06 | 28% |
| Ribeirão das Neves | 24 | $786 | $149.02 | 30% |
| Santa Cruz de Minas | 13 | $774 | $71.50 | 32% |