Itajubá Airbnb Market Analysis 2026: Short Term Rental Data & Vacation Rental Statistics in Minas Gerais, Brazil
Is Airbnb profitable in Itajubá in 2026? Explore comprehensive Airbnb analytics for Itajubá, Minas Gerais, Brazil to uncover income potential. This 2026 STR market report for Itajubá, based on AirROI data from February 2025 to January 2026, reveals key trends in the niche market of 59 active listings.
Whether you're considering an Airbnb investment in Itajubá, optimizing your existing vacation rental, or exploring rental arbitrage opportunities, understanding the Itajubá Airbnb data is crucial. Leveraging the low regulation environment is key to maximizing your short term rental income potential. Let's dive into the specifics.
Key Itajubá Airbnb Performance Metrics Overview
Monthly Airbnb Revenue Variations & Income Potential in Itajubá (2026)
Understanding the monthly revenue variations for Airbnb listings in Itajubá is key to maximizing your short term rental income potential. Seasonality significantly impacts earnings. Our analysis, based on data from the past 12 months, shows that the peak revenue month for STRs in Itajubá is typically December, while August often presents the lowest earnings, highlighting opportunities for strategic pricing adjustments during shoulder and low seasons. Explore the typical Airbnb income in Itajubá across different performance tiers:
- Best-in-class properties (Top 10%) achieve $1,736+ monthly, often utilizing dynamic pricing and superior guest experiences.
- Strong performing properties (Top 25%) earn $894 or more, indicating effective management and desirable locations/amenities.
- Typical properties (Median) generate around $442 per month, representing the average market performance.
- Entry-level properties (Bottom 25%) see earnings around $225, often with potential for optimization.
Average Monthly Airbnb Earnings Trend in Itajubá
Itajubá Airbnb Occupancy Rate Trends (2026)
Maximize your bookings by understanding the Itajubá STR occupancy trends. Seasonal demand shifts significantly influence how often properties are booked. Typically, Marchsees the highest demand (peak season occupancy), while November experiences the lowest (low season). Effective strategies, like adjusting minimum stays or offering promotions, can boost occupancy during slower periods. Here's how different property tiers perform in Itajubá:
- Best-in-class properties (Top 10%) achieve 71%+ occupancy, indicating high desirability and potentially optimized availability.
- Strong performing properties (Top 25%) maintain 47% or higher occupancy, suggesting good market fit and guest satisfaction.
- Typical properties (Median) have an occupancy rate around 27%.
- Entry-level properties (Bottom 25%) average 13% occupancy, potentially facing higher vacancy.
Average Monthly Occupancy Rate Trend in Itajubá
Average Daily Rate (ADR) Airbnb Trends in Itajubá (2026)
Effective short term rental pricing strategy in Itajubá involves understanding monthly ADR fluctuations. The Average Daily Rate (ADR) for Airbnb in Itajubá typically peaks in September and dips lowest during April. Leveraging Airbnb dynamic pricing tools or strategies based on this seasonality can significantly boost revenue. Here's a look at the typical nightly rates achieved:
- Best-in-class properties (Top 10%) command rates of $149+ per night, often due to premium features or locations.
- Strong performing properties (Top 25%) achieve nightly rates of $78 or more.
- Typical properties (Median) charge around $42 per night.
- Entry-level properties (Bottom 25%) earn around $27 per night.
Average Daily Rate (ADR) Trend by Month in Itajubá
Get Live Itajubá Market Intelligence 👇

Explore Real-time Analytics
Airbnb Seasonality Analysis & Trends in Itajubá (2026)
Peak Season (December, June, October)
- Revenue averages $849 per month
- Occupancy rates average 35.6%
- Daily rates average $74
Shoulder Season
- Revenue averages $740 per month
- Occupancy maintains around 34.5%
- Daily rates hold near $72
Low Season (January, February, August)
- Revenue drops to average $588 per month
- Occupancy decreases to average 29.6%
- Daily rates adjust to average $72
Seasonality Insights for Itajubá
- The Airbnb seasonality in Itajubá shows moderate seasonality with distinct peak and low periods. While the sections above show seasonal averages, it's also insightful to look at the extremes:
- During the high season, the absolute peak month showcases Itajubá's highest earning potential, with monthly revenues capable of climbing to $877, occupancy reaching a high of 40.3%, and ADRs peaking at $78.
- Conversely, the slowest single month of the year, typically falling within the low season, marks the market's lowest point. In this month, revenue might dip to $504, occupancy could drop to 25.7%, and ADRs may adjust down to $67.
- Understanding both the seasonal averages and these monthly peaks and troughs in revenue, occupancy, and ADR is crucial for maximizing your Airbnb profit potential in Itajubá.
Seasonal Strategies for Maximizing Profit
- Peak Season: Maximize revenue through premium pricing and potentially longer minimum stays. Ensure high availability.
- Low Season: Offer competitive pricing, special promotions (e.g., extended stay discounts), and flexible cancellation policies. Target off-season travelers like remote workers or budget-conscious guests.
- Shoulder Seasons: Implement dynamic pricing that balances peak and low rates. Target weekend travelers or specific events. Offer slightly more flexible terms than peak season.
- Regularly analyze your own performance against these Itajubá seasonality benchmarks and adjust your pricing and availability strategy accordingly.
Best Areas for Airbnb Investment in Itajubá (2026)
Exploring the top neighborhoods for short-term rentals in Itajubá? This section highlights key areas, outlining why they are attractive for hosts and guests, along with notable local attractions. Consider these locations based on your target guest profile and investment strategy.
| Neighborhood / Area | Why Host Here? (Target Guests & Appeal) | Key Attractions & Landmarks |
|---|---|---|
| Centro | The heart of Itajubá with historical significance and accessibility to various services. It's ideal for attracting tourists exploring the city's cultural heritage. | Itajubá Cathedral, Museu de Itajubá, Praça Dr. Lisboa, Café Avenida, Parque da Cidade |
| Parque da Cidade | A green, tranquil area perfect for families and nature lovers. Close to parks and outdoor activities, popular among those seeking relaxation. | Parque da Cidade, Cascata do Salto, Trilha do Córrego, Árvore Centenária, Espaço Verde |
| Santa Rita | A charming residential area that provides a local experience with easy access to shops and cafes. It attracts visitors who prefer a quieter atmosphere. | Praça Santa Rita, Feira Livre, Cafeteria Bistrô, Igreja de Santa Rita, Restaurante Bom Apetite |
| São Vicente | A suburban neighborhood known for its community spirit and local eateries. It offers a more authentic experience of daily life in Itajubá. | Igreja de São Vicente, Vila Verde, Caminhada no Parque, Mercado Municipal, Cultura local |
| Bairro Varginha | A quaint area with picturesque views and friendly atmosphere. It is popular among outdoor enthusiasts and those looking to hike. | Mirante do Bairro Varginha, Caminhada pela Serra, Restaurante Recanto, Cavernas de Itajubá, Praça do Povo |
| Jardim do Sul | A peaceful neighborhood ideal for families, with nearby schools and parks. It's attractive for visitors looking for a more residential feel. | Praça do Jardim do Sul, Parque do Sul, Café do Jardim, Escola Municipal, Restaurante Sabor da Terra |
| Morada do Sol | An upscale area with beautiful homes and quiet streets. It appeals to those looking for a luxurious stay in Itajubá. | Lagoa Morada do Sol, Trilhas ao redor, Café Premium, Empreendimentos Imobiliários, Pousadas de Luxo |
| Estrada do Vale | A scenic road area with access to nature and beautiful landscapes. It attracts visitors who want to escape into the Brazilian countryside. | Cachoeira do Vale, Ponto de Observação, Caminhadas Ecológicas, Ranchos e Estâncias, Restaurantes à beira da estrada |
Understanding Airbnb License Requirements & STR Laws in Itajubá (2026)
While Itajubá, Minas Gerais, Brazil currently shows low STR regulations, specific Airbnb license requirements might still exist or change. Always verify the latest short term rental regulations and Airbnb license requirements directly with local government authorities for Itajubá to ensure full compliance before hosting.
(Source: AirROI data, 2026, finding no licensed listings among those analyzed)
Top Performing Airbnb Properties in Itajubá (2026)
Benchmark your potential! Explore examples of top-performing Airbnb properties in Itajubábased on Trailing Twelve Month (TTM) revenue. Analyze their characteristics, revenue, occupancy rate, and ADR to understand what drives success in this market.
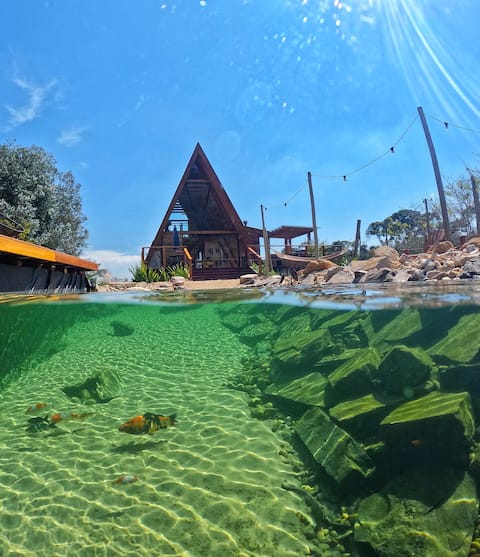
Chalé dos Ventos private pool
Entire Place • 1 bedroom
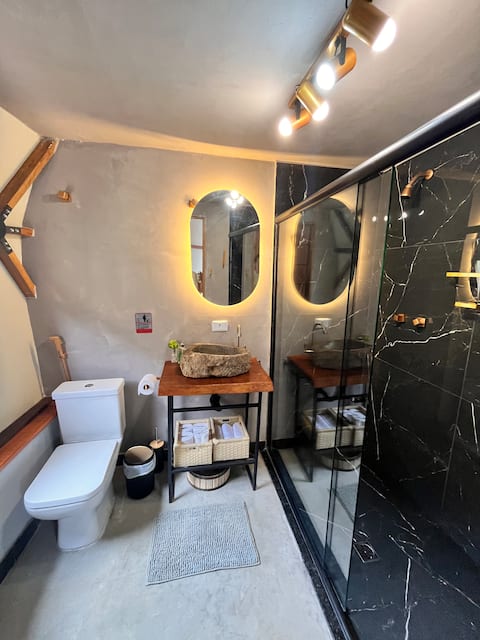
Moonlight Geodesic Dome
Entire Place • 1 bedroom
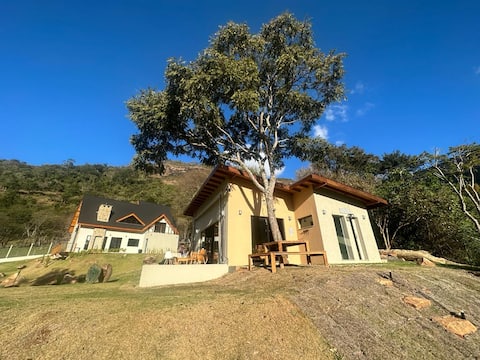
Chalet Canta Galo
Entire Place • 5 bedrooms
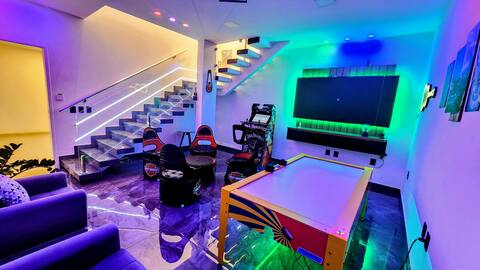
Eldorado's Jewel
Entire Place • 3 bedrooms

Altos Da Mantiqueira Cottage
Entire Place • 3 bedrooms
Wooden House Chalet
Entire Place • 5 bedrooms
Note: Performance varies based on location, size, amenities, seasonality, and management quality. Data reflects the past 12 months.
Top Performing Airbnb Hosts in Itajubá (2026)
Learn from the best! This table showcases top-performing Airbnb hosts in Itajubá based on the number of properties managed and estimated total revenue over the past year. Analyze their scale and performance metrics.
| Host Name | Properties | Grossing Revenue | Stay Reviews | Avg Rating |
|---|---|---|---|---|
| Camila | 1 | $42,859 | 91 | 5.00/5.0 |
| Domo Moonlight | 1 | $27,056 | 63 | 5.00/5.0 |
| Liliane | 9 | $26,671 | 151 | 4.88/5.0 |
| Lorena | 1 | $23,060 | 23 | 4.96/5.0 |
| William Douglas Da | 1 | $18,904 | 116 | 4.99/5.0 |
| Gustavo | 1 | $18,123 | 8 | 5.00/5.0 |
| Ana Maria | 1 | $16,483 | 12 | 4.92/5.0 |
| Pedro Henrique | 2 | $13,668 | 60 | 4.79/5.0 |
| Thiago | 1 | $12,277 | 13 | 5.00/5.0 |
| Vanderlei Dias | 2 | $12,043 | 9 | 5.00/5.0 |
Analyzing the strategies of top hosts, such as their property selection, pricing, and guest communication, can offer valuable lessons for optimizing your own Airbnb operations in Itajubá.
Dive Deeper: Advanced Itajubá STR Market Data (2026)
Ready to unlock more insights? AirROI provides access to advanced metrics and comprehensive Airbnb data for Itajubá. Explore detailed analytics beyond this report to refine your investment strategy, optimize pricing, and maximize your vacation rental profits.
Explore Advanced MetricsItajubá Short-Term Rental Market Composition (2026): Property & Room Types
Room Type Distribution
Property Type Distribution
Market Composition Insights for Itajubá
- The Itajubá Airbnb market composition is heavily skewed towards Entire Home/Apt listings, which make up 91.5% of the 59 active rentals. This indicates strong guest preference for privacy and space.
- Looking at the property type distribution in Itajubá, House properties are the most common (50.8%), reflecting the local real estate landscape.
- Houses represent a significant 50.8% portion, catering likely to families or larger groups.
- The presence of 8.5% Hotel/Boutique listings indicates integration with traditional hospitality.
- Smaller segments like outdoor/unique, unique stays (combined 3.4%) offer potential for unique stay experiences.
Itajubá Airbnb Room Capacity Analysis (2026): Bedroom Distribution
Distribution of Listings by Number of Bedrooms
Room Capacity Insights for Itajubá
- The dominant room capacity in Itajubá is 1 bedroom listings, making up 44.1% of the market. This suggests a strong demand for properties suitable for couples or solo travelers.
- Together, 1 bedroom and 3 bedrooms properties represent 61.0% of the active Airbnb listings in Itajubá, indicating a high concentration in these sizes.
- A significant 32.2% of listings offer 3+ bedrooms, catering to larger groups and families seeking more space in Itajubá.
Itajubá Vacation Rental Guest Capacity Trends (2026)
Distribution of Listings by Guest Capacity
Guest Capacity Insights for Itajubá
- The most common guest capacity trend in Itajubá vacation rentals is listings accommodating 8+ guests (27.1%). This suggests the primary traveler segment is likely larger groups.
- Properties designed for 8+ guests and 3 guests dominate the Itajubá STR market, accounting for 47.4% of listings.
- 37.3% of properties accommodate 6+ guests, serving the market segment for larger families or group travel in Itajubá.
- On average, properties in Itajubá are equipped to host 4.4 guests.
Itajubá Airbnb Booking Patterns (2026): Available vs. Booked Days
Available Days Distribution
Booked Days Distribution
Booking Pattern Insights for Itajubá
- The most common availability pattern in Itajubá falls within the 271-366 days range, representing 62.7% of listings. This suggests many properties have significant open periods on their calendars.
- Approximately 89.8% of listings show high availability (181+ days open annually), indicating potential for increased bookings or specific owner usage patterns.
- For booked days, the 1-30 days range is most frequent in Itajubá (32.2%), reflecting common guest stay durations or potential owner blocking patterns.
- A notable 10.2% of properties secure long booking periods (181+ days booked per year), highlighting successful long-term rental strategies or significant owner usage.
Itajubá Airbnb Minimum Stay Requirements Analysis
Distribution of Listings by Minimum Night Requirement
1 Night
35 listings
59.3% of total
2 Nights
11 listings
18.6% of total
3 Nights
1 listings
1.7% of total
4-6 Nights
1 listings
1.7% of total
30+ Nights
11 listings
18.6% of total
Key Insights
- The most prevalent minimum stay requirement in Itajubá is 1 Night, adopted by 59.3% of listings. This highlights the market's preference for shorter, flexible bookings.
- A strong majority (77.9%) of the Itajubá Airbnb data shows acceptance of very short stays (1-2 nights), indicating a dynamic, high-turnover market.
- A significant segment (18.6%) caters to monthly stays (30+ nights) in Itajubá, pointing to opportunities in the extended-stay market.
Recommendations
- Align with the market by considering a 1 Night minimum stay, as 59.3% of Itajubá hosts use this setting.
- Explore offering discounts for stays of 30+ nights to attract the 18.6% of the market seeking extended stays.
- Adjust minimum nights based on seasonality – potentially shorter during low season and longer during peak demand periods in Itajubá.
Itajubá Airbnb Cancellation Policy Trends Analysis (2026)
Flexible
17 listings
29.3% of total
Moderate
22 listings
37.9% of total
Firm
16 listings
27.6% of total
Strict
3 listings
5.2% of total
Cancellation Policy Insights for Itajubá
- The prevailing Airbnb cancellation policy trend in Itajubá is Moderate, used by 37.9% of listings.
- There's a relatively balanced mix between guest-friendly (67.2%) and stricter (32.8%) policies, offering choices for different guest needs.
- Strict cancellation policies are quite rare (5.2%), potentially making listings with this policy less competitive unless justified by high demand or property type.
Recommendations for Hosts
- Consider adopting a Moderate policy to align with the 37.9% market standard in Itajubá.
- Using a Strict policy might deter some guests, as only 5.2% of listings use it. Evaluate if potential revenue protection outweighs possible lower booking rates.
- Regularly review your cancellation policy against competitors and market demand shifts in Itajubá.
Itajubá STR Booking Lead Time Analysis (2026)
Average Booking Lead Time by Month
Booking Lead Time Insights for Itajubá
- The overall average booking lead time for vacation rentals in Itajubá is 31 days.
- Guests book furthest in advance for stays during July (average 51 days), likely coinciding with peak travel demand or local events.
- The shortest booking windows occur for stays in February (average 11 days), indicating more last-minute travel plans during this time.
- Seasonally, Winter (33 days avg.) sees the longest lead times, while Spring (18 days avg.) has the shortest, reflecting typical travel planning cycles.
Recommendations for Hosts
- Use the overall average lead time (31 days) as a baseline for your pricing and availability strategy in Itajubá.
- For July stays, consider implementing length-of-stay discounts or slightly higher rates for bookings made less than 51 days out to capitalize on advance planning.
- During February, focus on last-minute booking availability and promotions, as guests book with very short notice (11 days avg.).
- Target marketing efforts for the Winter season well in advance (at least 33 days) to capture early planners.
- Monitor your own booking lead times against these Itajubá averages to identify opportunities for dynamic pricing adjustments.
Popular & Essential Airbnb Amenities in Itajubá (2026)
Amenity Prevalence
Amenity Insights for Itajubá
- Popular amenities like Wifi, Kitchen, Free parking on premises are common but not universal. Offering these can provide a competitive edge.
- Warning: Wifi is not universally provided but is considered essential globally. Ensure reliable Wifi is offered.
Recommendations for Hosts
- Consider adding popular differentiators like Wifi or Kitchen to increase appeal.
- Highlight unique or less common amenities you offer (e.g., hot tub, dedicated workspace, EV charger) in your listing description and photos.
- Regularly check competitor amenities in Itajubá to stay competitive.
Itajubá Airbnb Guest Demographics & Profile Analysis (2026)
Guest Profile Summary for Itajubá
- The typical guest profile for Airbnb in Itajubá consists of primarily domestic travelers (93%), often arriving from nearby São Paulo, typically belonging to the Post-2000s (Gen Z/Alpha) group (50%), primarily speaking Portuguese or English.
- Domestic travelers account for 92.9% of guests.
- Key international markets include Brazil (92.9%) and United States (1%).
- Top languages spoken are Portuguese (46.6%) followed by English (32.8%).
- A significant demographic segment is the Post-2000s (Gen Z/Alpha) group, representing 50% of guests.
Recommendations for Hosts
- Target domestic marketing efforts towards travelers from São Paulo and Rio de Janeiro.
- Tailor amenities and listing descriptions to appeal to the dominant Post-2000s (Gen Z/Alpha) demographic (e.g., highlight fast WiFi, smart home features, local guides).
- Highlight unique local experiences or amenities relevant to the primary guest profile.
- Consider seasonal promotions aligned with peak travel times for key origin markets.
Nearby Short-Term Rental Market Comparison
How does the Itajubá Airbnb market stack up against its neighbors? Compare key performance metrics like average monthly revenue, ADR, and occupancy rates in surrounding areas to understand the broader regional STR landscape.
| Market | Active Properties | Monthly Revenue | Daily Rate | Avg. Occupancy |
|---|---|---|---|---|
| Riviera de São Lourenço | 10 | $2,868 | $213.78 | 46% |
| Ilha Grande | 11 | $1,783 | $166.42 | 38% |
| Tuiuti | 18 | $1,686 | $156.45 | 30% |
| Morungaba | 31 | $1,435 | $263.39 | 27% |
| Campo Limpo Paulista | 49 | $1,428 | $181.02 | 30% |
| Valinhos | 61 | $1,370 | $176.28 | 33% |
| Itatiba | 171 | $1,331 | $177.58 | 29% |
| Vargem | 48 | $1,319 | $190.42 | 28% |
| Queluz | 17 | $1,291 | $152.05 | 30% |
| Bom Jesus dos Perdões | 83 | $1,236 | $167.74 | 28% |