Itanhandu Airbnb Market Analysis 2026: Short Term Rental Data & Vacation Rental Statistics in Minas Gerais, Brazil
Is Airbnb profitable in Itanhandu in 2026? Explore comprehensive Airbnb analytics for Itanhandu, Minas Gerais, Brazil to uncover income potential. This 2026 STR market report for Itanhandu, based on AirROI data from February 2025 to January 2026, reveals key trends in the niche market of 31 active listings.
Whether you're considering an Airbnb investment in Itanhandu, optimizing your existing vacation rental, or exploring rental arbitrage opportunities, understanding the Itanhandu Airbnb data is crucial. Leveraging the low regulation environment is key to maximizing your short term rental income potential. Let's dive into the specifics.
Key Itanhandu Airbnb Performance Metrics Overview
Monthly Airbnb Revenue Variations & Income Potential in Itanhandu (2026)
Understanding the monthly revenue variations for Airbnb listings in Itanhandu is key to maximizing your short term rental income potential. Seasonality significantly impacts earnings. Our analysis, based on data from the past 12 months, shows that the peak revenue month for STRs in Itanhandu is typically May, while August often presents the lowest earnings, highlighting opportunities for strategic pricing adjustments during shoulder and low seasons. Explore the typical Airbnb income in Itanhandu across different performance tiers:
- Best-in-class properties (Top 10%) achieve $3,713+ monthly, often utilizing dynamic pricing and superior guest experiences.
- Strong performing properties (Top 25%) earn $2,073 or more, indicating effective management and desirable locations/amenities.
- Typical properties (Median) generate around $475 per month, representing the average market performance.
- Entry-level properties (Bottom 25%) see earnings around $149, often with potential for optimization.
Average Monthly Airbnb Earnings Trend in Itanhandu
Itanhandu Airbnb Occupancy Rate Trends (2026)
Maximize your bookings by understanding the Itanhandu STR occupancy trends. Seasonal demand shifts significantly influence how often properties are booked. Typically, Septembersees the highest demand (peak season occupancy), while February experiences the lowest (low season). Effective strategies, like adjusting minimum stays or offering promotions, can boost occupancy during slower periods. Here's how different property tiers perform in Itanhandu:
- Best-in-class properties (Top 10%) achieve 55%+ occupancy, indicating high desirability and potentially optimized availability.
- Strong performing properties (Top 25%) maintain 39% or higher occupancy, suggesting good market fit and guest satisfaction.
- Typical properties (Median) have an occupancy rate around 19%.
- Entry-level properties (Bottom 25%) average 12% occupancy, potentially facing higher vacancy.
Average Monthly Occupancy Rate Trend in Itanhandu
Average Daily Rate (ADR) Airbnb Trends in Itanhandu (2026)
Effective short term rental pricing strategy in Itanhandu involves understanding monthly ADR fluctuations. The Average Daily Rate (ADR) for Airbnb in Itanhandu typically peaks in March and dips lowest during April. Leveraging Airbnb dynamic pricing tools or strategies based on this seasonality can significantly boost revenue. Here's a look at the typical nightly rates achieved:
- Best-in-class properties (Top 10%) command rates of $217+ per night, often due to premium features or locations.
- Strong performing properties (Top 25%) achieve nightly rates of $129 or more.
- Typical properties (Median) charge around $70 per night.
- Entry-level properties (Bottom 25%) earn around $42 per night.
Average Daily Rate (ADR) Trend by Month in Itanhandu
Get Live Itanhandu Market Intelligence 👇

Explore Real-time Analytics
Airbnb Seasonality Analysis & Trends in Itanhandu (2026)
Peak Season (May, January, December)
- Revenue averages $1,668 per month
- Occupancy rates average 29.8%
- Daily rates average $106
Shoulder Season
- Revenue averages $1,214 per month
- Occupancy maintains around 26.4%
- Daily rates hold near $104
Low Season (February, August, November)
- Revenue drops to average $1,010 per month
- Occupancy decreases to average 22.6%
- Daily rates adjust to average $104
Seasonality Insights for Itanhandu
- The Airbnb seasonality in Itanhandu shows highly seasonal trends requiring careful strategy. While the sections above show seasonal averages, it's also insightful to look at the extremes:
- During the high season, the absolute peak month showcases Itanhandu's highest earning potential, with monthly revenues capable of climbing to $2,168, occupancy reaching a high of 31.5%, and ADRs peaking at $110.
- Conversely, the slowest single month of the year, typically falling within the low season, marks the market's lowest point. In this month, revenue might dip to $927, occupancy could drop to 20.8%, and ADRs may adjust down to $99.
- Understanding both the seasonal averages and these monthly peaks and troughs in revenue, occupancy, and ADR is crucial for maximizing your Airbnb profit potential in Itanhandu.
Seasonal Strategies for Maximizing Profit
- Peak Season: Maximize revenue through premium pricing and potentially longer minimum stays. Ensure high availability.
- Low Season: Offer competitive pricing, special promotions (e.g., extended stay discounts), and flexible cancellation policies. Target off-season travelers like remote workers or budget-conscious guests.
- Shoulder Seasons: Implement dynamic pricing that balances peak and low rates. Target weekend travelers or specific events. Offer slightly more flexible terms than peak season.
- Regularly analyze your own performance against these Itanhandu seasonality benchmarks and adjust your pricing and availability strategy accordingly.
Best Areas for Airbnb Investment in Itanhandu (2026)
Exploring the top neighborhoods for short-term rentals in Itanhandu? This section highlights key areas, outlining why they are attractive for hosts and guests, along with notable local attractions. Consider these locations based on your target guest profile and investment strategy.
| Neighborhood / Area | Why Host Here? (Target Guests & Appeal) | Key Attractions & Landmarks |
|---|---|---|
| Centro | The heart of Itanhandu, popular for its historical architecture, local shops, and restaurants. It offers visitors a convenient base to explore the town's cultural sites. | Historical churches, Municipal market, Local artisan shops, Cultural events, Restaurants featuring regional cuisine |
| Serra da Mantiqueira | A stunning mountain range providing breathtaking views, ideal for nature lovers and adventure seekers. This area is perfect for eco-tourism and outdoor activities. | Hiking trails, Waterfalls, Scenic viewpoints, Nature reserves, Wildlife watching |
| Cachoeira do Futebol | A beautiful waterfall area that attracts visitors for its natural beauty and opportunities for relaxation and picnicking. Great for families and nature enthusiasts. | Waterfalls, Picnic areas, Nature trails, Swimming spots, Bird watching |
| Parque Estadual da Serra do Papagaio | A protected park known for its rich biodiversity and various ecosystems. It draws tourists interested in trekking and experiencing untouched nature. | Trekking routes, Endemic species, Stunning landscapes, Camping areas, Natural pools |
| Bairro do Loteamento | A growing neighborhood with a mix of residential and tourist accommodations. It's increasingly popular among Airbnb guests for its local vibe. | Local markets, Small eateries, Community events, Parks |
| Mirante do Paraíso | A scenic viewpoint that offers some of the best views in Itanhandu. It's a perfect spot for sunset watchers and photographers. | Panoramic views, Sunset watching, Photography opportunities, Small hiking paths |
| Praça da Igreja Matriz | An important square that often hosts community events and gatherings. Visitors can enjoy the local culture and socialize with residents. | Igreja Matriz, Markets, Cultural events, Local gatherings |
| Trilha do 7 Quedas | A thrilling hiking trail leading to waterfalls. It's an attractive destination for adventure seekers and hikers. | Hiking, Waterfalls, Scenic nature views, Biodiversity, Adventure activities |
Understanding Airbnb License Requirements & STR Laws in Itanhandu (2026)
While Itanhandu, Minas Gerais, Brazil currently shows low STR regulations, specific Airbnb license requirements might still exist or change. Always verify the latest short term rental regulations and Airbnb license requirements directly with local government authorities for Itanhandu to ensure full compliance before hosting.
(Source: AirROI data, 2026, finding no licensed listings among those analyzed)
Top Performing Airbnb Properties in Itanhandu (2026)
Benchmark your potential! Explore examples of top-performing Airbnb properties in Itanhandubased on Trailing Twelve Month (TTM) revenue. Analyze their characteristics, revenue, occupancy rate, and ADR to understand what drives success in this market.

Solarium Mantiqueira 1 - Comfort and amazing view
Entire Place • 1 bedroom
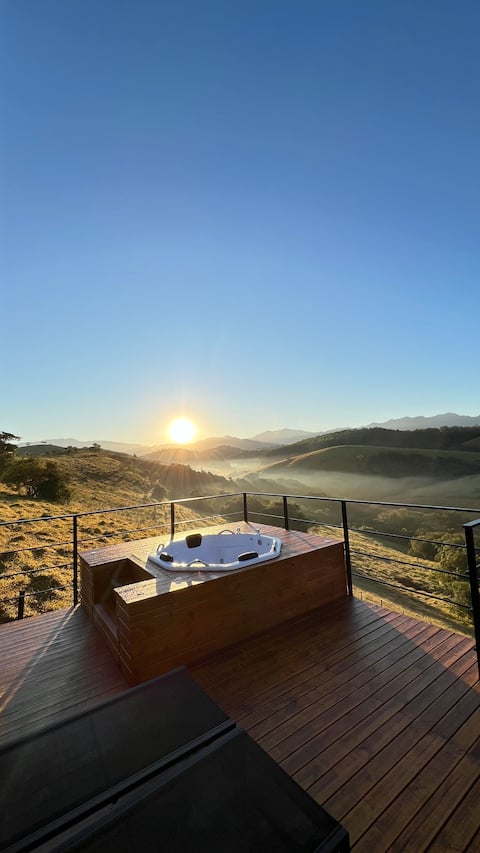
A-Frame Cabin with Hot Tub and Panoramic View
Entire Place • 1 bedroom

Full Mantiqueira Sunroom!
Entire Place • 2 bedrooms

Highland Retreat
Entire Place • 1 bedroom

Solarium Mantiqueira 2 – Panoramic Cinema with SPA
Entire Place • 1 bedroom

A-Frame Cabin with Hot Tub and Panoramic View
Entire Place • 1 bedroom
Note: Performance varies based on location, size, amenities, seasonality, and management quality. Data reflects the past 12 months.
Top Performing Airbnb Hosts in Itanhandu (2026)
Learn from the best! This table showcases top-performing Airbnb hosts in Itanhandu based on the number of properties managed and estimated total revenue over the past year. Analyze their scale and performance metrics.
| Host Name | Properties | Grossing Revenue | Stay Reviews | Avg Rating |
|---|---|---|---|---|
| Lucas Mancilha | 3 | $124,011 | 102 | 5.00/5.0 |
| Estância Casa Nova | 2 | $60,987 | 44 | 5.00/5.0 |
| Palmer | 2 | $48,349 | 130 | 5.00/5.0 |
| Taiane | 1 | $15,760 | 44 | 4.95/5.0 |
| Mauricio | 3 | $9,252 | 69 | 4.92/5.0 |
| Cristina | 1 | $8,778 | 8 | 5.00/5.0 |
| Ernesto Paiva | 3 | $6,025 | 37 | 4.87/5.0 |
| Sandra Pezzo | 2 | $4,889 | 35 | 4.95/5.0 |
| Fabiano | 1 | $3,423 | 14 | 4.57/5.0 |
| Caue | 3 | $2,763 | 3 | Not Rated |
Analyzing the strategies of top hosts, such as their property selection, pricing, and guest communication, can offer valuable lessons for optimizing your own Airbnb operations in Itanhandu.
Dive Deeper: Advanced Itanhandu STR Market Data (2026)
Ready to unlock more insights? AirROI provides access to advanced metrics and comprehensive Airbnb data for Itanhandu. Explore detailed analytics beyond this report to refine your investment strategy, optimize pricing, and maximize your vacation rental profits.
Explore Advanced MetricsItanhandu Short-Term Rental Market Composition (2026): Property & Room Types
Room Type Distribution
Property Type Distribution
Market Composition Insights for Itanhandu
- The Itanhandu Airbnb market composition is heavily skewed towards Entire Home/Apt listings, which make up 80.6% of the 31 active rentals. This indicates strong guest preference for privacy and space.
- Looking at the property type distribution in Itanhandu, House properties are the most common (48.4%), reflecting the local real estate landscape.
- Houses represent a significant 48.4% portion, catering likely to families or larger groups.
- The presence of 6.5% Hotel/Boutique listings indicates integration with traditional hospitality.
- Smaller segments like unique stays (combined 3.2%) offer potential for unique stay experiences.
Itanhandu Airbnb Room Capacity Analysis (2026): Bedroom Distribution
Distribution of Listings by Number of Bedrooms
Room Capacity Insights for Itanhandu
- The dominant room capacity in Itanhandu is 1 bedroom listings, making up 54.8% of the market. This suggests a strong demand for properties suitable for couples or solo travelers.
- Together, 1 bedroom and 3 bedrooms properties represent 67.7% of the active Airbnb listings in Itanhandu, indicating a high concentration in these sizes.
- With over half the market (54.8%) consisting of studios or 1-bedroom units, Itanhandu is particularly well-suited for individuals or couples.
- A significant 22.6% of listings offer 3+ bedrooms, catering to larger groups and families seeking more space in Itanhandu.
Itanhandu Vacation Rental Guest Capacity Trends (2026)
Distribution of Listings by Guest Capacity
Guest Capacity Insights for Itanhandu
- The most common guest capacity trend in Itanhandu vacation rentals is listings accommodating 2 guests (22.6%). This suggests the primary traveler segment is likely couples or solo travelers.
- Properties designed for 2 guests and 8+ guests dominate the Itanhandu STR market, accounting for 42.0% of listings.
- 25.9% of properties accommodate 6+ guests, serving the market segment for larger families or group travel in Itanhandu.
- On average, properties in Itanhandu are equipped to host 3.7 guests.
Itanhandu Airbnb Booking Patterns (2026): Available vs. Booked Days
Available Days Distribution
Booked Days Distribution
Booking Pattern Insights for Itanhandu
- The most common availability pattern in Itanhandu falls within the 271-366 days range, representing 77.4% of listings. This suggests many properties have significant open periods on their calendars.
- Approximately 90.3% of listings show high availability (181+ days open annually), indicating potential for increased bookings or specific owner usage patterns.
- For booked days, the 1-30 days range is most frequent in Itanhandu (48.4%), reflecting common guest stay durations or potential owner blocking patterns.
- A notable 9.7% of properties secure long booking periods (181+ days booked per year), highlighting successful long-term rental strategies or significant owner usage.
Itanhandu Airbnb Minimum Stay Requirements Analysis
Distribution of Listings by Minimum Night Requirement
1 Night
23 listings
74.2% of total
2 Nights
6 listings
19.4% of total
30+ Nights
2 listings
6.5% of total
Key Insights
- The most prevalent minimum stay requirement in Itanhandu is 1 Night, adopted by 74.2% of listings. This highlights the market's preference for shorter, flexible bookings.
- A strong majority (93.6%) of the Itanhandu Airbnb data shows acceptance of very short stays (1-2 nights), indicating a dynamic, high-turnover market.
Recommendations
- Align with the market by considering a 1 Night minimum stay, as 74.2% of Itanhandu hosts use this setting.
- Explore offering discounts for stays of 30+ nights to attract the 6.5% of the market seeking extended stays.
- Adjust minimum nights based on seasonality – potentially shorter during low season and longer during peak demand periods in Itanhandu.
Itanhandu Airbnb Cancellation Policy Trends Analysis (2026)
Super Strict 30 Days
4 listings
12.9% of total
Flexible
9 listings
29% of total
Moderate
10 listings
32.3% of total
Firm
7 listings
22.6% of total
Strict
1 listings
3.2% of total
Cancellation Policy Insights for Itanhandu
- The prevailing Airbnb cancellation policy trend in Itanhandu is Moderate, used by 32.3% of listings.
- There's a relatively balanced mix between guest-friendly (61.3%) and stricter (25.8%) policies, offering choices for different guest needs.
- Strict cancellation policies are quite rare (3.2%), potentially making listings with this policy less competitive unless justified by high demand or property type.
Recommendations for Hosts
- Consider adopting a Moderate policy to align with the 32.3% market standard in Itanhandu.
- Using a Strict policy might deter some guests, as only 3.2% of listings use it. Evaluate if potential revenue protection outweighs possible lower booking rates.
- Regularly review your cancellation policy against competitors and market demand shifts in Itanhandu.
Itanhandu STR Booking Lead Time Analysis (2026)
Average Booking Lead Time by Month
Booking Lead Time Insights for Itanhandu
- The overall average booking lead time for vacation rentals in Itanhandu is 54 days.
- Guests book furthest in advance for stays during August (average 133 days), likely coinciding with peak travel demand or local events.
- The shortest booking windows occur for stays in May (average 13 days), indicating more last-minute travel plans during this time.
- Seasonally, Summer (64 days avg.) sees the longest lead times, while Spring (17 days avg.) has the shortest, reflecting typical travel planning cycles.
Recommendations for Hosts
- Use the overall average lead time (54 days) as a baseline for your pricing and availability strategy in Itanhandu.
- For August stays, consider implementing length-of-stay discounts or slightly higher rates for bookings made less than 133 days out to capitalize on advance planning.
- During May, focus on last-minute booking availability and promotions, as guests book with very short notice (13 days avg.).
- Target marketing efforts for the Summer season well in advance (at least 64 days) to capture early planners.
- Monitor your own booking lead times against these Itanhandu averages to identify opportunities for dynamic pricing adjustments.
Popular & Essential Airbnb Amenities in Itanhandu (2026)
Amenity Prevalence
Amenity Insights for Itanhandu
- Popular amenities like Wifi, Free parking on premises, Kitchen are common but not universal. Offering these can provide a competitive edge.
- Warning: Wifi is not universally provided but is considered essential globally. Ensure reliable Wifi is offered.
Recommendations for Hosts
- Consider adding popular differentiators like Wifi or Free parking on premises to increase appeal.
- Highlight unique or less common amenities you offer (e.g., hot tub, dedicated workspace, EV charger) in your listing description and photos.
- Regularly check competitor amenities in Itanhandu to stay competitive.
Itanhandu Airbnb Guest Demographics & Profile Analysis (2026)
Guest Profile Summary for Itanhandu
- The typical guest profile for Airbnb in Itanhandu consists of primarily domestic travelers (97%), often arriving from nearby São Paulo, typically belonging to the Post-2000s (Gen Z/Alpha) group (50%), primarily speaking Portuguese or English.
- Domestic travelers account for 97.4% of guests.
- Key international markets include Brazil (97.4%) and Norway (1.3%).
- Top languages spoken are Portuguese (51.7%) followed by English (23.3%).
- A significant demographic segment is the Post-2000s (Gen Z/Alpha) group, representing 50% of guests.
Recommendations for Hosts
- Target domestic marketing efforts towards travelers from São Paulo and Rio de Janeiro.
- Tailor amenities and listing descriptions to appeal to the dominant Post-2000s (Gen Z/Alpha) demographic (e.g., highlight fast WiFi, smart home features, local guides).
- Highlight unique local experiences or amenities relevant to the primary guest profile.
- Consider seasonal promotions aligned with peak travel times for key origin markets.
Nearby Short-Term Rental Market Comparison
How does the Itanhandu Airbnb market stack up against its neighbors? Compare key performance metrics like average monthly revenue, ADR, and occupancy rates in surrounding areas to understand the broader regional STR landscape.
| Market | Active Properties | Monthly Revenue | Daily Rate | Avg. Occupancy |
|---|---|---|---|---|
| Ilha Grande | 11 | $1,783 | $166.42 | 38% |
| Areal | 82 | $1,532 | $198.25 | 30% |
| Queluz | 17 | $1,291 | $152.05 | 30% |
| Brazópolis | 21 | $1,209 | $152.11 | 29% |
| Santa Branca | 53 | $1,138 | $195.49 | 25% |
| Jambeiro | 22 | $1,135 | $185.50 | 24% |
| São Sebastião | 6,175 | $1,114 | $188.11 | 28% |
| Rio de Janeiro | 27,660 | $1,085 | $106.45 | 43% |
| Angra dos Reis | 2,446 | $1,017 | $158.25 | 33% |
| Paraisópolis | 104 | $1,004 | $108.16 | 32% |