Ituiutaba Airbnb Market Analysis 2026: Short Term Rental Data & Vacation Rental Statistics in Minas Gerais, Brazil
Is Airbnb profitable in Ituiutaba in 2026? Explore comprehensive Airbnb analytics for Ituiutaba, Minas Gerais, Brazil to uncover income potential. This 2026 STR market report for Ituiutaba, based on AirROI data from February 2025 to January 2026, reveals key trends in the niche market of 19 active listings.
Whether you're considering an Airbnb investment in Ituiutaba, optimizing your existing vacation rental, or exploring rental arbitrage opportunities, understanding the Ituiutaba Airbnb data is crucial. Leveraging the low regulation environment is key to maximizing your short term rental income potential. Let's dive into the specifics.
Key Ituiutaba Airbnb Performance Metrics Overview
Monthly Airbnb Revenue Variations & Income Potential in Ituiutaba (2026)
Understanding the monthly revenue variations for Airbnb listings in Ituiutaba is key to maximizing your short term rental income potential. Seasonality significantly impacts earnings. Our analysis, based on data from the past 12 months, shows that the peak revenue month for STRs in Ituiutaba is typically March, while January often presents the lowest earnings, highlighting opportunities for strategic pricing adjustments during shoulder and low seasons. Explore the typical Airbnb income in Ituiutaba across different performance tiers:
- Best-in-class properties (Top 10%) achieve $668+ monthly, often utilizing dynamic pricing and superior guest experiences.
- Strong performing properties (Top 25%) earn $475 or more, indicating effective management and desirable locations/amenities.
- Typical properties (Median) generate around $332 per month, representing the average market performance.
- Entry-level properties (Bottom 25%) see earnings around $174, often with potential for optimization.
Average Monthly Airbnb Earnings Trend in Ituiutaba
Ituiutaba Airbnb Occupancy Rate Trends (2026)
Maximize your bookings by understanding the Ituiutaba STR occupancy trends. Seasonal demand shifts significantly influence how often properties are booked. Typically, Februarysees the highest demand (peak season occupancy), while January experiences the lowest (low season). Effective strategies, like adjusting minimum stays or offering promotions, can boost occupancy during slower periods. Here's how different property tiers perform in Ituiutaba:
- Best-in-class properties (Top 10%) achieve 70%+ occupancy, indicating high desirability and potentially optimized availability.
- Strong performing properties (Top 25%) maintain 52% or higher occupancy, suggesting good market fit and guest satisfaction.
- Typical properties (Median) have an occupancy rate around 37%.
- Entry-level properties (Bottom 25%) average 21% occupancy, potentially facing higher vacancy.
Average Monthly Occupancy Rate Trend in Ituiutaba
Average Daily Rate (ADR) Airbnb Trends in Ituiutaba (2026)
Effective short term rental pricing strategy in Ituiutaba involves understanding monthly ADR fluctuations. The Average Daily Rate (ADR) for Airbnb in Ituiutaba typically peaks in October and dips lowest during February. Leveraging Airbnb dynamic pricing tools or strategies based on this seasonality can significantly boost revenue. Here's a look at the typical nightly rates achieved:
- Best-in-class properties (Top 10%) command rates of $47+ per night, often due to premium features or locations.
- Strong performing properties (Top 25%) achieve nightly rates of $39 or more.
- Typical properties (Median) charge around $26 per night.
- Entry-level properties (Bottom 25%) earn around $14 per night.
Average Daily Rate (ADR) Trend by Month in Ituiutaba
Get Live Ituiutaba Market Intelligence 👇

Explore Real-time Analytics
Airbnb Seasonality Analysis & Trends in Ituiutaba (2026)
Peak Season (March, July, February)
- Revenue averages $490 per month
- Occupancy rates average 54.2%
- Daily rates average $27
Shoulder Season
- Revenue averages $350 per month
- Occupancy maintains around 36.1%
- Daily rates hold near $31
Low Season (January, April, May)
- Revenue drops to average $222 per month
- Occupancy decreases to average 27.9%
- Daily rates adjust to average $29
Seasonality Insights for Ituiutaba
- The Airbnb seasonality in Ituiutaba shows highly seasonal trends requiring careful strategy. While the sections above show seasonal averages, it's also insightful to look at the extremes:
- During the high season, the absolute peak month showcases Ituiutaba's highest earning potential, with monthly revenues capable of climbing to $547, occupancy reaching a high of 56.6%, and ADRs peaking at $33.
- Conversely, the slowest single month of the year, typically falling within the low season, marks the market's lowest point. In this month, revenue might dip to $171, occupancy could drop to 18.1%, and ADRs may adjust down to $26.
- Understanding both the seasonal averages and these monthly peaks and troughs in revenue, occupancy, and ADR is crucial for maximizing your Airbnb profit potential in Ituiutaba.
Seasonal Strategies for Maximizing Profit
- Peak Season: Maximize revenue through premium pricing and potentially longer minimum stays. Ensure high availability.
- Low Season: Offer competitive pricing, special promotions (e.g., extended stay discounts), and flexible cancellation policies. Target off-season travelers like remote workers or budget-conscious guests.
- Shoulder Seasons: Implement dynamic pricing that balances peak and low rates. Target weekend travelers or specific events. Offer slightly more flexible terms than peak season.
- Regularly analyze your own performance against these Ituiutaba seasonality benchmarks and adjust your pricing and availability strategy accordingly.
Best Areas for Airbnb Investment in Ituiutaba (2026)
Exploring the top neighborhoods for short-term rentals in Ituiutaba? This section highlights key areas, outlining why they are attractive for hosts and guests, along with notable local attractions. Consider these locations based on your target guest profile and investment strategy.
| Neighborhood / Area | Why Host Here? (Target Guests & Appeal) | Key Attractions & Landmarks |
|---|---|---|
| Centro | The central area of Ituiutaba, offering a range of services, shops, and restaurants. It is a hub for commerce and local events, making it a prime location for both business and leisure travelers. | Municipal Market, Ituiutaba Cultural Center, Historic Church of Our Lady of the Conception, local shops and cafes |
| Jardim das Oliveiras | A residential neighborhood known for its tranquility and parks. Ideal for families and travelers seeking a peaceful stay with access to local amenities. | Jardim das Oliveiras Park, local bakeries and restaurants, calm residential streets |
| Parque das Laranjeiras | A popular area with parks and greenery, suitable for outdoor activities. Attracts families and nature lovers looking for a leisurely experience. | Laranjeiras Park, local walking trails, playgrounds for children |
| Vila Santa Maria | A local neighborhood with a friendly atmosphere, offering a glimpse into daily life in Ituiutaba. Great for those looking to experience the local culture. | local markets, community events, traditional restaurants |
| São Benedito | An upcoming area that is gaining popularity for its affordability and local charm. It is a great choice for budget-conscious travelers who want a local experience. | local shops, affordable dining options, community festivals |
| Eco Parque Ituiutaba | A nature park that offers outdoor recreational activities and is a great spot for family outings. Attracts visitors looking for adventure and nature. | eco-friendly trails, picnic areas, wildlife observation |
| Vila Industrial | An area known for its industrial heritage, now becoming a trendy location for younger travelers and entrepreneurs looking for a unique stay. | local artisan shops, quirky cafes, street art, entrepreneurial workshops |
| Conjunto Habitacional Grécia | A developing neighborhood with new amenities and infrastructure, suitable for long-term stays for those working in the area. | new shopping centers, emerging culinary scene, youth sports activities |
Understanding Airbnb License Requirements & STR Laws in Ituiutaba (2026)
While Ituiutaba, Minas Gerais, Brazil currently shows low STR regulations, specific Airbnb license requirements might still exist or change. Always verify the latest short term rental regulations and Airbnb license requirements directly with local government authorities for Ituiutaba to ensure full compliance before hosting.
(Source: AirROI data, 2026, finding no licensed listings among those analyzed)
Top Performing Airbnb Properties in Ituiutaba (2026)
Benchmark your potential! Explore examples of top-performing Airbnb properties in Ituiutababased on Trailing Twelve Month (TTM) revenue. Analyze their characteristics, revenue, occupancy rate, and ADR to understand what drives success in this market.
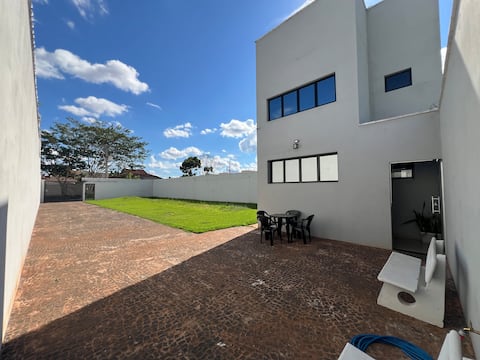
New property, near UEMG, with air-conditioning
Entire Place • 2 bedrooms

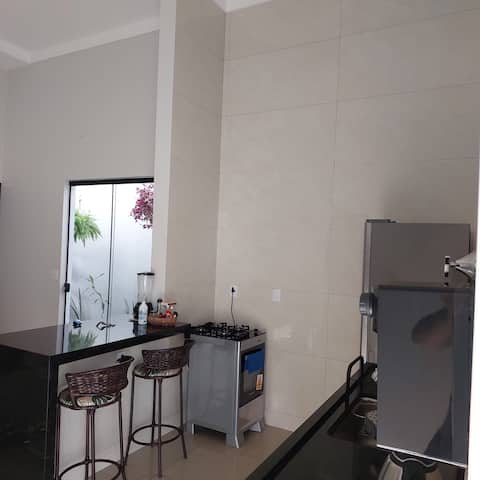
Comfortable house with barbecue and fast Wi-Fi.
Entire Place • 2 bedrooms

100% air-conditioned - Don't get hot!
Entire Place • 3 bedrooms

House in the city of Ituiutaba/MG
Entire Place • 3 bedrooms
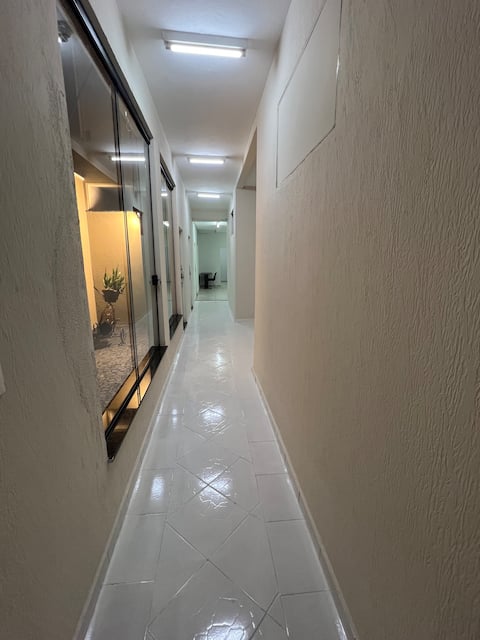
Property near UEMG, with air-conditioning
Entire Place • 4 bedrooms
University Neighborhood. Next to UEMG and Facmais
Entire Place • 1 bedroom
Note: Performance varies based on location, size, amenities, seasonality, and management quality. Data reflects the past 12 months.
Top Performing Airbnb Hosts in Ituiutaba (2026)
Learn from the best! This table showcases top-performing Airbnb hosts in Ituiutaba based on the number of properties managed and estimated total revenue over the past year. Analyze their scale and performance metrics.
| Host Name | Properties | Grossing Revenue | Stay Reviews | Avg Rating |
|---|---|---|---|---|
| Aranisio | 3 | $9,223 | 54 | 4.98/5.0 |
| Lucas Anovar | 7 | $6,482 | 55 | 4.86/5.0 |
| Carolina | 1 | $6,470 | 19 | 5.00/5.0 |
| Mayara | 1 | $5,824 | 48 | 4.98/5.0 |
| Leandro | 1 | $4,879 | 33 | 4.94/5.0 |
| Raimundo | 1 | $3,402 | 4 | 5.00/5.0 |
| Fernando | 1 | $2,801 | 51 | 4.98/5.0 |
| Drausio | 1 | $2,693 | 3 | 5.00/5.0 |
| Amanda | 2 | $1,825 | 4 | 3.33/5.0 |
| Maria | 1 | $888 | 4 | 4.50/5.0 |
Analyzing the strategies of top hosts, such as their property selection, pricing, and guest communication, can offer valuable lessons for optimizing your own Airbnb operations in Ituiutaba.
Dive Deeper: Advanced Ituiutaba STR Market Data (2026)
Ready to unlock more insights? AirROI provides access to advanced metrics and comprehensive Airbnb data for Ituiutaba. Explore detailed analytics beyond this report to refine your investment strategy, optimize pricing, and maximize your vacation rental profits.
Explore Advanced MetricsItuiutaba Short-Term Rental Market Composition (2026): Property & Room Types
Room Type Distribution
Property Type Distribution
Market Composition Insights for Ituiutaba
- The Ituiutaba Airbnb market composition is heavily skewed towards Entire Home/Apt listings, which make up 89.5% of the 19 active rentals. This indicates strong guest preference for privacy and space.
- Looking at the property type distribution in Ituiutaba, House properties are the most common (68.4%), reflecting the local real estate landscape.
- Houses represent a significant 68.4% portion, catering likely to families or larger groups.
- The presence of 10.5% Hotel/Boutique listings indicates integration with traditional hospitality.
Ituiutaba Airbnb Room Capacity Analysis (2026): Bedroom Distribution
Distribution of Listings by Number of Bedrooms
Room Capacity Insights for Ituiutaba
- The dominant room capacity in Ituiutaba is 2 bedrooms listings, making up 31.6% of the market. This suggests a strong demand for properties suitable for couples or solo travelers.
- Together, 2 bedrooms and 1 bedroom properties represent 63.2% of the active Airbnb listings in Ituiutaba, indicating a high concentration in these sizes.
- A significant 36.9% of listings offer 3+ bedrooms, catering to larger groups and families seeking more space in Ituiutaba.
Ituiutaba Vacation Rental Guest Capacity Trends (2026)
Distribution of Listings by Guest Capacity
Guest Capacity Insights for Ituiutaba
- The most common guest capacity trend in Ituiutaba vacation rentals is listings accommodating 3 guests (26.3%). This suggests the primary traveler segment is likely small families or groups.
- Properties designed for 3 guests and 8+ guests dominate the Ituiutaba STR market, accounting for 47.4% of listings.
- 36.9% of properties accommodate 6+ guests, serving the market segment for larger families or group travel in Ituiutaba.
- On average, properties in Ituiutaba are equipped to host 4.6 guests.
Ituiutaba Airbnb Booking Patterns (2026): Available vs. Booked Days
Available Days Distribution
Booked Days Distribution
Booking Pattern Insights for Ituiutaba
- The most common availability pattern in Ituiutaba falls within the 271-366 days range, representing 57.9% of listings. This suggests many properties have significant open periods on their calendars.
- Approximately 89.5% of listings show high availability (181+ days open annually), indicating potential for increased bookings or specific owner usage patterns.
- For booked days, the 91-180 days range is most frequent in Ituiutaba (36.8%), reflecting common guest stay durations or potential owner blocking patterns.
- A notable 10.5% of properties secure long booking periods (181+ days booked per year), highlighting successful long-term rental strategies or significant owner usage.
Ituiutaba Airbnb Minimum Stay Requirements Analysis
Distribution of Listings by Minimum Night Requirement
1 Night
4 listings
21.1% of total
2 Nights
2 listings
10.5% of total
4-6 Nights
1 listings
5.3% of total
30+ Nights
12 listings
63.2% of total
Key Insights
- The most prevalent minimum stay requirement in Ituiutaba is 30+ Nights, adopted by 63.2% of listings. This highlights the market's preference for longer commitments.
- A significant segment (63.2%) caters to monthly stays (30+ nights) in Ituiutaba, pointing to opportunities in the extended-stay market.
Recommendations
- Align with the market by considering a 30+ Nights minimum stay, as 63.2% of Ituiutaba hosts use this setting.
- If feasible, allowing 1-night stays, especially midweek or during low season, could capture last-minute bookings, as only 21.1% currently do.
- Explore offering discounts for stays of 30+ nights to attract the 63.2% of the market seeking extended stays.
- Adjust minimum nights based on seasonality – potentially shorter during low season and longer during peak demand periods in Ituiutaba.
Ituiutaba Airbnb Cancellation Policy Trends Analysis (2026)
Limited
1 listings
5.3% of total
Flexible
3 listings
15.8% of total
Moderate
12 listings
63.2% of total
Firm
3 listings
15.8% of total
Cancellation Policy Insights for Ituiutaba
- The prevailing Airbnb cancellation policy trend in Ituiutaba is Moderate, used by 63.2% of listings.
- The market strongly favors guest-friendly terms, with 79.0% of listings offering Flexible or Moderate policies. This suggests guests in Ituiutaba may expect booking flexibility.
Recommendations for Hosts
- Consider adopting a Moderate policy to align with the 63.2% market standard in Ituiutaba.
- Regularly review your cancellation policy against competitors and market demand shifts in Ituiutaba.
Ituiutaba STR Booking Lead Time Analysis (2026)
Average Booking Lead Time by Month
Booking Lead Time Insights for Ituiutaba
- The overall average booking lead time for vacation rentals in Ituiutaba is 15 days.
- Guests book furthest in advance for stays during March (average 47 days), likely coinciding with peak travel demand or local events.
- The shortest booking windows occur for stays in May (average 3 days), indicating more last-minute travel plans during this time.
- Seasonally, Winter (22 days avg.) sees the longest lead times, while Summer (8 days avg.) has the shortest, reflecting typical travel planning cycles.
Recommendations for Hosts
- Use the overall average lead time (15 days) as a baseline for your pricing and availability strategy in Ituiutaba.
- For March stays, consider implementing length-of-stay discounts or slightly higher rates for bookings made less than 47 days out to capitalize on advance planning.
- During May, focus on last-minute booking availability and promotions, as guests book with very short notice (3 days avg.).
- Target marketing efforts for the Winter season well in advance (at least 22 days) to capture early planners.
- Monitor your own booking lead times against these Ituiutaba averages to identify opportunities for dynamic pricing adjustments.
Popular & Essential Airbnb Amenities in Ituiutaba (2026)
Amenity Prevalence
Amenity Insights for Ituiutaba
- Essential amenities in Ituiutaba that guests expect include: Kitchen. Lacking these (this) could significantly impact bookings.
- Popular amenities like Free parking on premises, TV, Wifi are common but not universal. Offering these can provide a competitive edge.
- Warning: Wifi is not universally provided but is considered essential globally. Ensure reliable Wifi is offered.
Recommendations for Hosts
- Ensure your listing includes all essential amenities for Ituiutaba: Kitchen.
- Consider adding popular differentiators like Free parking on premises or TV to increase appeal.
- Highlight unique or less common amenities you offer (e.g., hot tub, dedicated workspace, EV charger) in your listing description and photos.
- Regularly check competitor amenities in Ituiutaba to stay competitive.
Ituiutaba Airbnb Guest Demographics & Profile Analysis (2026)
Guest Profile Summary for Ituiutaba
- The typical guest profile for Airbnb in Ituiutaba consists of primarily domestic travelers (98%), often arriving from nearby Uberlândia, typically belonging to the Post-2000s (Gen Z/Alpha) group (50%), primarily speaking Portuguese or English.
- Domestic travelers account for 97.8% of guests.
- Key international markets include Brazil (97.8%) and United States (2.2%).
- Top languages spoken are Portuguese (63.3%) followed by English (26.7%).
- A significant demographic segment is the Post-2000s (Gen Z/Alpha) group, representing 50% of guests.
Recommendations for Hosts
- Target domestic marketing efforts towards travelers from Uberlândia and São Paulo.
- Tailor amenities and listing descriptions to appeal to the dominant Post-2000s (Gen Z/Alpha) demographic (e.g., highlight fast WiFi, smart home features, local guides).
- Highlight unique local experiences or amenities relevant to the primary guest profile.
- Consider seasonal promotions aligned with peak travel times for key origin markets.
Nearby Short-Term Rental Market Comparison
How does the Ituiutaba Airbnb market stack up against its neighbors? Compare key performance metrics like average monthly revenue, ADR, and occupancy rates in surrounding areas to understand the broader regional STR landscape.
| Market | Active Properties | Monthly Revenue | Daily Rate | Avg. Occupancy |
|---|---|---|---|---|
| Rio Quente | 395 | $449 | $62.90 | 29% |
| Caldas Novas | 2,732 | $432 | $65.63 | 32% |
| Uberlândia | 765 | $267 | $35.81 | 38% |
| Rio Verde | 135 | $246 | $65.82 | 28% |
| Araguari | 25 | $193 | $24.66 | 40% |