Lambari Airbnb Market Analysis 2026: Short Term Rental Data & Vacation Rental Statistics in Minas Gerais, Brazil
Is Airbnb profitable in Lambari in 2026? Explore comprehensive Airbnb analytics for Lambari, Minas Gerais, Brazil to uncover income potential. This 2026 STR market report for Lambari, based on AirROI data from February 2025 to January 2026, reveals key trends in the niche market of 20 active listings.
Whether you're considering an Airbnb investment in Lambari, optimizing your existing vacation rental, or exploring rental arbitrage opportunities, understanding the Lambari Airbnb data is crucial. Leveraging the low regulation environment is key to maximizing your short term rental income potential. Let's dive into the specifics.
Key Lambari Airbnb Performance Metrics Overview
Monthly Airbnb Revenue Variations & Income Potential in Lambari (2026)
Understanding the monthly revenue variations for Airbnb listings in Lambari is key to maximizing your short term rental income potential. Seasonality significantly impacts earnings. Our analysis, based on data from the past 12 months, shows that the peak revenue month for STRs in Lambari is typically March, while November often presents the lowest earnings, highlighting opportunities for strategic pricing adjustments during shoulder and low seasons. Explore the typical Airbnb income in Lambari across different performance tiers:
- Best-in-class properties (Top 10%) achieve $775+ monthly, often utilizing dynamic pricing and superior guest experiences.
- Strong performing properties (Top 25%) earn $366 or more, indicating effective management and desirable locations/amenities.
- Typical properties (Median) generate around $180 per month, representing the average market performance.
- Entry-level properties (Bottom 25%) see earnings around $86, often with potential for optimization.
Average Monthly Airbnb Earnings Trend in Lambari
Lambari Airbnb Occupancy Rate Trends (2026)
Maximize your bookings by understanding the Lambari STR occupancy trends. Seasonal demand shifts significantly influence how often properties are booked. Typically, Marchsees the highest demand (peak season occupancy), while October experiences the lowest (low season). Effective strategies, like adjusting minimum stays or offering promotions, can boost occupancy during slower periods. Here's how different property tiers perform in Lambari:
- Best-in-class properties (Top 10%) achieve 47%+ occupancy, indicating high desirability and potentially optimized availability.
- Strong performing properties (Top 25%) maintain 30% or higher occupancy, suggesting good market fit and guest satisfaction.
- Typical properties (Median) have an occupancy rate around 15%.
- Entry-level properties (Bottom 25%) average 7% occupancy, potentially facing higher vacancy.
Average Monthly Occupancy Rate Trend in Lambari
Average Daily Rate (ADR) Airbnb Trends in Lambari (2026)
Effective short term rental pricing strategy in Lambari involves understanding monthly ADR fluctuations. The Average Daily Rate (ADR) for Airbnb in Lambari typically peaks in December and dips lowest during February. Leveraging Airbnb dynamic pricing tools or strategies based on this seasonality can significantly boost revenue. Here's a look at the typical nightly rates achieved:
- Best-in-class properties (Top 10%) command rates of $80+ per night, often due to premium features or locations.
- Strong performing properties (Top 25%) achieve nightly rates of $47 or more.
- Typical properties (Median) charge around $33 per night.
- Entry-level properties (Bottom 25%) earn around $27 per night.
Average Daily Rate (ADR) Trend by Month in Lambari
Get Live Lambari Market Intelligence 👇

Explore Real-time Analytics
Airbnb Seasonality Analysis & Trends in Lambari (2026)
Peak Season (March, December, April)
- Revenue averages $394 per month
- Occupancy rates average 27.2%
- Daily rates average $45
Shoulder Season
- Revenue averages $312 per month
- Occupancy maintains around 20.5%
- Daily rates hold near $45
Low Season (May, September, November)
- Revenue drops to average $219 per month
- Occupancy decreases to average 17.4%
- Daily rates adjust to average $47
Seasonality Insights for Lambari
- The Airbnb seasonality in Lambari shows moderate seasonality with distinct peak and low periods. While the sections above show seasonal averages, it's also insightful to look at the extremes:
- During the high season, the absolute peak month showcases Lambari's highest earning potential, with monthly revenues capable of climbing to $415, occupancy reaching a high of 32.3%, and ADRs peaking at $50.
- Conversely, the slowest single month of the year, typically falling within the low season, marks the market's lowest point. In this month, revenue might dip to $208, occupancy could drop to 16.1%, and ADRs may adjust down to $39.
- Understanding both the seasonal averages and these monthly peaks and troughs in revenue, occupancy, and ADR is crucial for maximizing your Airbnb profit potential in Lambari.
Seasonal Strategies for Maximizing Profit
- Peak Season: Maximize revenue through premium pricing and potentially longer minimum stays. Ensure high availability.
- Low Season: Offer competitive pricing, special promotions (e.g., extended stay discounts), and flexible cancellation policies. Target off-season travelers like remote workers or budget-conscious guests.
- Shoulder Seasons: Implement dynamic pricing that balances peak and low rates. Target weekend travelers or specific events. Offer slightly more flexible terms than peak season.
- Regularly analyze your own performance against these Lambari seasonality benchmarks and adjust your pricing and availability strategy accordingly.
Best Areas for Airbnb Investment in Lambari (2026)
Exploring the top neighborhoods for short-term rentals in Lambari? This section highlights key areas, outlining why they are attractive for hosts and guests, along with notable local attractions. Consider these locations based on your target guest profile and investment strategy.
| Neighborhood / Area | Why Host Here? (Target Guests & Appeal) | Key Attractions & Landmarks |
|---|---|---|
| Centro de Lambari | Historical center known for its charming architecture and local culture. Ideal for tourists interested in history and local experiences, with easy access to shops and restaurants. | Lambari Centro Cultural, Igreja Matriz de São Sebastião, Praça Dona Açu, Lago de Lambari |
| Estância Hidromineral | Famous for its mineral water springs and wellness spas, attracting health-conscious travelers and those seeking relaxation. | Termas de Lambari, Parque das Águas, SPA Lambari, Lago de Lambari |
| Praia Artificial de Lambari | Popular spot for leisure and relaxation, ideal for families and groups looking for fun outdoor activities. | Praia Artificial, Ponte do Lago, quiosques, passeios de pedalinho |
| Área de Preservação Ambiental - APA | Rich in natural beauty, perfect for eco-tourism and nature lovers. Offers hiking trails and scenic spots. | Caminhadas na Natureza, Mirante do Cristo, vegetação nativa, fauna local |
| Bairros Recentes | Newer neighborhoods that offer modern amenities and appeal to young professionals and families, with access to parks and shopping. | Parque das Acácias, Shopping local, áreas de lazer, centros de convivência |
| Região do Lago | Scenic lakeside area that provides recreational opportunities and beautiful views, perfect for outdoor enthusiasts. | Lago de Lambari, Pôr do Sol no Lago, pesca, passeios de barco |
| Praça das Flores | A vibrant community gathering place known for its flowers and markets, ideal for tourists looking to experience local life. | Feiras de artesanato, eventos culturais, jardins, cafés locais |
| Colônia de Férias | A vacation colony that attracts families and groups looking for a fun getaway, with recreational activities and spacious accommodations. | chalés, áreas de recreação, atividades aquáticas, piscinas |
Understanding Airbnb License Requirements & STR Laws in Lambari (2026)
While Lambari, Minas Gerais, Brazil currently shows low STR regulations, specific Airbnb license requirements might still exist or change. Always verify the latest short term rental regulations and Airbnb license requirements directly with local government authorities for Lambari to ensure full compliance before hosting.
(Source: AirROI data, 2026, finding no licensed listings among those analyzed)
Top Performing Airbnb Properties in Lambari (2026)
Benchmark your potential! Explore examples of top-performing Airbnb properties in Lambaribased on Trailing Twelve Month (TTM) revenue. Analyze their characteristics, revenue, occupancy rate, and ADR to understand what drives success in this market.

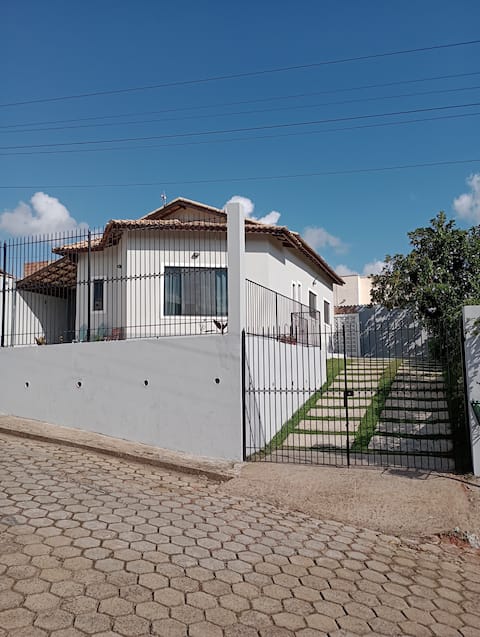
Beautiful and spacious house in a gated community
Entire Place • 4 bedrooms

Serra dos Lobos Ranch
Entire Place • 3 bedrooms
Cozy by the Waters
Entire Place • 2 bedrooms
Cozy apartment in a charming condominium.
Entire Place • 2 bedrooms

Cozy place next to nature and the city
Entire Place • 2 bedrooms

Studio apartment with beautiful lake view.
Entire Place • 1 bedroom
Note: Performance varies based on location, size, amenities, seasonality, and management quality. Data reflects the past 12 months.
Top Performing Airbnb Hosts in Lambari (2026)
Learn from the best! This table showcases top-performing Airbnb hosts in Lambari based on the number of properties managed and estimated total revenue over the past year. Analyze their scale and performance metrics.
| Host Name | Properties | Grossing Revenue | Stay Reviews | Avg Rating |
|---|---|---|---|---|
| Ana Cristina | 1 | $8,793 | 62 | 4.94/5.0 |
| Patricia | 1 | $8,649 | 11 | 4.91/5.0 |
| Suely | 1 | $8,528 | 42 | 5.00/5.0 |
| Ana Paula | 1 | $5,126 | 19 | 5.00/5.0 |
| Adriano | 2 | $3,723 | 64 | 4.98/5.0 |
| Maria Leise | 1 | $3,404 | 61 | 4.98/5.0 |
| Fernando | 1 | $2,669 | 38 | 4.97/5.0 |
| Iasmin | 2 | $2,223 | 30 | 4.84/5.0 |
| Iago | 1 | $2,116 | 17 | 4.76/5.0 |
| Elvira Franco | 1 | $1,474 | 2 | Not Rated |
Analyzing the strategies of top hosts, such as their property selection, pricing, and guest communication, can offer valuable lessons for optimizing your own Airbnb operations in Lambari.
Dive Deeper: Advanced Lambari STR Market Data (2026)
Ready to unlock more insights? AirROI provides access to advanced metrics and comprehensive Airbnb data for Lambari. Explore detailed analytics beyond this report to refine your investment strategy, optimize pricing, and maximize your vacation rental profits.
Explore Advanced MetricsLambari Short-Term Rental Market Composition (2026): Property & Room Types
Room Type Distribution
Property Type Distribution
Market Composition Insights for Lambari
- The Lambari Airbnb market composition is heavily skewed towards Entire Home/Apt listings, which make up 85% of the 20 active rentals. This indicates strong guest preference for privacy and space.
- Looking at the property type distribution in Lambari, Apartment/Condo properties are the most common (50%), reflecting the local real estate landscape.
- Houses represent a significant 35% portion, catering likely to families or larger groups.
- The presence of 15% Hotel/Boutique listings indicates integration with traditional hospitality.
Lambari Airbnb Room Capacity Analysis (2026): Bedroom Distribution
Distribution of Listings by Number of Bedrooms
Room Capacity Insights for Lambari
- The dominant room capacity in Lambari is 2 bedrooms listings, making up 45% of the market. This suggests a strong demand for properties suitable for couples or solo travelers.
- Together, 2 bedrooms and 1 bedroom properties represent 75.0% of the active Airbnb listings in Lambari, indicating a high concentration in these sizes.
Lambari Vacation Rental Guest Capacity Trends (2026)
Distribution of Listings by Guest Capacity
Guest Capacity Insights for Lambari
- The most common guest capacity trend in Lambari vacation rentals is listings accommodating 8+ guests (20%). This suggests the primary traveler segment is likely larger groups.
- Properties designed for 8+ guests and 6 guests dominate the Lambari STR market, accounting for 40.0% of listings.
- 40.0% of properties accommodate 6+ guests, serving the market segment for larger families or group travel in Lambari.
- On average, properties in Lambari are equipped to host 4.5 guests.
Lambari Airbnb Booking Patterns (2026): Available vs. Booked Days
Available Days Distribution
Booked Days Distribution
Booking Pattern Insights for Lambari
- The most common availability pattern in Lambari falls within the 271-366 days range, representing 85% of listings. This suggests many properties have significant open periods on their calendars.
- Approximately 95.0% of listings show high availability (181+ days open annually), indicating potential for increased bookings or specific owner usage patterns.
- For booked days, the 1-30 days range is most frequent in Lambari (50%), reflecting common guest stay durations or potential owner blocking patterns.
- A notable 5.0% of properties secure long booking periods (181+ days booked per year), highlighting successful long-term rental strategies or significant owner usage.
Lambari Airbnb Minimum Stay Requirements Analysis
Distribution of Listings by Minimum Night Requirement
1 Night
10 listings
50% of total
2 Nights
8 listings
40% of total
30+ Nights
2 listings
10% of total
Key Insights
- The most prevalent minimum stay requirement in Lambari is 1 Night, adopted by 50% of listings. This highlights the market's preference for shorter, flexible bookings.
- A strong majority (90.0%) of the Lambari Airbnb data shows acceptance of very short stays (1-2 nights), indicating a dynamic, high-turnover market.
Recommendations
- Align with the market by considering a 1 Night minimum stay, as 50% of Lambari hosts use this setting.
- Explore offering discounts for stays of 30+ nights to attract the 10% of the market seeking extended stays.
- Adjust minimum nights based on seasonality – potentially shorter during low season and longer during peak demand periods in Lambari.
Lambari Airbnb Cancellation Policy Trends Analysis (2026)
Flexible
6 listings
30% of total
Moderate
8 listings
40% of total
Firm
6 listings
30% of total
Cancellation Policy Insights for Lambari
- The prevailing Airbnb cancellation policy trend in Lambari is Moderate, used by 40% of listings.
- There's a relatively balanced mix between guest-friendly (70.0%) and stricter (30.0%) policies, offering choices for different guest needs.
Recommendations for Hosts
- Consider adopting a Moderate policy to align with the 40% market standard in Lambari.
- Regularly review your cancellation policy against competitors and market demand shifts in Lambari.
Lambari STR Booking Lead Time Analysis (2026)
Average Booking Lead Time by Month
Booking Lead Time Insights for Lambari
- The overall average booking lead time for vacation rentals in Lambari is 21 days.
- Guests book furthest in advance for stays during May (average 30 days), likely coinciding with peak travel demand or local events.
- The shortest booking windows occur for stays in September (average 6 days), indicating more last-minute travel plans during this time.
- Seasonally, Spring (23 days avg.) sees the longest lead times, while Summer (13 days avg.) has the shortest, reflecting typical travel planning cycles.
Recommendations for Hosts
- Use the overall average lead time (21 days) as a baseline for your pricing and availability strategy in Lambari.
- During September, focus on last-minute booking availability and promotions, as guests book with very short notice (6 days avg.).
- Target marketing efforts for the Spring season well in advance (at least 23 days) to capture early planners.
- Monitor your own booking lead times against these Lambari averages to identify opportunities for dynamic pricing adjustments.
Popular & Essential Airbnb Amenities in Lambari (2026)
Amenity Prevalence
Amenity Insights for Lambari
- Popular amenities like Kitchen, TV, Wifi are common but not universal. Offering these can provide a competitive edge.
- Warning: Wifi is not universally provided but is considered essential globally. Ensure reliable Wifi is offered.
Recommendations for Hosts
- Consider adding popular differentiators like Kitchen or TV to increase appeal.
- Highlight unique or less common amenities you offer (e.g., hot tub, dedicated workspace, EV charger) in your listing description and photos.
- Regularly check competitor amenities in Lambari to stay competitive.
Lambari Airbnb Guest Demographics & Profile Analysis (2026)
Guest Profile Summary for Lambari
- The typical guest profile for Airbnb in Lambari consists of primarily domestic travelers (100%), often arriving from nearby São Paulo, typically belonging to the Post-2000s (Gen Z/Alpha) group (50%), primarily speaking Portuguese or English.
- Domestic travelers account for 100.0% of guests.
- Top languages spoken are Portuguese (54.5%) followed by English (25%).
- A significant demographic segment is the Post-2000s (Gen Z/Alpha) group, representing 50% of guests.
Recommendations for Hosts
- Target domestic marketing efforts towards travelers from São Paulo and State of Minas Gerais.
- Tailor amenities and listing descriptions to appeal to the dominant Post-2000s (Gen Z/Alpha) demographic (e.g., highlight fast WiFi, smart home features, local guides).
- Highlight unique local experiences or amenities relevant to the primary guest profile.
- Consider seasonal promotions aligned with peak travel times for key origin markets.
Nearby Short-Term Rental Market Comparison
How does the Lambari Airbnb market stack up against its neighbors? Compare key performance metrics like average monthly revenue, ADR, and occupancy rates in surrounding areas to understand the broader regional STR landscape.
| Market | Active Properties | Monthly Revenue | Daily Rate | Avg. Occupancy |
|---|---|---|---|---|
| Tuiuti | 18 | $1,686 | $156.45 | 30% |
| Morungaba | 31 | $1,435 | $263.39 | 27% |
| Valinhos | 61 | $1,370 | $176.28 | 33% |
| Itatiba | 171 | $1,331 | $177.58 | 29% |
| Vargem | 48 | $1,319 | $190.42 | 28% |
| Cássia | 28 | $1,293 | $132.97 | 34% |
| Queluz | 17 | $1,291 | $152.05 | 30% |
| Pedra Bela | 27 | $1,225 | $135.48 | 32% |
| Brazópolis | 21 | $1,209 | $152.11 | 29% |
| Paraisópolis | 104 | $1,004 | $108.16 | 32% |