Pedro Leopoldo Airbnb Market Analysis 2026: Short Term Rental Data & Vacation Rental Statistics in Minas Gerais, Brazil
Is Airbnb profitable in Pedro Leopoldo in 2026? Explore comprehensive Airbnb analytics for Pedro Leopoldo, Minas Gerais, Brazil to uncover income potential. This 2026 STR market report for Pedro Leopoldo, based on AirROI data from February 2025 to January 2026, reveals key trends in the niche market of 32 active listings.
Whether you're considering an Airbnb investment in Pedro Leopoldo, optimizing your existing vacation rental, or exploring rental arbitrage opportunities, understanding the Pedro Leopoldo Airbnb data is crucial. Leveraging the low regulation environment is key to maximizing your short term rental income potential. Let's dive into the specifics.
Key Pedro Leopoldo Airbnb Performance Metrics Overview
Monthly Airbnb Revenue Variations & Income Potential in Pedro Leopoldo (2026)
Understanding the monthly revenue variations for Airbnb listings in Pedro Leopoldo is key to maximizing your short term rental income potential. Seasonality significantly impacts earnings. Our analysis, based on data from the past 12 months, shows that the peak revenue month for STRs in Pedro Leopoldo is typically December, while July often presents the lowest earnings, highlighting opportunities for strategic pricing adjustments during shoulder and low seasons. Explore the typical Airbnb income in Pedro Leopoldo across different performance tiers:
- Best-in-class properties (Top 10%) achieve $2,168+ monthly, often utilizing dynamic pricing and superior guest experiences.
- Strong performing properties (Top 25%) earn $1,081 or more, indicating effective management and desirable locations/amenities.
- Typical properties (Median) generate around $441 per month, representing the average market performance.
- Entry-level properties (Bottom 25%) see earnings around $231, often with potential for optimization.
Average Monthly Airbnb Earnings Trend in Pedro Leopoldo
Pedro Leopoldo Airbnb Occupancy Rate Trends (2026)
Maximize your bookings by understanding the Pedro Leopoldo STR occupancy trends. Seasonal demand shifts significantly influence how often properties are booked. Typically, Decembersees the highest demand (peak season occupancy), while October experiences the lowest (low season). Effective strategies, like adjusting minimum stays or offering promotions, can boost occupancy during slower periods. Here's how different property tiers perform in Pedro Leopoldo:
- Best-in-class properties (Top 10%) achieve 56%+ occupancy, indicating high desirability and potentially optimized availability.
- Strong performing properties (Top 25%) maintain 42% or higher occupancy, suggesting good market fit and guest satisfaction.
- Typical properties (Median) have an occupancy rate around 24%.
- Entry-level properties (Bottom 25%) average 12% occupancy, potentially facing higher vacancy.
Average Monthly Occupancy Rate Trend in Pedro Leopoldo
Average Daily Rate (ADR) Airbnb Trends in Pedro Leopoldo (2026)
Effective short term rental pricing strategy in Pedro Leopoldo involves understanding monthly ADR fluctuations. The Average Daily Rate (ADR) for Airbnb in Pedro Leopoldo typically peaks in December and dips lowest during April. Leveraging Airbnb dynamic pricing tools or strategies based on this seasonality can significantly boost revenue. Here's a look at the typical nightly rates achieved:
- Best-in-class properties (Top 10%) command rates of $221+ per night, often due to premium features or locations.
- Strong performing properties (Top 25%) achieve nightly rates of $140 or more.
- Typical properties (Median) charge around $78 per night.
- Entry-level properties (Bottom 25%) earn around $49 per night.
Average Daily Rate (ADR) Trend by Month in Pedro Leopoldo
Get Live Pedro Leopoldo Market Intelligence 👇

Explore Real-time Analytics
Airbnb Seasonality Analysis & Trends in Pedro Leopoldo (2026)
Peak Season (December, March, November)
- Revenue averages $1,231 per month
- Occupancy rates average 32.1%
- Daily rates average $105
Shoulder Season
- Revenue averages $830 per month
- Occupancy maintains around 27.7%
- Daily rates hold near $100
Low Season (June, July, August)
- Revenue drops to average $698 per month
- Occupancy decreases to average 24.8%
- Daily rates adjust to average $102
Seasonality Insights for Pedro Leopoldo
- The Airbnb seasonality in Pedro Leopoldo shows highly seasonal trends requiring careful strategy. While the sections above show seasonal averages, it's also insightful to look at the extremes:
- During the high season, the absolute peak month showcases Pedro Leopoldo's highest earning potential, with monthly revenues capable of climbing to $1,409, occupancy reaching a high of 35.4%, and ADRs peaking at $112.
- Conversely, the slowest single month of the year, typically falling within the low season, marks the market's lowest point. In this month, revenue might dip to $592, occupancy could drop to 22.6%, and ADRs may adjust down to $93.
- Understanding both the seasonal averages and these monthly peaks and troughs in revenue, occupancy, and ADR is crucial for maximizing your Airbnb profit potential in Pedro Leopoldo.
Seasonal Strategies for Maximizing Profit
- Peak Season: Maximize revenue through premium pricing and potentially longer minimum stays. Ensure high availability.
- Low Season: Offer competitive pricing, special promotions (e.g., extended stay discounts), and flexible cancellation policies. Target off-season travelers like remote workers or budget-conscious guests.
- Shoulder Seasons: Implement dynamic pricing that balances peak and low rates. Target weekend travelers or specific events. Offer slightly more flexible terms than peak season.
- Regularly analyze your own performance against these Pedro Leopoldo seasonality benchmarks and adjust your pricing and availability strategy accordingly.
Best Areas for Airbnb Investment in Pedro Leopoldo (2026)
Exploring the top neighborhoods for short-term rentals in Pedro Leopoldo? This section highlights key areas, outlining why they are attractive for hosts and guests, along with notable local attractions. Consider these locations based on your target guest profile and investment strategy.
| Neighborhood / Area | Why Host Here? (Target Guests & Appeal) | Key Attractions & Landmarks |
|---|---|---|
| Centro | The heart of Pedro Leopoldo, bustling with activity including restaurants, shops, and access to public transport. Ideal for those wanting to experience local culture and convenience. | Igreja Matriz de São Sebastião, Praça da Igreja, Mercado Municipal, Café de la Musique, Parque Municipal |
| Vila Maria | A residential neighborhood known for its peaceful environment and family-friendly atmosphere. Suitable for longer stays and local experiences. | Praça da Vila Maria, Sítio do Picapau Amarelo, Cultura local, Centros comunitários |
| Jardim São José | A growing area with access to local markets and parks, great for families and longer vacations. | Parque Vale do Sereno, Centro de Lazer São José, Caminho do Bom Jesus |
| Bairro Boa Vista | Another residential area with a tranquil ambiance, providing easy access to local amenities and family-oriented activities. | Praça do Bairro Boa Vista, Parque Ecológico, Lazer e Recreação |
| Caucaia do Alto | A quieter locality that offers natural attractions and a break from the city hustle, perfect for nature lovers and families. | Cascata da Serra Azul, Trilhas ecológicas, Parques naturais |
| Bairro Cachoeirinha | Known for its close-knit community feel and access to scenic spots, it's a select location for genuine local experiences. | Cachoeira do bairro, Eventos comunitários, Feiras locais |
| Bairro Floresta | A pleasant, green neighborhood suited for those looking for serenity and local charm, increasing in popularity among short-term renters. | Praça da Floresta, Caminhadas, Vida silvestre |
| Localidade de São Miguel | A delightful rural area that attracts those looking for peace, fresh air, and a different pace of life, ideal for nature retreats. | Fazendas históricas, Trilhas na natureza, Artesanato local |
Understanding Airbnb License Requirements & STR Laws in Pedro Leopoldo (2026)
While Pedro Leopoldo, Minas Gerais, Brazil currently shows low STR regulations, specific Airbnb license requirements might still exist or change. Always verify the latest short term rental regulations and Airbnb license requirements directly with local government authorities for Pedro Leopoldo to ensure full compliance before hosting.
(Source: AirROI data, 2026, finding no licensed listings among those analyzed)
Top Performing Airbnb Properties in Pedro Leopoldo (2026)
Benchmark your potential! Explore examples of top-performing Airbnb properties in Pedro Leopoldobased on Trailing Twelve Month (TTM) revenue. Analyze their characteristics, revenue, occupancy rate, and ADR to understand what drives success in this market.
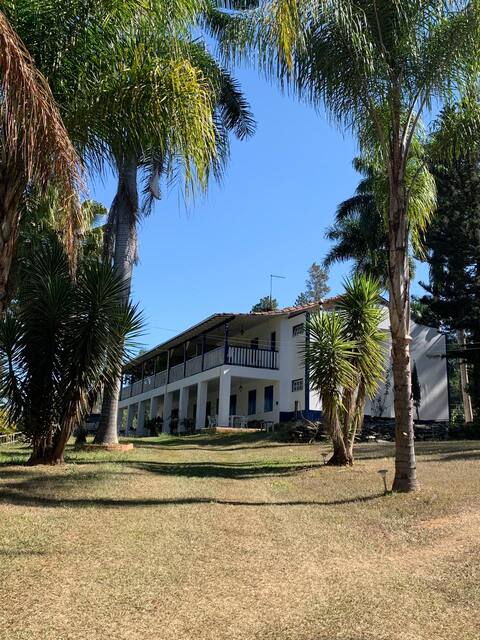
Beautiful Colonial Farmhouse with 8 Suites
Entire Place • 8 bedrooms

Pandora Ranch - Interior of Minas by Carpediem
Entire Place • 5 bedrooms
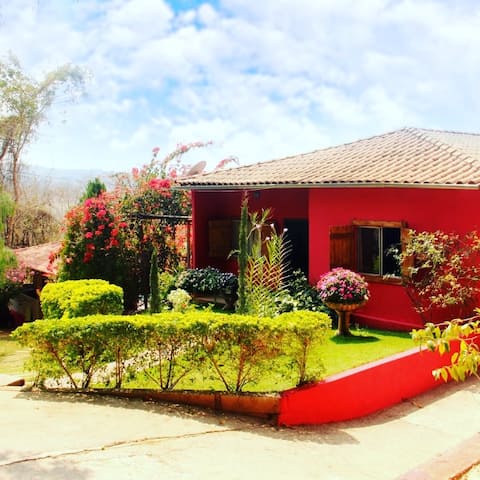
Rancho Fidalgo! Ecological park view!
Entire Place • 4 bedrooms
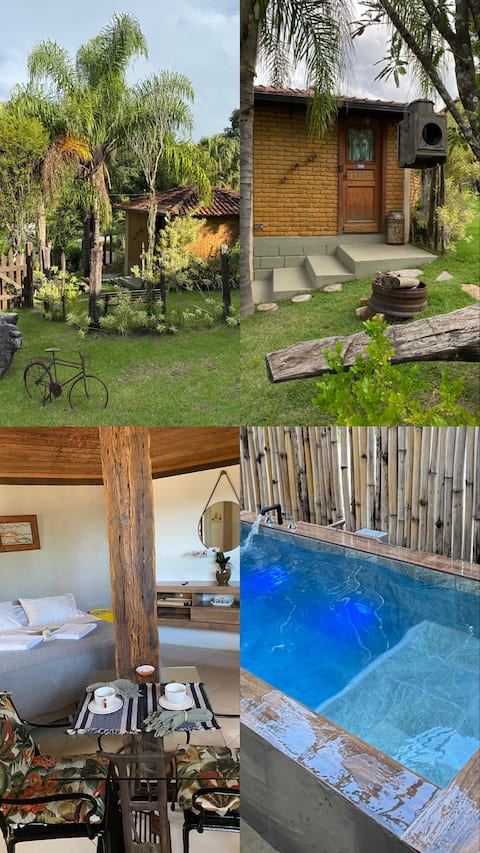
Guest barn
Entire Place • 1 bedroom
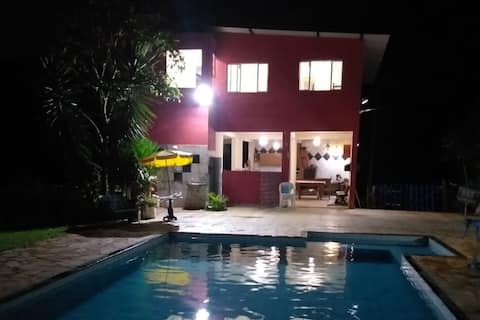
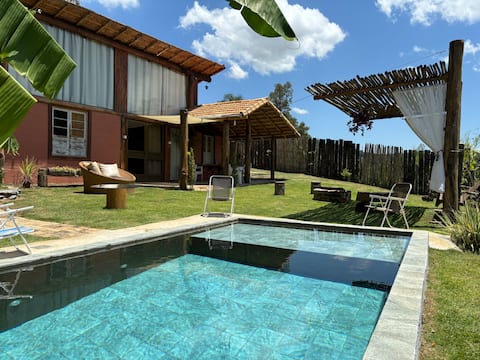
Heated, lighted pool and whirlpool.
Entire Place • 6 bedrooms
Guest House
Entire Place • 1 bedroom
Note: Performance varies based on location, size, amenities, seasonality, and management quality. Data reflects the past 12 months.
Top Performing Airbnb Hosts in Pedro Leopoldo (2026)
Learn from the best! This table showcases top-performing Airbnb hosts in Pedro Leopoldo based on the number of properties managed and estimated total revenue over the past year. Analyze their scale and performance metrics.
| Host Name | Properties | Grossing Revenue | Stay Reviews | Avg Rating |
|---|---|---|---|---|
| Eduardo | 1 | $59,214 | 24 | 4.83/5.0 |
| Gustavo Costa | 2 | $27,046 | 162 | 4.99/5.0 |
| Carpediem Homes | 1 | $23,657 | 83 | 4.90/5.0 |
| Dolores Toledo | 1 | $22,162 | 49 | 4.92/5.0 |
| Maria Helena | 1 | $9,565 | 48 | 4.58/5.0 |
| Cleuza Cunha | 1 | $9,018 | 19 | 4.95/5.0 |
| Guia Hospedar | 1 | $7,595 | 48 | 4.96/5.0 |
| Tatiana | 1 | $6,481 | 1 | Not Rated |
| Ronanzera | 1 | $5,316 | 7 | 4.71/5.0 |
| Bárbara | 1 | $4,200 | 4 | 4.75/5.0 |
Analyzing the strategies of top hosts, such as their property selection, pricing, and guest communication, can offer valuable lessons for optimizing your own Airbnb operations in Pedro Leopoldo.
Dive Deeper: Advanced Pedro Leopoldo STR Market Data (2026)
Ready to unlock more insights? AirROI provides access to advanced metrics and comprehensive Airbnb data for Pedro Leopoldo. Explore detailed analytics beyond this report to refine your investment strategy, optimize pricing, and maximize your vacation rental profits.
Explore Advanced MetricsPedro Leopoldo Short-Term Rental Market Composition (2026): Property & Room Types
Room Type Distribution
Property Type Distribution
Market Composition Insights for Pedro Leopoldo
- The Pedro Leopoldo Airbnb market composition is heavily skewed towards Entire Home/Apt listings, which make up 84.4% of the 32 active rentals. This indicates strong guest preference for privacy and space.
- Looking at the property type distribution in Pedro Leopoldo, House properties are the most common (59.4%), reflecting the local real estate landscape.
- Houses represent a significant 59.4% portion, catering likely to families or larger groups.
- The presence of 6.3% Hotel/Boutique listings indicates integration with traditional hospitality.
- Smaller segments like others, unique stays (combined 6.2%) offer potential for unique stay experiences.
Pedro Leopoldo Airbnb Room Capacity Analysis (2026): Bedroom Distribution
Distribution of Listings by Number of Bedrooms
Room Capacity Insights for Pedro Leopoldo
- The dominant room capacity in Pedro Leopoldo is 3 bedrooms listings, making up 31.3% of the market. This suggests a strong demand for properties suitable for families or small groups.
- Together, 3 bedrooms and 1 bedroom properties represent 50.1% of the active Airbnb listings in Pedro Leopoldo, indicating a high concentration in these sizes.
- A significant 59.4% of listings offer 3+ bedrooms, catering to larger groups and families seeking more space in Pedro Leopoldo.
Pedro Leopoldo Vacation Rental Guest Capacity Trends (2026)
Distribution of Listings by Guest Capacity
Guest Capacity Insights for Pedro Leopoldo
- The most common guest capacity trend in Pedro Leopoldo vacation rentals is listings accommodating 8+ guests (53.1%). This suggests the primary traveler segment is likely larger groups.
- Properties designed for 8+ guests and 5 guests dominate the Pedro Leopoldo STR market, accounting for 65.6% of listings.
- 59.3% of properties accommodate 6+ guests, serving the market segment for larger families or group travel in Pedro Leopoldo.
- On average, properties in Pedro Leopoldo are equipped to host 5.8 guests.
Pedro Leopoldo Airbnb Booking Patterns (2026): Available vs. Booked Days
Available Days Distribution
Booked Days Distribution
Booking Pattern Insights for Pedro Leopoldo
- The most common availability pattern in Pedro Leopoldo falls within the 271-366 days range, representing 78.1% of listings. This suggests many properties have significant open periods on their calendars.
- Approximately 100.0% of listings show high availability (181+ days open annually), indicating potential for increased bookings or specific owner usage patterns.
- For booked days, the 31-90 days range is most frequent in Pedro Leopoldo (40.6%), reflecting common guest stay durations or potential owner blocking patterns.
Pedro Leopoldo Airbnb Minimum Stay Requirements Analysis
Distribution of Listings by Minimum Night Requirement
1 Night
5 listings
15.6% of total
2 Nights
16 listings
50% of total
4-6 Nights
3 listings
9.4% of total
30+ Nights
8 listings
25% of total
Key Insights
- The most prevalent minimum stay requirement in Pedro Leopoldo is 2 Nights, adopted by 50% of listings. This highlights the market's preference for shorter, flexible bookings.
- A strong majority (65.6%) of the Pedro Leopoldo Airbnb data shows acceptance of very short stays (1-2 nights), indicating a dynamic, high-turnover market.
- A significant segment (25%) caters to monthly stays (30+ nights) in Pedro Leopoldo, pointing to opportunities in the extended-stay market.
Recommendations
- Align with the market by considering a 2 Nights minimum stay, as 50% of Pedro Leopoldo hosts use this setting.
- If feasible, allowing 1-night stays, especially midweek or during low season, could capture last-minute bookings, as only 15.6% currently do.
- A 2-night minimum appears standard (50%). Consider this for weekends or peak periods.
- Explore offering discounts for stays of 30+ nights to attract the 25% of the market seeking extended stays.
- Adjust minimum nights based on seasonality – potentially shorter during low season and longer during peak demand periods in Pedro Leopoldo.
Pedro Leopoldo Airbnb Cancellation Policy Trends Analysis (2026)
Flexible
7 listings
21.9% of total
Moderate
6 listings
18.8% of total
Firm
17 listings
53.1% of total
Strict
2 listings
6.3% of total
Cancellation Policy Insights for Pedro Leopoldo
- The prevailing Airbnb cancellation policy trend in Pedro Leopoldo is Firm, used by 53.1% of listings.
- A majority (59.4%) of hosts in Pedro Leopoldo utilize Firm or Strict policies, indicating a market where hosts prioritize booking security.
- Strict cancellation policies are quite rare (6.3%), potentially making listings with this policy less competitive unless justified by high demand or property type.
Recommendations for Hosts
- Consider adopting a Firm policy to align with the 53.1% market standard in Pedro Leopoldo.
- Using a Strict policy might deter some guests, as only 6.3% of listings use it. Evaluate if potential revenue protection outweighs possible lower booking rates.
- Regularly review your cancellation policy against competitors and market demand shifts in Pedro Leopoldo.
Pedro Leopoldo STR Booking Lead Time Analysis (2026)
Average Booking Lead Time by Month
Booking Lead Time Insights for Pedro Leopoldo
- The overall average booking lead time for vacation rentals in Pedro Leopoldo is 45 days.
- Guests book furthest in advance for stays during December (average 69 days), likely coinciding with peak travel demand or local events.
- The shortest booking windows occur for stays in March (average 19 days), indicating more last-minute travel plans during this time.
- Seasonally, Summer (43 days avg.) sees the longest lead times, while Spring (28 days avg.) has the shortest, reflecting typical travel planning cycles.
Recommendations for Hosts
- Use the overall average lead time (45 days) as a baseline for your pricing and availability strategy in Pedro Leopoldo.
- For December stays, consider implementing length-of-stay discounts or slightly higher rates for bookings made less than 69 days out to capitalize on advance planning.
- Target marketing efforts for the Summer season well in advance (at least 43 days) to capture early planners.
- Monitor your own booking lead times against these Pedro Leopoldo averages to identify opportunities for dynamic pricing adjustments.
Popular & Essential Airbnb Amenities in Pedro Leopoldo (2026)
Amenity Prevalence
Amenity Insights for Pedro Leopoldo
- Essential amenities in Pedro Leopoldo that guests expect include: TV. Lacking these (this) could significantly impact bookings.
- Popular amenities like Kitchen, Free parking on premises, Wifi are common but not universal. Offering these can provide a competitive edge.
- Warning: Wifi is not universally provided but is considered essential globally. Ensure reliable Wifi is offered.
Recommendations for Hosts
- Ensure your listing includes all essential amenities for Pedro Leopoldo: TV.
- Consider adding popular differentiators like Kitchen or Free parking on premises to increase appeal.
- Highlight unique or less common amenities you offer (e.g., hot tub, dedicated workspace, EV charger) in your listing description and photos.
- Regularly check competitor amenities in Pedro Leopoldo to stay competitive.
Pedro Leopoldo Airbnb Guest Demographics & Profile Analysis (2026)
Guest Profile Summary for Pedro Leopoldo
- The typical guest profile for Airbnb in Pedro Leopoldo consists of primarily domestic travelers (96%), often arriving from nearby Belo Horizonte, typically belonging to the Post-2000s (Gen Z/Alpha) group (50%), primarily speaking Portuguese or English.
- Domestic travelers account for 95.6% of guests.
- Key international markets include Brazil (95.6%) and Angola (1.5%).
- Top languages spoken are Portuguese (56%) followed by English (34%).
- A significant demographic segment is the Post-2000s (Gen Z/Alpha) group, representing 50% of guests.
Recommendations for Hosts
- Target domestic marketing efforts towards travelers from Belo Horizonte and State of Minas Gerais.
- Tailor amenities and listing descriptions to appeal to the dominant Post-2000s (Gen Z/Alpha) demographic (e.g., highlight fast WiFi, smart home features, local guides).
- Highlight unique local experiences or amenities relevant to the primary guest profile.
- Consider seasonal promotions aligned with peak travel times for key origin markets.
Nearby Short-Term Rental Market Comparison
How does the Pedro Leopoldo Airbnb market stack up against its neighbors? Compare key performance metrics like average monthly revenue, ADR, and occupancy rates in surrounding areas to understand the broader regional STR landscape.
| Market | Active Properties | Monthly Revenue | Daily Rate | Avg. Occupancy |
|---|---|---|---|---|
| Nova Lima | 172 | $965 | $108.86 | 37% |
| Moeda | 40 | $944 | $126.55 | 26% |
| São Joaquim de Bicas | 10 | $935 | $130.63 | 27% |
| Esmeraldas | 64 | $924 | $159.89 | 24% |
| Confins | 17 | $867 | $147.70 | 30% |
| Mateus Leme | 25 | $860 | $145.93 | 24% |
| Jaboticatubas | 198 | $820 | $130.91 | 27% |
| Igarapé | 31 | $793 | $136.80 | 27% |
| Ribeirão das Neves | 24 | $786 | $149.02 | 30% |
| Brumadinho | 257 | $761 | $111.87 | 29% |