Ribeirão das Neves Airbnb Market Analysis 2026: Short Term Rental Data & Vacation Rental Statistics in Minas Gerais, Brazil
Is Airbnb profitable in Ribeirão das Neves in 2026? Explore comprehensive Airbnb analytics for Ribeirão das Neves, Minas Gerais, Brazil to uncover income potential. This 2026 STR market report for Ribeirão das Neves, based on AirROI data from February 2025 to January 2026, reveals key trends in the niche market of 24 active listings.
Whether you're considering an Airbnb investment in Ribeirão das Neves, optimizing your existing vacation rental, or exploring rental arbitrage opportunities, understanding the Ribeirão das Neves Airbnb data is crucial. Leveraging the low regulation environment is key to maximizing your short term rental income potential. Let's dive into the specifics.
Key Ribeirão das Neves Airbnb Performance Metrics Overview
Monthly Airbnb Revenue Variations & Income Potential in Ribeirão das Neves (2026)
Understanding the monthly revenue variations for Airbnb listings in Ribeirão das Neves is key to maximizing your short term rental income potential. Seasonality significantly impacts earnings. Our analysis, based on data from the past 12 months, shows that the peak revenue month for STRs in Ribeirão das Neves is typically December, while May often presents the lowest earnings, highlighting opportunities for strategic pricing adjustments during shoulder and low seasons. Explore the typical Airbnb income in Ribeirão das Neves across different performance tiers:
- Best-in-class properties (Top 10%) achieve $3,099+ monthly, often utilizing dynamic pricing and superior guest experiences.
- Strong performing properties (Top 25%) earn $1,459 or more, indicating effective management and desirable locations/amenities.
- Typical properties (Median) generate around $534 per month, representing the average market performance.
- Entry-level properties (Bottom 25%) see earnings around $277, often with potential for optimization.
Average Monthly Airbnb Earnings Trend in Ribeirão das Neves
Ribeirão das Neves Airbnb Occupancy Rate Trends (2026)
Maximize your bookings by understanding the Ribeirão das Neves STR occupancy trends. Seasonal demand shifts significantly influence how often properties are booked. Typically, Februarysees the highest demand (peak season occupancy), while June experiences the lowest (low season). Effective strategies, like adjusting minimum stays or offering promotions, can boost occupancy during slower periods. Here's how different property tiers perform in Ribeirão das Neves:
- Best-in-class properties (Top 10%) achieve 66%+ occupancy, indicating high desirability and potentially optimized availability.
- Strong performing properties (Top 25%) maintain 48% or higher occupancy, suggesting good market fit and guest satisfaction.
- Typical properties (Median) have an occupancy rate around 26%.
- Entry-level properties (Bottom 25%) average 12% occupancy, potentially facing higher vacancy.
Average Monthly Occupancy Rate Trend in Ribeirão das Neves
Average Daily Rate (ADR) Airbnb Trends in Ribeirão das Neves (2026)
Effective short term rental pricing strategy in Ribeirão das Neves involves understanding monthly ADR fluctuations. The Average Daily Rate (ADR) for Airbnb in Ribeirão das Neves typically peaks in January and dips lowest during February. Leveraging Airbnb dynamic pricing tools or strategies based on this seasonality can significantly boost revenue. Here's a look at the typical nightly rates achieved:
- Best-in-class properties (Top 10%) command rates of $307+ per night, often due to premium features or locations.
- Strong performing properties (Top 25%) achieve nightly rates of $165 or more.
- Typical properties (Median) charge around $90 per night.
- Entry-level properties (Bottom 25%) earn around $33 per night.
Average Daily Rate (ADR) Trend by Month in Ribeirão das Neves
Get Live Ribeirão das Neves Market Intelligence 👇

Explore Real-time Analytics
Airbnb Seasonality Analysis & Trends in Ribeirão das Neves (2026)
Peak Season (December, July, April)
- Revenue averages $1,475 per month
- Occupancy rates average 35.6%
- Daily rates average $147
Shoulder Season
- Revenue averages $1,121 per month
- Occupancy maintains around 31.8%
- Daily rates hold near $160
Low Season (March, May, September)
- Revenue drops to average $836 per month
- Occupancy decreases to average 30.8%
- Daily rates adjust to average $138
Seasonality Insights for Ribeirão das Neves
- The Airbnb seasonality in Ribeirão das Neves shows highly seasonal trends requiring careful strategy. While the sections above show seasonal averages, it's also insightful to look at the extremes:
- During the high season, the absolute peak month showcases Ribeirão das Neves's highest earning potential, with monthly revenues capable of climbing to $1,858, occupancy reaching a high of 47.0%, and ADRs peaking at $207.
- Conversely, the slowest single month of the year, typically falling within the low season, marks the market's lowest point. In this month, revenue might dip to $531, occupancy could drop to 23.1%, and ADRs may adjust down to $116.
- Understanding both the seasonal averages and these monthly peaks and troughs in revenue, occupancy, and ADR is crucial for maximizing your Airbnb profit potential in Ribeirão das Neves.
Seasonal Strategies for Maximizing Profit
- Peak Season: Maximize revenue through premium pricing and potentially longer minimum stays. Ensure high availability.
- Low Season: Offer competitive pricing, special promotions (e.g., extended stay discounts), and flexible cancellation policies. Target off-season travelers like remote workers or budget-conscious guests.
- Shoulder Seasons: Implement dynamic pricing that balances peak and low rates. Target weekend travelers or specific events. Offer slightly more flexible terms than peak season.
- Regularly analyze your own performance against these Ribeirão das Neves seasonality benchmarks and adjust your pricing and availability strategy accordingly.
Best Areas for Airbnb Investment in Ribeirão das Neves (2026)
Exploring the top neighborhoods for short-term rentals in Ribeirão das Neves? This section highlights key areas, outlining why they are attractive for hosts and guests, along with notable local attractions. Consider these locations based on your target guest profile and investment strategy.
| Neighborhood / Area | Why Host Here? (Target Guests & Appeal) | Key Attractions & Landmarks |
|---|---|---|
| Centro | The central area offers access to local markets, restaurants, and cultural sites, making it attractive for both tourists and business travelers looking to get a taste of local life. | Ribeirão das Neves Cultural Center, Local Markets, Churches, Restaurants, City Park |
| Jardim São Pedro | A residential area that is gaining popularity due to its proximity to shopping and parks, perfect for families and longer stays. | Nearby parks, Local shopping, Family-friendly environments, Community events |
| Vila Nova | A vibrant neighborhood known for its community spirit and local events, making it a great spot for hosting guests interested in local culture. | Cultural events, Limited nightlife, Local restaurants |
| São Jorge | Close to public transport and major roadways, this area is convenient for travelers needing to visit other parts of the city or nearby attractions. | Public transport access, Shopping centers, Restaurants |
| Pachá | An up-and-coming neighborhood with new developments and growing local amenities, targeted towards young professionals and digital nomads. | Cafes, Local co-working spaces, New restaurants |
| Bairro das Indústrias | This industrial and commercial neighborhood offers a unique experiential stay for those interested in business or industry-related purposes. | Industrial heritage, Business centers, Local eateries |
| Primavera | Known for its green spaces and parks, suitable for guests who prefer a more relaxed and nature-oriented stay. | Parks, Family-friendly activities, Outdoor spaces |
| Nova Pampulha | A tranquil area with beautiful landscapes and recreational facilities, appealing for those looking for a peaceful getaway. | Lakeside, Walking trails, Nature parks |
Understanding Airbnb License Requirements & STR Laws in Ribeirão das Neves (2026)
While Ribeirão das Neves, Minas Gerais, Brazil currently shows low STR regulations, specific Airbnb license requirements might still exist or change. Always verify the latest short term rental regulations and Airbnb license requirements directly with local government authorities for Ribeirão das Neves to ensure full compliance before hosting.
(Source: AirROI data, 2026, finding no licensed listings among those analyzed)
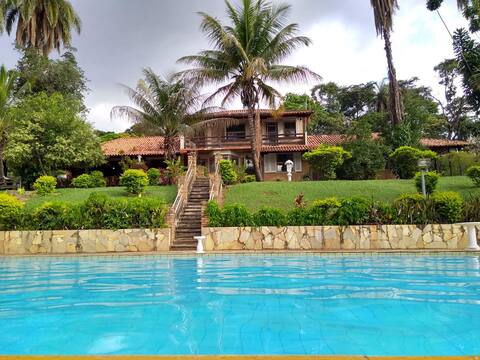
Top Performing Airbnb Properties in Ribeirão das Neves (2026)
Benchmark your potential! Explore examples of top-performing Airbnb properties in Ribeirão das Nevesbased on Trailing Twelve Month (TTM) revenue. Analyze their characteristics, revenue, occupancy rate, and ADR to understand what drives success in this market.

Casa Trancoso - Exclusive family experience.
Entire Place • 4 bedrooms
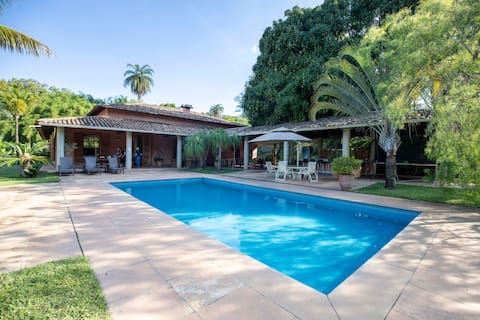
Sítio Timoneiro - Leisure, Comfort and Tranquility
Entire Place • 5 bedrooms
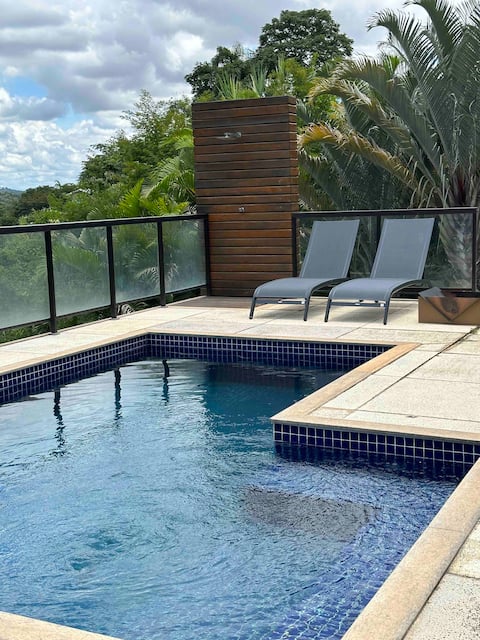
Country House with Pool and Jacuzzi
Entire Place • 4 bedrooms
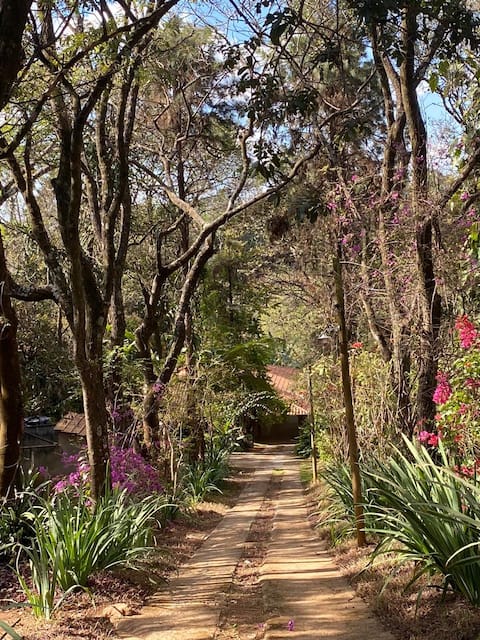
Fazenda Betânia. Extraordinary! just 30 minutes from BH
Entire Place • 5 bedrooms
Rustic Farm-5km from Pampulha–Comfort Nature"
Entire Place • 3 bedrooms

Sítio São Francisco Cond. Nossa Fazenda Esmeraldas MG
Entire Place • 4 bedrooms
Note: Performance varies based on location, size, amenities, seasonality, and management quality. Data reflects the past 12 months.
Top Performing Airbnb Hosts in Ribeirão das Neves (2026)
Learn from the best! This table showcases top-performing Airbnb hosts in Ribeirão das Neves based on the number of properties managed and estimated total revenue over the past year. Analyze their scale and performance metrics.
| Host Name | Properties | Grossing Revenue | Stay Reviews | Avg Rating |
|---|---|---|---|---|
| Felipe | 1 | $47,748 | 63 | 4.98/5.0 |
| Nathalia Tanure | 1 | $37,295 | 53 | 4.96/5.0 |
| Camila | 1 | $31,946 | 23 | 4.96/5.0 |
| Lucimara Fernandes | 5 | $20,726 | 111 | 4.85/5.0 |
| Maria Amália | 1 | $17,033 | 8 | 5.00/5.0 |
| Suely | 1 | $14,310 | 55 | 4.91/5.0 |
| Imaculada Nascimento | 1 | $12,419 | 4 | 5.00/5.0 |
| Fábio | 1 | $10,092 | 1 | Not Rated |
| Sítio Esperança E Fé | 3 | $6,564 | 43 | 4.76/5.0 |
| Maria Guerra | 1 | $5,889 | 15 | 4.67/5.0 |
Analyzing the strategies of top hosts, such as their property selection, pricing, and guest communication, can offer valuable lessons for optimizing your own Airbnb operations in Ribeirão das Neves.
Dive Deeper: Advanced Ribeirão das Neves STR Market Data (2026)
Ready to unlock more insights? AirROI provides access to advanced metrics and comprehensive Airbnb data for Ribeirão das Neves. Explore detailed analytics beyond this report to refine your investment strategy, optimize pricing, and maximize your vacation rental profits.
Explore Advanced MetricsRibeirão das Neves Short-Term Rental Market Composition (2026): Property & Room Types
Room Type Distribution
Property Type Distribution
Market Composition Insights for Ribeirão das Neves
- The Ribeirão das Neves Airbnb market composition is heavily skewed towards Entire Home/Apt listings, which make up 87.5% of the 24 active rentals. This indicates strong guest preference for privacy and space.
- Looking at the property type distribution in Ribeirão das Neves, House properties are the most common (62.5%), reflecting the local real estate landscape.
- Houses represent a significant 62.5% portion, catering likely to families or larger groups.
- Smaller segments like hotel/boutique (combined 4.2%) offer potential for unique stay experiences.
Ribeirão das Neves Airbnb Room Capacity Analysis (2026): Bedroom Distribution
Distribution of Listings by Number of Bedrooms
Room Capacity Insights for Ribeirão das Neves
- The dominant room capacity in Ribeirão das Neves is 2 bedrooms listings, making up 25% of the market. This suggests a strong demand for properties suitable for couples or solo travelers.
- Together, 2 bedrooms and 4 bedrooms properties represent 50.0% of the active Airbnb listings in Ribeirão das Neves, indicating a high concentration in these sizes.
- A significant 50.0% of listings offer 3+ bedrooms, catering to larger groups and families seeking more space in Ribeirão das Neves.
Ribeirão das Neves Vacation Rental Guest Capacity Trends (2026)
Distribution of Listings by Guest Capacity
Guest Capacity Insights for Ribeirão das Neves
- The most common guest capacity trend in Ribeirão das Neves vacation rentals is listings accommodating 8+ guests (50%). This suggests the primary traveler segment is likely larger groups.
- Properties designed for 8+ guests and 7 guests dominate the Ribeirão das Neves STR market, accounting for 62.5% of listings.
- 70.8% of properties accommodate 6+ guests, serving the market segment for larger families or group travel in Ribeirão das Neves.
- On average, properties in Ribeirão das Neves are equipped to host 5.8 guests.
Ribeirão das Neves Airbnb Booking Patterns (2026): Available vs. Booked Days
Available Days Distribution
Booked Days Distribution
Booking Pattern Insights for Ribeirão das Neves
- The most common availability pattern in Ribeirão das Neves falls within the 271-366 days range, representing 54.2% of listings. This suggests many properties have significant open periods on their calendars.
- Approximately 100.0% of listings show high availability (181+ days open annually), indicating potential for increased bookings or specific owner usage patterns.
- For booked days, the 91-180 days range is most frequent in Ribeirão das Neves (45.8%), reflecting common guest stay durations or potential owner blocking patterns.
Ribeirão das Neves Airbnb Minimum Stay Requirements Analysis
Distribution of Listings by Minimum Night Requirement
1 Night
7 listings
29.2% of total
2 Nights
7 listings
29.2% of total
3 Nights
1 listings
4.2% of total
4-6 Nights
5 listings
20.8% of total
7-29 Nights
2 listings
8.3% of total
30+ Nights
2 listings
8.3% of total
Key Insights
- The most prevalent minimum stay requirement in Ribeirão das Neves is 1 Night, adopted by 29.2% of listings. This highlights the market's preference for shorter, flexible bookings.
Recommendations
- Align with the market by considering a 1 Night minimum stay, as 29.2% of Ribeirão das Neves hosts use this setting.
- If feasible, allowing 1-night stays, especially midweek or during low season, could capture last-minute bookings, as only 29.2% currently do.
- Explore offering discounts for stays of 30+ nights to attract the 8.3% of the market seeking extended stays.
- Adjust minimum nights based on seasonality – potentially shorter during low season and longer during peak demand periods in Ribeirão das Neves.
Ribeirão das Neves Airbnb Cancellation Policy Trends Analysis (2026)
Flexible
3 listings
12.5% of total
Moderate
10 listings
41.7% of total
Firm
9 listings
37.5% of total
Strict
2 listings
8.3% of total
Cancellation Policy Insights for Ribeirão das Neves
- The prevailing Airbnb cancellation policy trend in Ribeirão das Neves is Moderate, used by 41.7% of listings.
- There's a relatively balanced mix between guest-friendly (54.2%) and stricter (45.8%) policies, offering choices for different guest needs.
- Strict cancellation policies are quite rare (8.3%), potentially making listings with this policy less competitive unless justified by high demand or property type.
Recommendations for Hosts
- Consider adopting a Moderate policy to align with the 41.7% market standard in Ribeirão das Neves.
- Using a Strict policy might deter some guests, as only 8.3% of listings use it. Evaluate if potential revenue protection outweighs possible lower booking rates.
- Regularly review your cancellation policy against competitors and market demand shifts in Ribeirão das Neves.
Ribeirão das Neves STR Booking Lead Time Analysis (2026)
Average Booking Lead Time by Month
Booking Lead Time Insights for Ribeirão das Neves
- The overall average booking lead time for vacation rentals in Ribeirão das Neves is 20 days.
- Guests book furthest in advance for stays during December (average 47 days), likely coinciding with peak travel demand or local events.
- The shortest booking windows occur for stays in September (average 7 days), indicating more last-minute travel plans during this time.
- Seasonally, Winter (27 days avg.) sees the longest lead times, while Summer (14 days avg.) has the shortest, reflecting typical travel planning cycles.
Recommendations for Hosts
- Use the overall average lead time (20 days) as a baseline for your pricing and availability strategy in Ribeirão das Neves.
- For December stays, consider implementing length-of-stay discounts or slightly higher rates for bookings made less than 47 days out to capitalize on advance planning.
- During September, focus on last-minute booking availability and promotions, as guests book with very short notice (7 days avg.).
- Target marketing efforts for the Winter season well in advance (at least 27 days) to capture early planners.
- Monitor your own booking lead times against these Ribeirão das Neves averages to identify opportunities for dynamic pricing adjustments.
Popular & Essential Airbnb Amenities in Ribeirão das Neves (2026)
Amenity Prevalence
Amenity Insights for Ribeirão das Neves
- Popular amenities like Wifi, TV, Free parking on premises are common but not universal. Offering these can provide a competitive edge.
- Warning: Wifi is not universally provided but is considered essential globally. Ensure reliable Wifi is offered.
Recommendations for Hosts
- Consider adding popular differentiators like Wifi or TV to increase appeal.
- Highlight unique or less common amenities you offer (e.g., hot tub, dedicated workspace, EV charger) in your listing description and photos.
- Regularly check competitor amenities in Ribeirão das Neves to stay competitive.
Ribeirão das Neves Airbnb Guest Demographics & Profile Analysis (2026)
Guest Profile Summary for Ribeirão das Neves
- The typical guest profile for Airbnb in Ribeirão das Neves consists of primarily domestic travelers (94%), often arriving from nearby Belo Horizonte, typically belonging to the Post-2000s (Gen Z/Alpha) group (50%), primarily speaking Portuguese or Spanish.
- Domestic travelers account for 93.9% of guests.
- Key international markets include Brazil (93.9%) and Norway (3%).
- Top languages spoken are Portuguese (44.8%) followed by Spanish (24.1%).
- A significant demographic segment is the Post-2000s (Gen Z/Alpha) group, representing 50% of guests.
Recommendations for Hosts
- Target domestic marketing efforts towards travelers from Belo Horizonte and Minas Gerais.
- Tailor amenities and listing descriptions to appeal to the dominant Post-2000s (Gen Z/Alpha) demographic (e.g., highlight fast WiFi, smart home features, local guides).
- Highlight unique local experiences or amenities relevant to the primary guest profile.
- Consider seasonal promotions aligned with peak travel times for key origin markets.
Nearby Short-Term Rental Market Comparison
How does the Ribeirão das Neves Airbnb market stack up against its neighbors? Compare key performance metrics like average monthly revenue, ADR, and occupancy rates in surrounding areas to understand the broader regional STR landscape.
| Market | Active Properties | Monthly Revenue | Daily Rate | Avg. Occupancy |
|---|---|---|---|---|
| Nova Lima | 172 | $965 | $108.86 | 37% |
| Moeda | 40 | $944 | $126.55 | 26% |
| São Joaquim de Bicas | 10 | $935 | $130.63 | 27% |
| Esmeraldas | 64 | $924 | $159.89 | 24% |
| Confins | 17 | $867 | $147.70 | 30% |
| Mateus Leme | 25 | $860 | $145.93 | 24% |
| Jaboticatubas | 198 | $820 | $130.91 | 27% |
| Igarapé | 31 | $793 | $136.80 | 27% |
| Brumadinho | 257 | $761 | $111.87 | 29% |
| Taquaraçu de Minas | 16 | $717 | $152.44 | 22% |