São Lourenço Airbnb Market Analysis 2026: Short Term Rental Data & Vacation Rental Statistics in Minas Gerais, Brazil
Is Airbnb profitable in São Lourenço in 2026? Explore comprehensive Airbnb analytics for São Lourenço, Minas Gerais, Brazil to uncover income potential. This 2026 STR market report for São Lourenço, based on AirROI data from February 2025 to January 2026, reveals key trends in the market of 283 active listings.
Whether you're considering an Airbnb investment in São Lourenço, optimizing your existing vacation rental, or exploring rental arbitrage opportunities, understanding the São Lourenço Airbnb data is crucial. Leveraging the low regulation environment is key to maximizing your short term rental income potential. Let's dive into the specifics.
Key São Lourenço Airbnb Performance Metrics Overview
Monthly Airbnb Revenue Variations & Income Potential in São Lourenço (2026)
Understanding the monthly revenue variations for Airbnb listings in São Lourenço is key to maximizing your short term rental income potential. Seasonality significantly impacts earnings. Our analysis, based on data from the past 12 months, shows that the peak revenue month for STRs in São Lourenço is typically July, while February often presents the lowest earnings, highlighting opportunities for strategic pricing adjustments during shoulder and low seasons. Explore the typical Airbnb income in São Lourenço across different performance tiers:
- Best-in-class properties (Top 10%) achieve $985+ monthly, often utilizing dynamic pricing and superior guest experiences.
- Strong performing properties (Top 25%) earn $569 or more, indicating effective management and desirable locations/amenities.
- Typical properties (Median) generate around $304 per month, representing the average market performance.
- Entry-level properties (Bottom 25%) see earnings around $144, often with potential for optimization.
Average Monthly Airbnb Earnings Trend in São Lourenço
São Lourenço Airbnb Occupancy Rate Trends (2026)
Maximize your bookings by understanding the São Lourenço STR occupancy trends. Seasonal demand shifts significantly influence how often properties are booked. Typically, Julysees the highest demand (peak season occupancy), while September experiences the lowest (low season). Effective strategies, like adjusting minimum stays or offering promotions, can boost occupancy during slower periods. Here's how different property tiers perform in São Lourenço:
- Best-in-class properties (Top 10%) achieve 61%+ occupancy, indicating high desirability and potentially optimized availability.
- Strong performing properties (Top 25%) maintain 42% or higher occupancy, suggesting good market fit and guest satisfaction.
- Typical properties (Median) have an occupancy rate around 23%.
- Entry-level properties (Bottom 25%) average 11% occupancy, potentially facing higher vacancy.
Average Monthly Occupancy Rate Trend in São Lourenço
Average Daily Rate (ADR) Airbnb Trends in São Lourenço (2026)
Effective short term rental pricing strategy in São Lourenço involves understanding monthly ADR fluctuations. The Average Daily Rate (ADR) for Airbnb in São Lourenço typically peaks in December and dips lowest during February. Leveraging Airbnb dynamic pricing tools or strategies based on this seasonality can significantly boost revenue. Here's a look at the typical nightly rates achieved:
- Best-in-class properties (Top 10%) command rates of $86+ per night, often due to premium features or locations.
- Strong performing properties (Top 25%) achieve nightly rates of $59 or more.
- Typical properties (Median) charge around $41 per night.
- Entry-level properties (Bottom 25%) earn around $30 per night.
Average Daily Rate (ADR) Trend by Month in São Lourenço
Get Live São Lourenço Market Intelligence 👇

Explore Real-time Analytics
Airbnb Seasonality Analysis & Trends in São Lourenço (2026)
Peak Season (July, December, August)
- Revenue averages $531 per month
- Occupancy rates average 33.5%
- Daily rates average $54
Shoulder Season
- Revenue averages $428 per month
- Occupancy maintains around 28.2%
- Daily rates hold near $51
Low Season (February, May, September)
- Revenue drops to average $379 per month
- Occupancy decreases to average 25.6%
- Daily rates adjust to average $49
Seasonality Insights for São Lourenço
- The Airbnb seasonality in São Lourenço shows moderate seasonality with distinct peak and low periods. While the sections above show seasonal averages, it's also insightful to look at the extremes:
- During the high season, the absolute peak month showcases São Lourenço's highest earning potential, with monthly revenues capable of climbing to $579, occupancy reaching a high of 37.3%, and ADRs peaking at $57.
- Conversely, the slowest single month of the year, typically falling within the low season, marks the market's lowest point. In this month, revenue might dip to $369, occupancy could drop to 24.7%, and ADRs may adjust down to $46.
- Understanding both the seasonal averages and these monthly peaks and troughs in revenue, occupancy, and ADR is crucial for maximizing your Airbnb profit potential in São Lourenço.
Seasonal Strategies for Maximizing Profit
- Peak Season: Maximize revenue through premium pricing and potentially longer minimum stays. Ensure high availability.
- Low Season: Offer competitive pricing, special promotions (e.g., extended stay discounts), and flexible cancellation policies. Target off-season travelers like remote workers or budget-conscious guests.
- Shoulder Seasons: Implement dynamic pricing that balances peak and low rates. Target weekend travelers or specific events. Offer slightly more flexible terms than peak season.
- Regularly analyze your own performance against these São Lourenço seasonality benchmarks and adjust your pricing and availability strategy accordingly.
Best Areas for Airbnb Investment in São Lourenço (2026)
Exploring the top neighborhoods for short-term rentals in São Lourenço? This section highlights key areas, outlining why they are attractive for hosts and guests, along with notable local attractions. Consider these locations based on your target guest profile and investment strategy.
| Neighborhood / Area | Why Host Here? (Target Guests & Appeal) | Key Attractions & Landmarks |
|---|---|---|
| Centro | The city center of São Lourenço, known for its colonial architecture and historical charm. It is close to main attractions and amenities, making it a prime location for visitors. | São Lourenço Park, Espaço Cultural São Lourenço, Thematic Fountain, Church of São Lourenço, Cultural Center |
| São Lourenço Park | A beautiful and well-maintained park that attracts visitors for leisure activities. It's perfect for families and those looking to relax in nature while still being close to city attractions. | Lake and Boat Rides, Walking Trails, Picnic Areas, Nature Experiences, Playground |
| Cascata do Ouro | A stunning waterfall located close to São Lourenço, appealing to nature lovers and tourists seeking outdoor adventures and beautiful scenery. | Waterfall Trails, Natural Swimming Pools, Photography Opportunities, Guided Tours to the Waterfall |
| Termas de São Lourenço | Famous for its thermal waters, this area attracts tourists seeking wellness and relaxation. It is perfect for health-focused travelers looking for spa experiences. | Thermal Baths, Spa Treatments, Health and Wellness Programs, Natural Spring Water |
| Minas Gerais Historic Museum | A cultural hotspot in São Lourenço, showcasing the rich history and culture of the region, which attracts tourists interested in local history and heritage. | Exhibits on Minas Gerais History, Local Artifacts, Guided Historical Tours |
| Alto de São Lourenço | A picturesque neighborhood offering panoramic views of the city and surrounding landscape. It is popular among tourists looking for a peaceful retreat with beautiful scenery. | Viewpoints, Nature Trails, Local Artisan Shops, Cafés with Scenic Views |
| Fazenda do Chocolate | An immersive experience for chocolate lovers that showcases the production of chocolate and unique local flavors. It attracts tourists interested in culinary experiences. | Chocolate Factory Tours, Tasting Sessions, Workshops on Chocolate Making, Café |
| Pico do Gavião | A hiking destination with stunning views of the region. It attracts outdoor enthusiasts and adventure seekers looking for hikes and beautiful landscapes. | Hiking Trails, Photography Spots, Nature Observation |
Understanding Airbnb License Requirements & STR Laws in São Lourenço (2026)
While São Lourenço, Minas Gerais, Brazil currently shows low STR regulations, specific Airbnb license requirements might still exist or change. Always verify the latest short term rental regulations and Airbnb license requirements directly with local government authorities for São Lourenço to ensure full compliance before hosting.
(Source: AirROI data, 2026, finding no licensed listings among those analyzed)
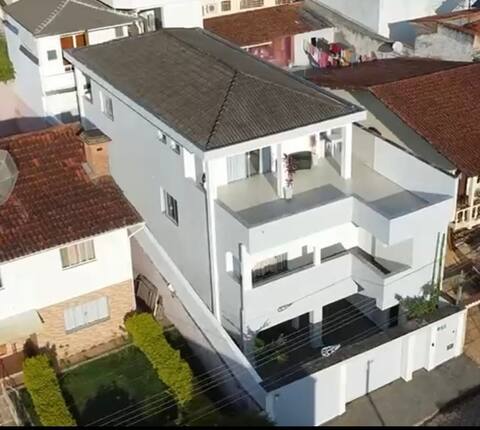
Top Performing Airbnb Properties in São Lourenço (2026)
Benchmark your potential! Explore examples of top-performing Airbnb properties in São Lourençobased on Trailing Twelve Month (TTM) revenue. Analyze their characteristics, revenue, occupancy rate, and ADR to understand what drives success in this market.

House with gourmet area and heated SPA!
Entire Place • 4 bedrooms
Cozy and comfortable house for 20 people
Entire Place • 7 bedrooms

Casa Florescer
Entire Place • 3 bedrooms

Luxury house with gourmet area.
Entire Place • 4 bedrooms

Entire home near the station (Trem das águas)
Entire Place • 3 bedrooms

Country house with artificial waterfall and fire pit
Entire Place • 3 bedrooms
Note: Performance varies based on location, size, amenities, seasonality, and management quality. Data reflects the past 12 months.
Top Performing Airbnb Hosts in São Lourenço (2026)
Learn from the best! This table showcases top-performing Airbnb hosts in São Lourenço based on the number of properties managed and estimated total revenue over the past year. Analyze their scale and performance metrics.
| Host Name | Properties | Grossing Revenue | Stay Reviews | Avg Rating |
|---|---|---|---|---|
| Carolina | 4 | $50,639 | 293 | 4.98/5.0 |
| Lara | 9 | $31,918 | 449 | 4.88/5.0 |
| Marisa | 2 | $28,938 | 163 | 5.00/5.0 |
| Fabiana | 7 | $26,793 | 513 | 4.96/5.0 |
| Ana Carolina | 1 | $26,582 | 33 | 4.97/5.0 |
| Aline | 2 | $22,578 | 118 | 4.92/5.0 |
| Maria Lucia | 4 | $20,791 | 144 | 4.91/5.0 |
| Fabiana | 1 | $20,385 | 14 | 5.00/5.0 |
| Priscila | 2 | $19,967 | 71 | 5.00/5.0 |
| Rodrigo | 3 | $19,198 | 114 | 4.96/5.0 |
Analyzing the strategies of top hosts, such as their property selection, pricing, and guest communication, can offer valuable lessons for optimizing your own Airbnb operations in São Lourenço.
Dive Deeper: Advanced São Lourenço STR Market Data (2026)
Ready to unlock more insights? AirROI provides access to advanced metrics and comprehensive Airbnb data for São Lourenço. Explore detailed analytics beyond this report to refine your investment strategy, optimize pricing, and maximize your vacation rental profits.
Explore Advanced MetricsSão Lourenço Short-Term Rental Market Composition (2026): Property & Room Types
Room Type Distribution
Property Type Distribution
Market Composition Insights for São Lourenço
- The São Lourenço Airbnb market composition is heavily skewed towards Entire Home/Apt listings, which make up 92.9% of the 283 active rentals. This indicates strong guest preference for privacy and space.
- Looking at the property type distribution in São Lourenço, Apartment/Condo properties are the most common (60.4%), reflecting the local real estate landscape.
- Houses represent a significant 34.3% portion, catering likely to families or larger groups.
- Smaller segments like hotel/boutique, outdoor/unique, others (combined 5.4%) offer potential for unique stay experiences.
São Lourenço Airbnb Room Capacity Analysis (2026): Bedroom Distribution
Distribution of Listings by Number of Bedrooms
Room Capacity Insights for São Lourenço
- The dominant room capacity in São Lourenço is 1 bedroom listings, making up 49.1% of the market. This suggests a strong demand for properties suitable for couples or solo travelers.
- Together, 1 bedroom and 2 bedrooms properties represent 75.6% of the active Airbnb listings in São Lourenço, indicating a high concentration in these sizes.
São Lourenço Vacation Rental Guest Capacity Trends (2026)
Distribution of Listings by Guest Capacity
Guest Capacity Insights for São Lourenço
- The most common guest capacity trend in São Lourenço vacation rentals is listings accommodating 4 guests (26.9%). This suggests the primary traveler segment is likely small families or groups.
- Properties designed for 4 guests and 6 guests dominate the São Lourenço STR market, accounting for 44.6% of listings.
- 35.3% of properties accommodate 6+ guests, serving the market segment for larger families or group travel in São Lourenço.
- On average, properties in São Lourenço are equipped to host 4.7 guests.
São Lourenço Airbnb Booking Patterns (2026): Available vs. Booked Days
Available Days Distribution
Booked Days Distribution
Booking Pattern Insights for São Lourenço
- The most common availability pattern in São Lourenço falls within the 271-366 days range, representing 67.5% of listings. This suggests many properties have significant open periods on their calendars.
- Approximately 93.6% of listings show high availability (181+ days open annually), indicating potential for increased bookings or specific owner usage patterns.
- For booked days, the 31-90 days range is most frequent in São Lourenço (35%), reflecting common guest stay durations or potential owner blocking patterns.
- A notable 7.5% of properties secure long booking periods (181+ days booked per year), highlighting successful long-term rental strategies or significant owner usage.
São Lourenço Airbnb Minimum Stay Requirements Analysis
Distribution of Listings by Minimum Night Requirement
1 Night
110 listings
38.9% of total
2 Nights
101 listings
35.7% of total
3 Nights
4 listings
1.4% of total
4-6 Nights
4 listings
1.4% of total
7-29 Nights
1 listings
0.4% of total
30+ Nights
63 listings
22.3% of total
Key Insights
- The most prevalent minimum stay requirement in São Lourenço is 1 Night, adopted by 38.9% of listings. This highlights the market's preference for shorter, flexible bookings.
- A strong majority (74.6%) of the São Lourenço Airbnb data shows acceptance of very short stays (1-2 nights), indicating a dynamic, high-turnover market.
- A significant segment (22.3%) caters to monthly stays (30+ nights) in São Lourenço, pointing to opportunities in the extended-stay market.
Recommendations
- Align with the market by considering a 1 Night minimum stay, as 38.9% of São Lourenço hosts use this setting.
- Explore offering discounts for stays of 30+ nights to attract the 22.3% of the market seeking extended stays.
- Adjust minimum nights based on seasonality – potentially shorter during low season and longer during peak demand periods in São Lourenço.
São Lourenço Airbnb Cancellation Policy Trends Analysis (2026)
Limited
9 listings
3.2% of total
Super Strict 30 Days
1 listings
0.4% of total
Flexible
76 listings
27% of total
Moderate
106 listings
37.6% of total
Firm
70 listings
24.8% of total
Strict
20 listings
7.1% of total
Cancellation Policy Insights for São Lourenço
- The prevailing Airbnb cancellation policy trend in São Lourenço is Moderate, used by 37.6% of listings.
- There's a relatively balanced mix between guest-friendly (64.6%) and stricter (31.9%) policies, offering choices for different guest needs.
- Strict cancellation policies are quite rare (7.1%), potentially making listings with this policy less competitive unless justified by high demand or property type.
Recommendations for Hosts
- Consider adopting a Moderate policy to align with the 37.6% market standard in São Lourenço.
- Using a Strict policy might deter some guests, as only 7.1% of listings use it. Evaluate if potential revenue protection outweighs possible lower booking rates.
- Regularly review your cancellation policy against competitors and market demand shifts in São Lourenço.
São Lourenço STR Booking Lead Time Analysis (2026)
Average Booking Lead Time by Month
Booking Lead Time Insights for São Lourenço
- The overall average booking lead time for vacation rentals in São Lourenço is 30 days.
- Guests book furthest in advance for stays during May (average 48 days), likely coinciding with peak travel demand or local events.
- The shortest booking windows occur for stays in October (average 16 days), indicating more last-minute travel plans during this time.
- Seasonally, Spring (37 days avg.) sees the longest lead times, while Fall (20 days avg.) has the shortest, reflecting typical travel planning cycles.
Recommendations for Hosts
- Use the overall average lead time (30 days) as a baseline for your pricing and availability strategy in São Lourenço.
- For May stays, consider implementing length-of-stay discounts or slightly higher rates for bookings made less than 48 days out to capitalize on advance planning.
- Target marketing efforts for the Spring season well in advance (at least 37 days) to capture early planners.
- Monitor your own booking lead times against these São Lourenço averages to identify opportunities for dynamic pricing adjustments.
Popular & Essential Airbnb Amenities in São Lourenço (2026)
Amenity Prevalence
Amenity Insights for São Lourenço
- Essential amenities in São Lourenço that guests expect include: Kitchen. Lacking these (this) could significantly impact bookings.
- Popular amenities like TV, Wifi, Dishes and silverware are common but not universal. Offering these can provide a competitive edge.
- Warning: Wifi is not universally provided but is considered essential globally. Ensure reliable Wifi is offered.
Recommendations for Hosts
- Ensure your listing includes all essential amenities for São Lourenço: Kitchen.
- Prioritize adding missing essentials: Kitchen.
- Consider adding popular differentiators like TV or Wifi to increase appeal.
- Highlight unique or less common amenities you offer (e.g., hot tub, dedicated workspace, EV charger) in your listing description and photos.
- Regularly check competitor amenities in São Lourenço to stay competitive.
São Lourenço Airbnb Guest Demographics & Profile Analysis (2026)
Guest Profile Summary for São Lourenço
- The typical guest profile for Airbnb in São Lourenço consists of primarily domestic travelers (98%), often arriving from nearby Rio de Janeiro, typically belonging to the Post-2000s (Gen Z/Alpha) group (50%), primarily speaking Portuguese or English.
- Domestic travelers account for 97.6% of guests.
- Key international markets include Brazil (97.6%) and United States (0.7%).
- Top languages spoken are Portuguese (54.7%) followed by English (26%).
- A significant demographic segment is the Post-2000s (Gen Z/Alpha) group, representing 50% of guests.
Recommendations for Hosts
- Target domestic marketing efforts towards travelers from Rio de Janeiro and São Paulo.
- Tailor amenities and listing descriptions to appeal to the dominant Post-2000s (Gen Z/Alpha) demographic (e.g., highlight fast WiFi, smart home features, local guides).
- Highlight unique local experiences or amenities relevant to the primary guest profile.
- Consider seasonal promotions aligned with peak travel times for key origin markets.
Nearby Short-Term Rental Market Comparison
How does the São Lourenço Airbnb market stack up against its neighbors? Compare key performance metrics like average monthly revenue, ADR, and occupancy rates in surrounding areas to understand the broader regional STR landscape.
| Market | Active Properties | Monthly Revenue | Daily Rate | Avg. Occupancy |
|---|---|---|---|---|
| Riviera de São Lourenço | 10 | $2,868 | $213.78 | 46% |
| Ilha Grande | 11 | $1,783 | $166.42 | 38% |
| Tuiuti | 18 | $1,686 | $156.45 | 30% |
| Morungaba | 31 | $1,435 | $263.39 | 27% |
| Campo Limpo Paulista | 49 | $1,428 | $181.02 | 30% |
| Valinhos | 61 | $1,370 | $176.28 | 33% |
| Itatiba | 171 | $1,331 | $177.58 | 29% |
| Vargem | 48 | $1,319 | $190.42 | 28% |
| Queluz | 17 | $1,291 | $152.05 | 30% |
| Bom Jesus dos Perdões | 83 | $1,236 | $167.74 | 28% |