São João del-Rei Airbnb Market Analysis 2026: Short Term Rental Data & Vacation Rental Statistics in Minas Gerais, Brazil
Is Airbnb profitable in São João del-Rei in 2026? Explore comprehensive Airbnb analytics for São João del-Rei, Minas Gerais, Brazil to uncover income potential. This 2026 STR market report for São João del-Rei, based on AirROI data from February 2025 to January 2026, reveals key trends in the market of 248 active listings.
Whether you're considering an Airbnb investment in São João del-Rei, optimizing your existing vacation rental, or exploring rental arbitrage opportunities, understanding the São João del-Rei Airbnb data is crucial. Leveraging the low regulation environment is key to maximizing your short term rental income potential. Let's dive into the specifics.
Key São João del-Rei Airbnb Performance Metrics Overview
Monthly Airbnb Revenue Variations & Income Potential in São João del-Rei (2026)
Understanding the monthly revenue variations for Airbnb listings in São João del-Rei is key to maximizing your short term rental income potential. Seasonality significantly impacts earnings. Our analysis, based on data from the past 12 months, shows that the peak revenue month for STRs in São João del-Rei is typically July, while February often presents the lowest earnings, highlighting opportunities for strategic pricing adjustments during shoulder and low seasons. Explore the typical Airbnb income in São João del-Rei across different performance tiers:
- Best-in-class properties (Top 10%) achieve $1,039+ monthly, often utilizing dynamic pricing and superior guest experiences.
- Strong performing properties (Top 25%) earn $565 or more, indicating effective management and desirable locations/amenities.
- Typical properties (Median) generate around $289 per month, representing the average market performance.
- Entry-level properties (Bottom 25%) see earnings around $131, often with potential for optimization.
Average Monthly Airbnb Earnings Trend in São João del-Rei
São João del-Rei Airbnb Occupancy Rate Trends (2026)
Maximize your bookings by understanding the São João del-Rei STR occupancy trends. Seasonal demand shifts significantly influence how often properties are booked. Typically, Julysees the highest demand (peak season occupancy), while October experiences the lowest (low season). Effective strategies, like adjusting minimum stays or offering promotions, can boost occupancy during slower periods. Here's how different property tiers perform in São João del-Rei:
- Best-in-class properties (Top 10%) achieve 63%+ occupancy, indicating high desirability and potentially optimized availability.
- Strong performing properties (Top 25%) maintain 42% or higher occupancy, suggesting good market fit and guest satisfaction.
- Typical properties (Median) have an occupancy rate around 24%.
- Entry-level properties (Bottom 25%) average 11% occupancy, potentially facing higher vacancy.
Average Monthly Occupancy Rate Trend in São João del-Rei
Average Daily Rate (ADR) Airbnb Trends in São João del-Rei (2026)
Effective short term rental pricing strategy in São João del-Rei involves understanding monthly ADR fluctuations. The Average Daily Rate (ADR) for Airbnb in São João del-Rei typically peaks in December and dips lowest during February. Leveraging Airbnb dynamic pricing tools or strategies based on this seasonality can significantly boost revenue. Here's a look at the typical nightly rates achieved:
- Best-in-class properties (Top 10%) command rates of $98+ per night, often due to premium features or locations.
- Strong performing properties (Top 25%) achieve nightly rates of $60 or more.
- Typical properties (Median) charge around $38 per night.
- Entry-level properties (Bottom 25%) earn around $23 per night.
Average Daily Rate (ADR) Trend by Month in São João del-Rei
Get Live São João del-Rei Market Intelligence 👇

Explore Real-time Analytics
Airbnb Seasonality Analysis & Trends in São João del-Rei (2026)
Peak Season (July, January, December)
- Revenue averages $581 per month
- Occupancy rates average 31.5%
- Daily rates average $55
Shoulder Season
- Revenue averages $443 per month
- Occupancy maintains around 29.2%
- Daily rates hold near $50
Low Season (February, April, September)
- Revenue drops to average $387 per month
- Occupancy decreases to average 27.8%
- Daily rates adjust to average $47
Seasonality Insights for São João del-Rei
- The Airbnb seasonality in São João del-Rei shows moderate seasonality with distinct peak and low periods. While the sections above show seasonal averages, it's also insightful to look at the extremes:
- During the high season, the absolute peak month showcases São João del-Rei's highest earning potential, with monthly revenues capable of climbing to $615, occupancy reaching a high of 40.2%, and ADRs peaking at $59.
- Conversely, the slowest single month of the year, typically falling within the low season, marks the market's lowest point. In this month, revenue might dip to $344, occupancy could drop to 26.0%, and ADRs may adjust down to $44.
- Understanding both the seasonal averages and these monthly peaks and troughs in revenue, occupancy, and ADR is crucial for maximizing your Airbnb profit potential in São João del-Rei.
Seasonal Strategies for Maximizing Profit
- Peak Season: Maximize revenue through premium pricing and potentially longer minimum stays. Ensure high availability.
- Low Season: Offer competitive pricing, special promotions (e.g., extended stay discounts), and flexible cancellation policies. Target off-season travelers like remote workers or budget-conscious guests.
- Shoulder Seasons: Implement dynamic pricing that balances peak and low rates. Target weekend travelers or specific events. Offer slightly more flexible terms than peak season.
- Regularly analyze your own performance against these São João del-Rei seasonality benchmarks and adjust your pricing and availability strategy accordingly.
Best Areas for Airbnb Investment in São João del-Rei (2026)
Exploring the top neighborhoods for short-term rentals in São João del-Rei? This section highlights key areas, outlining why they are attractive for hosts and guests, along with notable local attractions. Consider these locations based on your target guest profile and investment strategy.
| Neighborhood / Area | Why Host Here? (Target Guests & Appeal) | Key Attractions & Landmarks |
|---|---|---|
| Historic Center | A UNESCO World Heritage site known for its colonial architecture, vibrant culture, and historical significance. Attracts tourists interested in history and culture, making it ideal for Airbnb hosting. | The Church of Saint Francis of Assisi, The Municipal Museum, The Matriz de Nossa Senhora do Pilar, The Railway Station, The Praça Getúlio Vargas |
| São João del-Rei City Center | The bustling heart of the city with shops, restaurants, and festivities. Ideal for visitors looking for convenience and access to local life and culture. | Shopping in the City Center, Local restaurants, Craft markets, Cafes, Cultural events |
| Pouso Alegre | A nearby charming town known for its natural beauty and peace. Perfect for those seeking a quiet getaway in nature, attracting family visitors and nature lovers. | Hiking trails, Natural parks, Local cuisine, Scenic views, Historic sites |
| Tiradentes | Just a short distance from São João del-Rei, this picturesque town is known for its colonial architecture and arts scene, attracting art lovers and tourists looking for quaint experiences. | Church of Santo Antonio, Tiradentes Historic Center, Art galleries, Diverse festivals, Local artisan shops |
| Alto do São João | A residential neighborhood that offers panoramic views and is close to nature. Appeals to visitors seeking tranquility and a local neighborhood ambiance. | Beautiful views, Parks and trails, Local homes, Nature engagement, Quiet residential life |
| Recanto do Sol | A serene area known for its guest houses and nature experiences, perfect for families and couples looking for a peaceful retreat. | Nature reserves, Recreational activities, Quiet atmosphere, Healthy food spots, Relaxing getaways |
| Caldas | Known for its thermal springs and wellness amenities, ideal for health-conscious travelers and those seeking relaxation. | Thermal baths, Spas and wellness centers, Natural beauty, Recreation areas, Health-focused retreats |
| São Sebastião | A rural area offering an authentic experience of Minas Gerais life, appealing to those interested in agriculture and rural tourism. | Local farms, Cultural traditions, Natural sights, Community festivals, Agritourism experiences |
Understanding Airbnb License Requirements & STR Laws in São João del-Rei (2026)
While São João del-Rei, Minas Gerais, Brazil currently shows low STR regulations, specific Airbnb license requirements might still exist or change. Always verify the latest short term rental regulations and Airbnb license requirements directly with local government authorities for São João del-Rei to ensure full compliance before hosting.
(Source: AirROI data, 2026, based on 1% licensed listings)
Top Performing Airbnb Properties in São João del-Rei (2026)
Benchmark your potential! Explore examples of top-performing Airbnb properties in São João del-Reibased on Trailing Twelve Month (TTM) revenue. Analyze their characteristics, revenue, occupancy rate, and ADR to understand what drives success in this market.
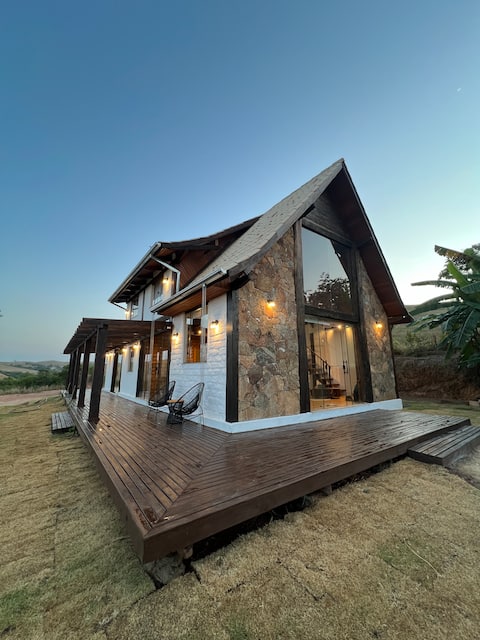
Chalet with Jacuzzi - Pet Friendly - 12 guests
Entire Place • 4 bedrooms

House in São João Del Rei comfort and charm
Entire Place • 2 bedrooms
O Canto de São João - Historic Mansion in the center
Entire Place • 7 bedrooms
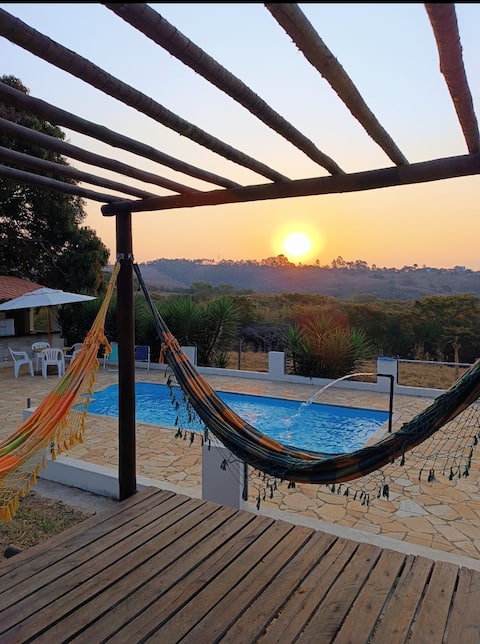
Ranch in Tiradentes: leisure, WiFi and amazing view.
Entire Place • 4 bedrooms

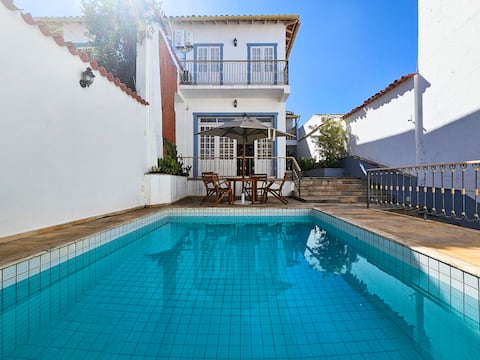
House with Swimming Pool/Soccer Field/Bed Linen/Bath
Entire Place • 4 bedrooms

Penthouse, Jacuzzi, barbecue, historic center!
Entire Place • 1 bedroom
Note: Performance varies based on location, size, amenities, seasonality, and management quality. Data reflects the past 12 months.
Top Performing Airbnb Hosts in São João del-Rei (2026)
Learn from the best! This table showcases top-performing Airbnb hosts in São João del-Rei based on the number of properties managed and estimated total revenue over the past year. Analyze their scale and performance metrics.
| Host Name | Properties | Grossing Revenue | Stay Reviews | Avg Rating |
|---|---|---|---|---|
| Pousada Residência Balestra | 11 | $47,686 | 22 | 4.92/5.0 |
| Joyce | 1 | $41,317 | 31 | 5.00/5.0 |
| Welhome Brasil | 1 | $26,805 | 64 | 4.94/5.0 |
| Daniel Ramos | 2 | $21,908 | 130 | 5.00/5.0 |
| Dominique Kaulen | 1 | $21,669 | 48 | 4.85/5.0 |
| Andréia Fonseca | 1 | $20,501 | 34 | 5.00/5.0 |
| Evandro E Lary | 2 | $18,911 | 137 | 4.92/5.0 |
| André Luiz De | 1 | $18,036 | 58 | 4.97/5.0 |
| Marina | 1 | $17,171 | 106 | 4.92/5.0 |
| Ricardo | 1 | $16,862 | 126 | 4.89/5.0 |
Analyzing the strategies of top hosts, such as their property selection, pricing, and guest communication, can offer valuable lessons for optimizing your own Airbnb operations in São João del-Rei.
Dive Deeper: Advanced São João del-Rei STR Market Data (2026)
Ready to unlock more insights? AirROI provides access to advanced metrics and comprehensive Airbnb data for São João del-Rei. Explore detailed analytics beyond this report to refine your investment strategy, optimize pricing, and maximize your vacation rental profits.
Explore Advanced MetricsSão João del-Rei Short-Term Rental Market Composition (2026): Property & Room Types
Room Type Distribution
Property Type Distribution
Market Composition Insights for São João del-Rei
- The São João del-Rei Airbnb market composition is heavily skewed towards Entire Home/Apt listings, which make up 71% of the 248 active rentals. This indicates strong guest preference for privacy and space.
- Looking at the property type distribution in São João del-Rei, House properties are the most common (49.6%), reflecting the local real estate landscape.
- Houses represent a significant 49.6% portion, catering likely to families or larger groups.
- The presence of 12.1% Hotel/Boutique listings indicates integration with traditional hospitality.
- Smaller segments like outdoor/unique (combined 1.2%) offer potential for unique stay experiences.
São João del-Rei Airbnb Room Capacity Analysis (2026): Bedroom Distribution
Distribution of Listings by Number of Bedrooms
Room Capacity Insights for São João del-Rei
- The dominant room capacity in São João del-Rei is 1 bedroom listings, making up 37.1% of the market. This suggests a strong demand for properties suitable for couples or solo travelers.
- Together, 1 bedroom and 2 bedrooms properties represent 58.1% of the active Airbnb listings in São João del-Rei, indicating a high concentration in these sizes.
- A significant 22.1% of listings offer 3+ bedrooms, catering to larger groups and families seeking more space in São João del-Rei.
São João del-Rei Vacation Rental Guest Capacity Trends (2026)
Distribution of Listings by Guest Capacity
Guest Capacity Insights for São João del-Rei
- The most common guest capacity trend in São João del-Rei vacation rentals is listings accommodating 8+ guests (17.3%). This suggests the primary traveler segment is likely larger groups.
- Properties designed for 8+ guests and 2 guests dominate the São João del-Rei STR market, accounting for 34.2% of listings.
- 30.6% of properties accommodate 6+ guests, serving the market segment for larger families or group travel in São João del-Rei.
- On average, properties in São João del-Rei are equipped to host 3.7 guests.
São João del-Rei Airbnb Booking Patterns (2026): Available vs. Booked Days
Available Days Distribution
Booked Days Distribution
Booking Pattern Insights for São João del-Rei
- The most common availability pattern in São João del-Rei falls within the 271-366 days range, representing 70.6% of listings. This suggests many properties have significant open periods on their calendars.
- Approximately 94.0% of listings show high availability (181+ days open annually), indicating potential for increased bookings or specific owner usage patterns.
- For booked days, the 31-90 days range is most frequent in São João del-Rei (37.9%), reflecting common guest stay durations or potential owner blocking patterns.
- A notable 8.1% of properties secure long booking periods (181+ days booked per year), highlighting successful long-term rental strategies or significant owner usage.
São João del-Rei Airbnb Minimum Stay Requirements Analysis
Distribution of Listings by Minimum Night Requirement
1 Night
127 listings
51.2% of total
2 Nights
83 listings
33.5% of total
3 Nights
1 listings
0.4% of total
4-6 Nights
1 listings
0.4% of total
30+ Nights
36 listings
14.5% of total
Key Insights
- The most prevalent minimum stay requirement in São João del-Rei is 1 Night, adopted by 51.2% of listings. This highlights the market's preference for shorter, flexible bookings.
- A strong majority (84.7%) of the São João del-Rei Airbnb data shows acceptance of very short stays (1-2 nights), indicating a dynamic, high-turnover market.
- A significant segment (14.5%) caters to monthly stays (30+ nights) in São João del-Rei, pointing to opportunities in the extended-stay market.
Recommendations
- Align with the market by considering a 1 Night minimum stay, as 51.2% of São João del-Rei hosts use this setting.
- Explore offering discounts for stays of 30+ nights to attract the 14.5% of the market seeking extended stays.
- Adjust minimum nights based on seasonality – potentially shorter during low season and longer during peak demand periods in São João del-Rei.
São João del-Rei Airbnb Cancellation Policy Trends Analysis (2026)
Limited
5 listings
2% of total
Flexible
75 listings
30.7% of total
Moderate
90 listings
36.9% of total
Firm
60 listings
24.6% of total
Strict
14 listings
5.7% of total
Cancellation Policy Insights for São João del-Rei
- The prevailing Airbnb cancellation policy trend in São João del-Rei is Moderate, used by 36.9% of listings.
- There's a relatively balanced mix between guest-friendly (67.6%) and stricter (30.3%) policies, offering choices for different guest needs.
- Strict cancellation policies are quite rare (5.7%), potentially making listings with this policy less competitive unless justified by high demand or property type.
Recommendations for Hosts
- Consider adopting a Moderate policy to align with the 36.9% market standard in São João del-Rei.
- Using a Strict policy might deter some guests, as only 5.7% of listings use it. Evaluate if potential revenue protection outweighs possible lower booking rates.
- Regularly review your cancellation policy against competitors and market demand shifts in São João del-Rei.
São João del-Rei STR Booking Lead Time Analysis (2026)
Average Booking Lead Time by Month
Booking Lead Time Insights for São João del-Rei
- The overall average booking lead time for vacation rentals in São João del-Rei is 30 days.
- Guests book furthest in advance for stays during December (average 50 days), likely coinciding with peak travel demand or local events.
- The shortest booking windows occur for stays in March (average 25 days), indicating more last-minute travel plans during this time.
- Seasonally, Winter (39 days avg.) sees the longest lead times, while Spring (31 days avg.) has the shortest, reflecting typical travel planning cycles.
Recommendations for Hosts
- Use the overall average lead time (30 days) as a baseline for your pricing and availability strategy in São João del-Rei.
- For December stays, consider implementing length-of-stay discounts or slightly higher rates for bookings made less than 50 days out to capitalize on advance planning.
- Target marketing efforts for the Winter season well in advance (at least 39 days) to capture early planners.
- Monitor your own booking lead times against these São João del-Rei averages to identify opportunities for dynamic pricing adjustments.
Popular & Essential Airbnb Amenities in São João del-Rei (2026)
Amenity Prevalence
Amenity Insights for São João del-Rei
- Essential amenities in São João del-Rei that guests expect include: Wifi. Lacking these (this) could significantly impact bookings.
- Popular amenities like Kitchen, TV, Dishes and silverware are common but not universal. Offering these can provide a competitive edge.
Recommendations for Hosts
- Ensure your listing includes all essential amenities for São João del-Rei: Wifi.
- Prioritize adding missing essentials: Wifi.
- Consider adding popular differentiators like Kitchen or TV to increase appeal.
- Highlight unique or less common amenities you offer (e.g., hot tub, dedicated workspace, EV charger) in your listing description and photos.
- Regularly check competitor amenities in São João del-Rei to stay competitive.
São João del-Rei Airbnb Guest Demographics & Profile Analysis (2026)
Guest Profile Summary for São João del-Rei
- The typical guest profile for Airbnb in São João del-Rei consists of primarily domestic travelers (96%), often arriving from nearby Belo Horizonte, typically belonging to the Post-2000s (Gen Z/Alpha) group (50%), primarily speaking Portuguese or English.
- Domestic travelers account for 96.1% of guests.
- Key international markets include Brazil (96.1%) and United States (0.9%).
- Top languages spoken are Portuguese (48.1%) followed by English (27.9%).
- A significant demographic segment is the Post-2000s (Gen Z/Alpha) group, representing 50% of guests.
Recommendations for Hosts
- Target domestic marketing efforts towards travelers from Belo Horizonte and Rio de Janeiro.
- Tailor amenities and listing descriptions to appeal to the dominant Post-2000s (Gen Z/Alpha) demographic (e.g., highlight fast WiFi, smart home features, local guides).
- Highlight unique local experiences or amenities relevant to the primary guest profile.
- Consider seasonal promotions aligned with peak travel times for key origin markets.
Nearby Short-Term Rental Market Comparison
How does the São João del-Rei Airbnb market stack up against its neighbors? Compare key performance metrics like average monthly revenue, ADR, and occupancy rates in surrounding areas to understand the broader regional STR landscape.
| Market | Active Properties | Monthly Revenue | Daily Rate | Avg. Occupancy |
|---|---|---|---|---|
| Areal | 82 | $1,532 | $198.25 | 30% |
| Queluz | 17 | $1,291 | $152.05 | 30% |
| Brazópolis | 21 | $1,209 | $152.11 | 29% |
| Rio de Janeiro | 27,660 | $1,085 | $106.45 | 43% |
| Paraisópolis | 104 | $1,004 | $108.16 | 32% |
| Campos do Jordão | 3,374 | $1,000 | $150.82 | 30% |
| Gonçalves | 507 | $972 | $124.54 | 30% |
| Nova Lima | 172 | $965 | $108.86 | 37% |
| Petrópolis | 2,096 | $964 | $143.70 | 27% |
| Córrego do Bom Jesus | 116 | $952 | $89.00 | 37% |