Araruna Airbnb Market Analysis 2026: Short Term Rental Data & Vacation Rental Statistics in Paraíba, Brazil
Is Airbnb profitable in Araruna in 2026? Explore comprehensive Airbnb analytics for Araruna, Paraíba, Brazil to uncover income potential. This 2026 STR market report for Araruna, based on AirROI data from February 2025 to January 2026, reveals key trends in the niche market of 19 active listings.
Whether you're considering an Airbnb investment in Araruna, optimizing your existing vacation rental, or exploring rental arbitrage opportunities, understanding the Araruna Airbnb data is crucial. Leveraging the low regulation environment is key to maximizing your short term rental income potential. Let's dive into the specifics.
Key Araruna Airbnb Performance Metrics Overview
Monthly Airbnb Revenue Variations & Income Potential in Araruna (2026)
Understanding the monthly revenue variations for Airbnb listings in Araruna is key to maximizing your short term rental income potential. Seasonality significantly impacts earnings. Our analysis, based on data from the past 12 months, shows that the peak revenue month for STRs in Araruna is typically July, while February often presents the lowest earnings, highlighting opportunities for strategic pricing adjustments during shoulder and low seasons. Explore the typical Airbnb income in Araruna across different performance tiers:
- Best-in-class properties (Top 10%) achieve $895+ monthly, often utilizing dynamic pricing and superior guest experiences.
- Strong performing properties (Top 25%) earn $486 or more, indicating effective management and desirable locations/amenities.
- Typical properties (Median) generate around $226 per month, representing the average market performance.
- Entry-level properties (Bottom 25%) see earnings around $124, often with potential for optimization.
Average Monthly Airbnb Earnings Trend in Araruna
Araruna Airbnb Occupancy Rate Trends (2026)
Maximize your bookings by understanding the Araruna STR occupancy trends. Seasonal demand shifts significantly influence how often properties are booked. Typically, Junesees the highest demand (peak season occupancy), while February experiences the lowest (low season). Effective strategies, like adjusting minimum stays or offering promotions, can boost occupancy during slower periods. Here's how different property tiers perform in Araruna:
- Best-in-class properties (Top 10%) achieve 33%+ occupancy, indicating high desirability and potentially optimized availability.
- Strong performing properties (Top 25%) maintain 25% or higher occupancy, suggesting good market fit and guest satisfaction.
- Typical properties (Median) have an occupancy rate around 16%.
- Entry-level properties (Bottom 25%) average 8% occupancy, potentially facing higher vacancy.
Average Monthly Occupancy Rate Trend in Araruna
Average Daily Rate (ADR) Airbnb Trends in Araruna (2026)
Effective short term rental pricing strategy in Araruna involves understanding monthly ADR fluctuations. The Average Daily Rate (ADR) for Airbnb in Araruna typically peaks in January and dips lowest during February. Leveraging Airbnb dynamic pricing tools or strategies based on this seasonality can significantly boost revenue. Here's a look at the typical nightly rates achieved:
- Best-in-class properties (Top 10%) command rates of $82+ per night, often due to premium features or locations.
- Strong performing properties (Top 25%) achieve nightly rates of $69 or more.
- Typical properties (Median) charge around $48 per night.
- Entry-level properties (Bottom 25%) earn around $39 per night.
Average Daily Rate (ADR) Trend by Month in Araruna
Get Live Araruna Market Intelligence 👇

Explore Real-time Analytics
Airbnb Seasonality Analysis & Trends in Araruna (2026)
Peak Season (July, August, June)
- Revenue averages $516 per month
- Occupancy rates average 22.3%
- Daily rates average $59
Shoulder Season
- Revenue averages $356 per month
- Occupancy maintains around 17.4%
- Daily rates hold near $61
Low Season (February, April, October)
- Revenue drops to average $229 per month
- Occupancy decreases to average 14.7%
- Daily rates adjust to average $57
Seasonality Insights for Araruna
- The Airbnb seasonality in Araruna shows highly seasonal trends requiring careful strategy. While the sections above show seasonal averages, it's also insightful to look at the extremes:
- During the high season, the absolute peak month showcases Araruna's highest earning potential, with monthly revenues capable of climbing to $567, occupancy reaching a high of 24.6%, and ADRs peaking at $64.
- Conversely, the slowest single month of the year, typically falling within the low season, marks the market's lowest point. In this month, revenue might dip to $162, occupancy could drop to 11.4%, and ADRs may adjust down to $54.
- Understanding both the seasonal averages and these monthly peaks and troughs in revenue, occupancy, and ADR is crucial for maximizing your Airbnb profit potential in Araruna.
Seasonal Strategies for Maximizing Profit
- Peak Season: Maximize revenue through premium pricing and potentially longer minimum stays. Ensure high availability.
- Low Season: Offer competitive pricing, special promotions (e.g., extended stay discounts), and flexible cancellation policies. Target off-season travelers like remote workers or budget-conscious guests.
- Shoulder Seasons: Implement dynamic pricing that balances peak and low rates. Target weekend travelers or specific events. Offer slightly more flexible terms than peak season.
- Regularly analyze your own performance against these Araruna seasonality benchmarks and adjust your pricing and availability strategy accordingly.
Best Areas for Airbnb Investment in Araruna (2026)
Exploring the top neighborhoods for short-term rentals in Araruna? This section highlights key areas, outlining why they are attractive for hosts and guests, along with notable local attractions. Consider these locations based on your target guest profile and investment strategy.
| Neighborhood / Area | Why Host Here? (Target Guests & Appeal) | Key Attractions & Landmarks |
|---|---|---|
| Centro | The heart of Araruna, rich in culture and history, perfect for tourists wanting to explore local attractions. | Igreja Matriz de Araruna, Araruna Historical Museum, Municipal Market, Cultural Events, Local Cuisine |
| Praça do Coreto | A lively square known for its events and gatherings, making it an ideal spot for short-term rentals during festivals and local activities. | Coreto, Local Festivals, Nearby Cafes, Artisans Market |
| Bairro São José | A charming neighborhood that offers a mix of local living and proximity to key amenities, favorable for families and longer stays. | Local Shops, Nearby Parks, Cafes and Restaurants, Friendly Atmosphere |
| Serra do Teimoso | A natural area close to Araruna, popular with tourists seeking outdoor adventures and eco-tourism. | Hiking Trails, Scenic Views, Sustainable Tourism, Wildlife Watching |
| Bairro São Vicente | A residential area that provides a quiet ambiance, appealing to those looking for peace yet still close to the city center. | Local Markets, Parks, Community Events |
| Caldos de São João | A spa town nearby, famous for its mineral waters and wellness tourism, attracting visitors seeking relaxation and health benefits. | Thermal Springs, Wellness Programs, Nature Walks |
| Bairro São Pedro | A vibrant community area with a mix of locals and visitors, suitable for guests looking for a local experience but with modern amenities. | Bars and Restaurants, Local Festivals, Community Engagement |
| Rural Areas | The rural outskirts of Araruna offer a tranquil escape with beautiful landscapes, ideal for guests wanting a unique experience away from the city. | Agricultural Tours, Scenic Landscapes, Local Farms, Traditional Crafts |
Understanding Airbnb License Requirements & STR Laws in Araruna (2026)
While Araruna, Paraíba, Brazil currently shows low STR regulations, specific Airbnb license requirements might still exist or change. Always verify the latest short term rental regulations and Airbnb license requirements directly with local government authorities for Araruna to ensure full compliance before hosting.
(Source: AirROI data, 2026, finding no licensed listings among those analyzed)
Top Performing Airbnb Properties in Araruna (2026)
Benchmark your potential! Explore examples of top-performing Airbnb properties in Ararunabased on Trailing Twelve Month (TTM) revenue. Analyze their characteristics, revenue, occupancy rate, and ADR to understand what drives success in this market.
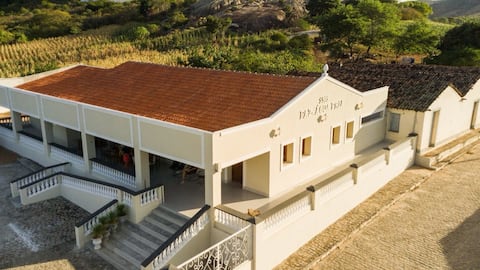
Água Fria Farm
Entire Place • 4 bedrooms
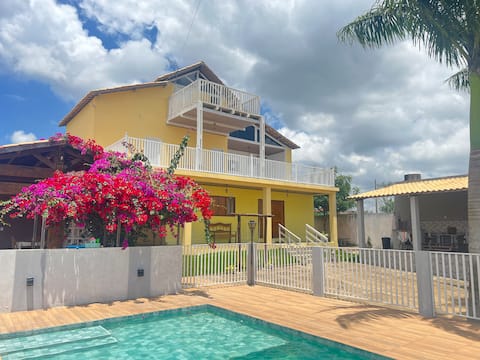
House in the mountains in Araruna PB
Entire Place • 5 bedrooms
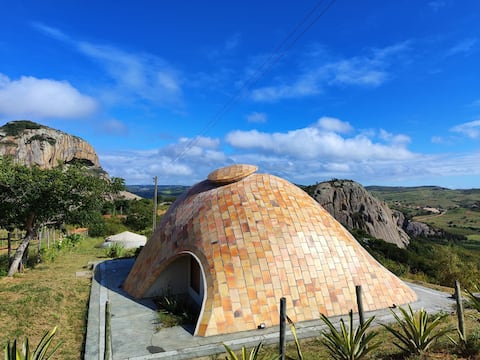
Oka Chalé: A romantic nest.
Entire Place • 1 bedroom
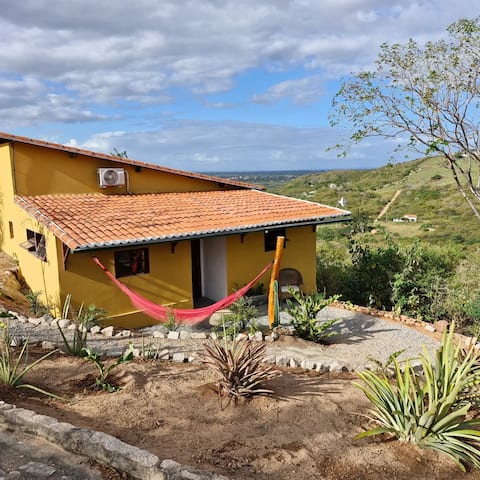
full chalet in the mountains!
Entire Place • 1 bedroom
Pousada Chalés das Pedras-Araruna/PB (Pedras-Araruna/PB Inn)
Private Room • N/A

Mirante Serraruna - Penthouse with 360° view
Entire Place • 1 bedroom
Note: Performance varies based on location, size, amenities, seasonality, and management quality. Data reflects the past 12 months.
Top Performing Airbnb Hosts in Araruna (2026)
Learn from the best! This table showcases top-performing Airbnb hosts in Araruna based on the number of properties managed and estimated total revenue over the past year. Analyze their scale and performance metrics.
| Host Name | Properties | Grossing Revenue | Stay Reviews | Avg Rating |
|---|---|---|---|---|
| Celso | 1 | $12,837 | 2 | Not Rated |
| Casa Da Serra Araruna | 1 | $11,027 | 28 | 4.96/5.0 |
| Castelliano | 5 | $6,609 | 119 | 4.96/5.0 |
| Antonio | 2 | $5,955 | 12 | 5.00/5.0 |
| Osvaldo | 1 | $4,944 | 61 | 4.95/5.0 |
| Jairo Gualberto | 2 | $4,604 | 54 | 4.95/5.0 |
| Lenin | 2 | $3,804 | 54 | 5.00/5.0 |
| Marco Taveira | 1 | $3,193 | 45 | 4.96/5.0 |
| Marta | 1 | $1,447 | 11 | 4.91/5.0 |
| Clodomar | 2 | $453 | 3 | Not Rated |
Analyzing the strategies of top hosts, such as their property selection, pricing, and guest communication, can offer valuable lessons for optimizing your own Airbnb operations in Araruna.
Dive Deeper: Advanced Araruna STR Market Data (2026)
Ready to unlock more insights? AirROI provides access to advanced metrics and comprehensive Airbnb data for Araruna. Explore detailed analytics beyond this report to refine your investment strategy, optimize pricing, and maximize your vacation rental profits.
Explore Advanced MetricsAraruna Short-Term Rental Market Composition (2026): Property & Room Types
Room Type Distribution
Property Type Distribution
Market Composition Insights for Araruna
- The Araruna Airbnb market composition is heavily skewed towards Private Room listings, which make up 52.6% of the 19 active rentals. This indicates strong guest preference for privacy and space.
- Looking at the property type distribution in Araruna, Hotel/Boutique properties are the most common (36.8%), reflecting the local real estate landscape.
- Houses represent a significant 15.8% portion, catering likely to families or larger groups.
- The presence of 36.8% Hotel/Boutique listings indicates integration with traditional hospitality.
Araruna Airbnb Room Capacity Analysis (2026): Bedroom Distribution
Distribution of Listings by Number of Bedrooms
Room Capacity Insights for Araruna
- The dominant room capacity in Araruna is 1 bedroom listings, making up 42.1% of the market. This suggests a strong demand for properties suitable for couples or solo travelers.
- Together, 1 bedroom and 2 bedrooms properties represent 47.4% of the active Airbnb listings in Araruna, indicating a high concentration in these sizes.
Araruna Vacation Rental Guest Capacity Trends (2026)
Distribution of Listings by Guest Capacity
Guest Capacity Insights for Araruna
- The most common guest capacity trend in Araruna vacation rentals is listings accommodating 2 guests (26.3%). This suggests the primary traveler segment is likely couples or solo travelers.
- Properties designed for 2 guests and 8+ guests dominate the Araruna STR market, accounting for 42.1% of listings.
- 15.8% of properties accommodate 6+ guests, serving the market segment for larger families or group travel in Araruna.
- On average, properties in Araruna are equipped to host 2.3 guests.
Araruna Airbnb Booking Patterns (2026): Available vs. Booked Days
Available Days Distribution
Booked Days Distribution
Booking Pattern Insights for Araruna
- The most common availability pattern in Araruna falls within the 271-366 days range, representing 94.7% of listings. This suggests many properties have significant open periods on their calendars.
- Approximately 100.0% of listings show high availability (181+ days open annually), indicating potential for increased bookings or specific owner usage patterns.
- For booked days, the 31-90 days range is most frequent in Araruna (57.9%), reflecting common guest stay durations or potential owner blocking patterns.
Araruna Airbnb Minimum Stay Requirements Analysis
Distribution of Listings by Minimum Night Requirement
1 Night
14 listings
73.7% of total
2 Nights
2 listings
10.5% of total
30+ Nights
3 listings
15.8% of total
Key Insights
- The most prevalent minimum stay requirement in Araruna is 1 Night, adopted by 73.7% of listings. This highlights the market's preference for shorter, flexible bookings.
- A strong majority (84.2%) of the Araruna Airbnb data shows acceptance of very short stays (1-2 nights), indicating a dynamic, high-turnover market.
- A significant segment (15.8%) caters to monthly stays (30+ nights) in Araruna, pointing to opportunities in the extended-stay market.
Recommendations
- Align with the market by considering a 1 Night minimum stay, as 73.7% of Araruna hosts use this setting.
- Explore offering discounts for stays of 30+ nights to attract the 15.8% of the market seeking extended stays.
- Adjust minimum nights based on seasonality – potentially shorter during low season and longer during peak demand periods in Araruna.
Araruna Airbnb Cancellation Policy Trends Analysis (2026)
Flexible
11 listings
57.9% of total
Moderate
5 listings
26.3% of total
Firm
3 listings
15.8% of total
Cancellation Policy Insights for Araruna
- The prevailing Airbnb cancellation policy trend in Araruna is Flexible, used by 57.9% of listings.
- The market strongly favors guest-friendly terms, with 84.2% of listings offering Flexible or Moderate policies. This suggests guests in Araruna may expect booking flexibility.
Recommendations for Hosts
- Consider adopting a Flexible policy to align with the 57.9% market standard in Araruna.
- Given the high prevalence of Flexible policies (57.9%), offering this can enhance booking appeal, especially during shoulder seasons.
- Regularly review your cancellation policy against competitors and market demand shifts in Araruna.
Araruna STR Booking Lead Time Analysis (2026)
Average Booking Lead Time by Month
Booking Lead Time Insights for Araruna
- The overall average booking lead time for vacation rentals in Araruna is 27 days.
- Guests book furthest in advance for stays during October (average 42 days), likely coinciding with peak travel demand or local events.
- The shortest booking windows occur for stays in September (average 17 days), indicating more last-minute travel plans during this time.
- Seasonally, Fall (32 days avg.) sees the longest lead times, while Summer (26 days avg.) has the shortest, reflecting typical travel planning cycles.
Recommendations for Hosts
- Use the overall average lead time (27 days) as a baseline for your pricing and availability strategy in Araruna.
- For October stays, consider implementing length-of-stay discounts or slightly higher rates for bookings made less than 42 days out to capitalize on advance planning.
- Target marketing efforts for the Fall season well in advance (at least 32 days) to capture early planners.
- Monitor your own booking lead times against these Araruna averages to identify opportunities for dynamic pricing adjustments.
Popular & Essential Airbnb Amenities in Araruna (2026)
Amenity Prevalence
Amenity Insights for Araruna
- Essential amenities in Araruna that guests expect include: Wifi. Lacking these (this) could significantly impact bookings.
- Popular amenities like Free parking on premises, Kitchen, Air conditioning are common but not universal. Offering these can provide a competitive edge.
Recommendations for Hosts
- Ensure your listing includes all essential amenities for Araruna: Wifi.
- Consider adding popular differentiators like Free parking on premises or Kitchen to increase appeal.
- Highlight unique or less common amenities you offer (e.g., hot tub, dedicated workspace, EV charger) in your listing description and photos.
- Regularly check competitor amenities in Araruna to stay competitive.
Araruna Airbnb Guest Demographics & Profile Analysis (2026)
Guest Profile Summary for Araruna
- The typical guest profile for Airbnb in Araruna consists of primarily domestic travelers (98%), often arriving from nearby Natal, typically belonging to the Post-2000s (Gen Z/Alpha) group (50%), primarily speaking Portuguese or English.
- Domestic travelers account for 97.9% of guests.
- Key international markets include Brazil (97.9%) and United States (2.1%).
- Top languages spoken are Portuguese (65.2%) followed by English (26.1%).
- A significant demographic segment is the Post-2000s (Gen Z/Alpha) group, representing 50% of guests.
Recommendations for Hosts
- Target domestic marketing efforts towards travelers from Natal and João Pessoa.
- Tailor amenities and listing descriptions to appeal to the dominant Post-2000s (Gen Z/Alpha) demographic (e.g., highlight fast WiFi, smart home features, local guides).
- Highlight unique local experiences or amenities relevant to the primary guest profile.
- Consider seasonal promotions aligned with peak travel times for key origin markets.
Nearby Short-Term Rental Market Comparison
How does the Araruna Airbnb market stack up against its neighbors? Compare key performance metrics like average monthly revenue, ADR, and occupancy rates in surrounding areas to understand the broader regional STR landscape.
| Market | Active Properties | Monthly Revenue | Daily Rate | Avg. Occupancy |
|---|---|---|---|---|
| Ceará-Mirim | 33 | $1,211 | $232.73 | 23% |
| Bananeiras | 228 | $720 | $130.54 | 24% |
| Tibau do Sul | 1,407 | $717 | $90.98 | 33% |
| Camaragibe | 28 | $680 | $118.56 | 27% |
| Areia | 25 | $576 | $80.31 | 27% |
| Extremoz | 40 | $547 | $131.07 | 23% |
| João Pessoa | 4,825 | $539 | $61.10 | 38% |
| Parnamirim | 317 | $513 | $87.28 | 28% |
| São Miguel do Gostoso | 280 | $502 | $98.86 | 24% |
| Touros | 96 | $458 | $111.03 | 22% |