Lapa Airbnb Market Analysis 2025: Short Term Rental Data & Vacation Rental Statistics in Paraná, Brazil
Is Airbnb profitable in Lapa in 2025? Explore comprehensive Airbnb analytics for Lapa, Paraná, Brazil to uncover income potential. This 2025 STR market report for Lapa, based on AirROI data from November 2024 to October 2025, reveals key trends in the niche market of 17 active listings.
Whether you're considering an Airbnb investment in Lapa, optimizing your existing vacation rental, or exploring rental arbitrage opportunities, understanding the Lapa Airbnb data is crucial. Leveraging the low regulation environment is key to maximizing your short term rental income potential. Let's dive into the specifics.
Key Lapa Airbnb Performance Metrics Overview
Monthly Airbnb Revenue Variations & Income Potential in Lapa (2025)
Understanding the monthly revenue variations for Airbnb listings in Lapa is key to maximizing your short term rental income potential. Seasonality significantly impacts earnings. Our analysis, based on data from the past 12 months, shows that the peak revenue month for STRs in Lapa is typically January, while September often presents the lowest earnings, highlighting opportunities for strategic pricing adjustments during shoulder and low seasons. Explore the typical Airbnb income in Lapa across different performance tiers:
- Best-in-class properties (Top 10%) achieve $498+ monthly, often utilizing dynamic pricing and superior guest experiences.
- Strong performing properties (Top 25%) earn $307 or more, indicating effective management and desirable locations/amenities.
- Typical properties (Median) generate around $186 per month, representing the average market performance.
- Entry-level properties (Bottom 25%) see earnings around $86, often with potential for optimization.
Average Monthly Airbnb Earnings Trend in Lapa
Lapa Airbnb Occupancy Rate Trends (2025)
Maximize your bookings by understanding the Lapa STR occupancy trends. Seasonal demand shifts significantly influence how often properties are booked. Typically, Januarysees the highest demand (peak season occupancy), while September experiences the lowest (low season). Effective strategies, like adjusting minimum stays or offering promotions, can boost occupancy during slower periods. Here's how different property tiers perform in Lapa:
- Best-in-class properties (Top 10%) achieve 40%+ occupancy, indicating high desirability and potentially optimized availability.
- Strong performing properties (Top 25%) maintain 21% or higher occupancy, suggesting good market fit and guest satisfaction.
- Typical properties (Median) have an occupancy rate around 13%.
- Entry-level properties (Bottom 25%) average 7% occupancy, potentially facing higher vacancy.
Average Monthly Occupancy Rate Trend in Lapa
Average Daily Rate (ADR) Airbnb Trends in Lapa (2025)
Effective short term rental pricing strategy in Lapa involves understanding monthly ADR fluctuations. The Average Daily Rate (ADR) for Airbnb in Lapa typically peaks in September and dips lowest during February. Leveraging Airbnb dynamic pricing tools or strategies based on this seasonality can significantly boost revenue. Here's a look at the typical nightly rates achieved:
- Best-in-class properties (Top 10%) command rates of $77+ per night, often due to premium features or locations.
- Strong performing properties (Top 25%) achieve nightly rates of $55 or more.
- Typical properties (Median) charge around $43 per night.
- Entry-level properties (Bottom 25%) earn around $34 per night.
Average Daily Rate (ADR) Trend by Month in Lapa
Get Live Lapa Market Intelligence 👇

Explore Real-time Analytics
Airbnb Seasonality Analysis & Trends in Lapa (2025)
Peak Season (January, November, December)
- Revenue averages $409 per month
- Occupancy rates average 24.0%
- Daily rates average $44
Shoulder Season
- Revenue averages $226 per month
- Occupancy maintains around 15.5%
- Daily rates hold near $46
Low Season (June, July, September)
- Revenue drops to average $141 per month
- Occupancy decreases to average 12.2%
- Daily rates adjust to average $51
Seasonality Insights for Lapa
- The Airbnb seasonality in Lapa shows highly seasonal trends requiring careful strategy. While the sections above show seasonal averages, it's also insightful to look at the extremes:
- During the high season, the absolute peak month showcases Lapa's highest earning potential, with monthly revenues capable of climbing to $513, occupancy reaching a high of 28.8%, and ADRs peaking at $52.
- Conversely, the slowest single month of the year, typically falling within the low season, marks the market's lowest point. In this month, revenue might dip to $99, occupancy could drop to 6.7%, and ADRs may adjust down to $42.
- Understanding both the seasonal averages and these monthly peaks and troughs in revenue, occupancy, and ADR is crucial for maximizing your Airbnb profit potential in Lapa.
Seasonal Strategies for Maximizing Profit
- Peak Season: Maximize revenue through premium pricing and potentially longer minimum stays. Ensure high availability.
- Low Season: Offer competitive pricing, special promotions (e.g., extended stay discounts), and flexible cancellation policies. Target off-season travelers like remote workers or budget-conscious guests.
- Shoulder Seasons: Implement dynamic pricing that balances peak and low rates. Target weekend travelers or specific events. Offer slightly more flexible terms than peak season.
- Regularly analyze your own performance against these Lapa seasonality benchmarks and adjust your pricing and availability strategy accordingly.
Best Areas for Airbnb Investment in Lapa (2025)
Exploring the top neighborhoods for short-term rentals in Lapa? This section highlights key areas, outlining why they are attractive for hosts and guests, along with notable local attractions. Consider these locations based on your target guest profile and investment strategy.
| Neighborhood / Area | Why Host Here? (Target Guests & Appeal) | Key Attractions & Landmarks |
|---|---|---|
| Centro | The central area of Lapa, featuring a mix of cultural, historical, and commercial attractions. Ideal for travelers looking to explore local life with plenty of restaurants, markets, and historical sites. | Lapa Arches, Selarón Steps, Municipal Theatre of Rio de Janeiro, Lapa nightlife, Cultural Center of the Judiciary |
| Santa Teresa | A charming and artistic neighborhood with picturesque streets, known for its bohemian vibe and cultural events. Popular with tourists seeking a unique, authentic Brazilian experience. | Santa Teresa Tram, Parque das Ruínas, Museu Chácara do Céu, Art galleries, Local artisan shops |
| Glória | Located near Lapa, this neighborhood has a mix of residential and cultural elements, making it appealing for those who want a local experience close to urban amenities. | Glória Beach, Catedral de São Sebastião, Local markets, Cafes and restaurants, Cultural festivals |
| Catete | A historic neighborhood with a local feel, Catete offers parks, museums, and a less touristy experience. It has a vibrant community and is close to attractions like the Flamengo Park. | Flamengo Park, Museu da República, Palácio do Catete, Art galleries, Street art |
| Botafogo | Famous for its beach, shopping, and dining, Botafogo is an attractive area for both leisure and business travelers looking for a bustling urban environment. | Botafogo Beach, Shopping Botafogo, Cinemas, Restaurants with sea views, Parque Natural Municipal da Catacumba |
| Copacabana | Iconic beach destination known for its vibrant atmosphere and extensive tourist facilities. A very popular choice for hosting Airbnb rentals due to high demand. | Copacabana Beach, Forte de Copacabana, Avenida Atlântica, Beach kiosks, Nightlife |
| Ipanema | Famous for its stunning beach and upscale lifestyle, Ipanema attracts affluent tourists looking for luxury accommodations and lifestyle experiences. | Ipanema Beach, Arpoador, Feira de Ipanema, Shopping and dining, Cultural events |
| Leblon | An upscale neighborhood known for its luxurious properties and exclusive vibe. Ideal for high-end travelers looking for more privacy and comfort during their stay. | Leblon Beach, Shopping Leblon, Fine dining, Beautiful parks, Cultural attractions |
Understanding Airbnb License Requirements & STR Laws in Lapa (2025)
While Lapa, Paraná, Brazil currently shows low STR regulations, specific Airbnb license requirements might still exist or change. Always verify the latest short term rental regulations and Airbnb license requirements directly with local government authorities for Lapa to ensure full compliance before hosting.
(Source: AirROI data, 2025, finding no licensed listings among those analyzed)
Top Performing Airbnb Properties in Lapa (2025)
Benchmark your potential! Explore examples of top-performing Airbnb properties in Lapabased on Trailing Twelve Month (TTM) revenue. Analyze their characteristics, revenue, occupancy rate, and ADR to understand what drives success in this market.
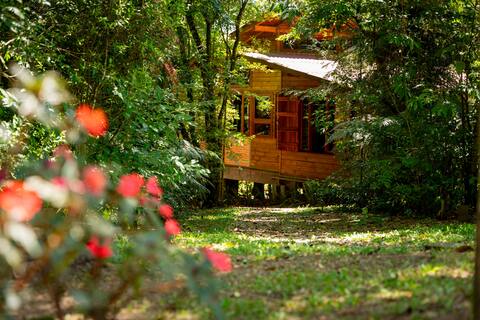
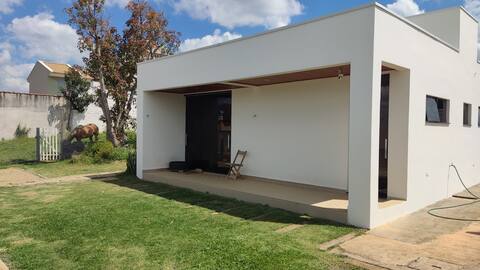
Casa na Mata
Entire Place • 2 bedrooms
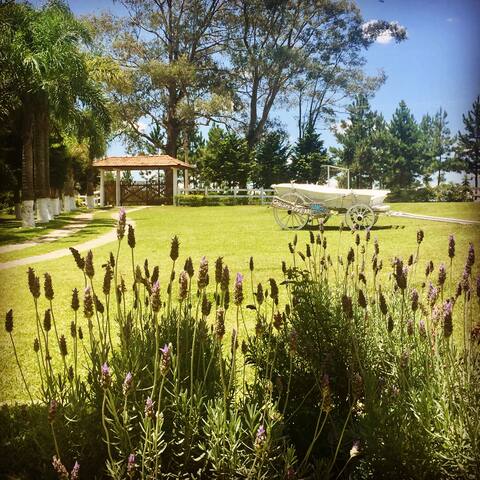
Beautiful Chácara Vovo Ari with pool and great location
Entire Place • 6 bedrooms
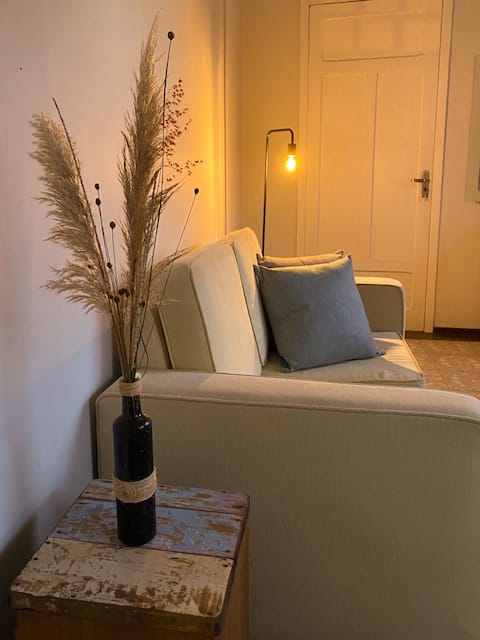
Historic room
Private Room • 2 bedrooms
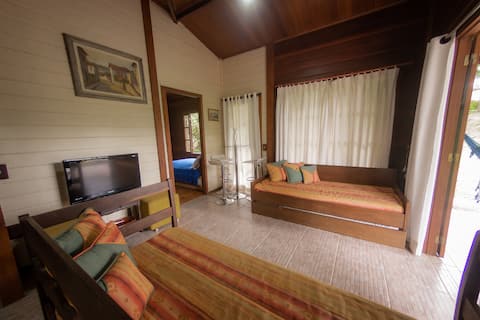
Farm with complete leisure and Wi-Fi in Lapa/PR
Entire Place • 3 bedrooms
Simple life and natural beauty.
Entire Place • 1 bedroom
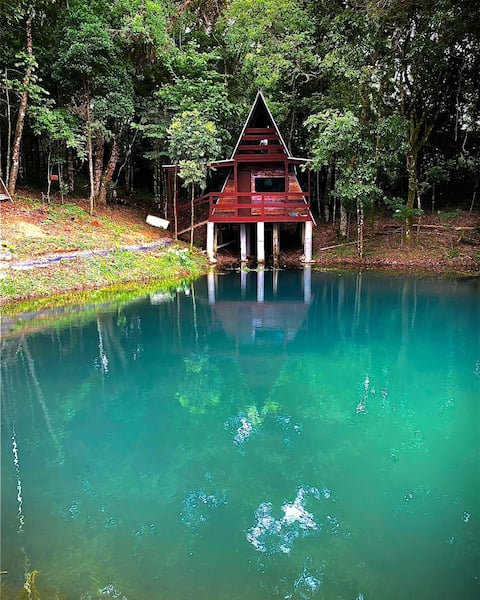
Chalé do Lagoo
Entire Place • 1 bedroom
Note: Performance varies based on location, size, amenities, seasonality, and management quality. Data reflects the past 12 months.
Top Performing Airbnb Hosts in Lapa (2025)
Learn from the best! This table showcases top-performing Airbnb hosts in Lapa based on the number of properties managed and estimated total revenue over the past year. Analyze their scale and performance metrics.
| Host Name | Properties | Grossing Revenue | Stay Reviews | Avg Rating |
|---|---|---|---|---|
| Teresa Maria | 1 | $6,056 | 27 | 5.00/5.0 |
| Leonardo | 3 | $5,632 | 90 | 4.95/5.0 |
| Patrícia | 1 | $5,185 | 2 | Not Rated |
| Junior Nascimento | 2 | $4,253 | 71 | 4.92/5.0 |
| Lígia | 2 | $4,241 | 69 | 5.00/5.0 |
| Paulo | 4 | $3,883 | 32 | 4.78/5.0 |
| Anfitrião Prime | 1 | $2,866 | 4 | 5.00/5.0 |
| Bruno | 1 | $2,417 | 6 | 5.00/5.0 |
| Márcio Assad | 1 | $856 | 11 | 4.82/5.0 |
| Fabíola | 1 | $747 | 6 | 4.67/5.0 |
Analyzing the strategies of top hosts, such as their property selection, pricing, and guest communication, can offer valuable lessons for optimizing your own Airbnb operations in Lapa.
Dive Deeper: Advanced Lapa STR Market Data (2025)
Ready to unlock more insights? AirROI provides access to advanced metrics and comprehensive Airbnb data for Lapa. Explore detailed analytics beyond this report to refine your investment strategy, optimize pricing, and maximize your vacation rental profits.
Explore Advanced MetricsLapa Short-Term Rental Market Composition (2025): Property & Room Types
Room Type Distribution
Property Type Distribution
Market Composition Insights for Lapa
- The Lapa Airbnb market composition is heavily skewed towards Entire Home/Apt listings, which make up 70.6% of the 17 active rentals. This indicates strong guest preference for privacy and space.
- Looking at the property type distribution in Lapa, House properties are the most common (58.8%), reflecting the local real estate landscape.
- Houses represent a significant 58.8% portion, catering likely to families or larger groups.
- The presence of 11.8% Hotel/Boutique listings indicates integration with traditional hospitality.
Lapa Airbnb Room Capacity Analysis (2025): Bedroom Distribution
Distribution of Listings by Number of Bedrooms
Room Capacity Insights for Lapa
- The dominant room capacity in Lapa is 1 bedroom listings, making up 47.1% of the market. This suggests a strong demand for properties suitable for couples or solo travelers.
- Together, 1 bedroom and 2 bedrooms properties represent 76.5% of the active Airbnb listings in Lapa, indicating a high concentration in these sizes.
Lapa Vacation Rental Guest Capacity Trends (2025)
Distribution of Listings by Guest Capacity
Guest Capacity Insights for Lapa
- The most common guest capacity trend in Lapa vacation rentals is listings accommodating 3 guests (29.4%). This suggests the primary traveler segment is likely small families or groups.
- Properties designed for 3 guests and 4 guests dominate the Lapa STR market, accounting for 47.0% of listings.
- 11.8% of properties accommodate 6+ guests, serving the market segment for larger families or group travel in Lapa.
- On average, properties in Lapa are equipped to host 3.1 guests.
Lapa Airbnb Booking Patterns (2025): Available vs. Booked Days
Available Days Distribution
Booked Days Distribution
Booking Pattern Insights for Lapa
- The most common availability pattern in Lapa falls within the 271-366 days range, representing 100% of listings. This suggests many properties have significant open periods on their calendars.
- Approximately 100.0% of listings show high availability (181+ days open annually), indicating potential for increased bookings or specific owner usage patterns.
- For booked days, the 31-90 days range is most frequent in Lapa (76.5%), reflecting common guest stay durations or potential owner blocking patterns.
Lapa Airbnb Minimum Stay Requirements Analysis
Distribution of Listings by Minimum Night Requirement
1 Night
15 listings
88.2% of total
2 Nights
1 listings
5.9% of total
30+ Nights
1 listings
5.9% of total
Key Insights
- The most prevalent minimum stay requirement in Lapa is 1 Night, adopted by 88.2% of listings. This highlights the market's preference for shorter, flexible bookings.
- A strong majority (94.1%) of the Lapa Airbnb data shows acceptance of very short stays (1-2 nights), indicating a dynamic, high-turnover market.
Recommendations
- Align with the market by considering a 1 Night minimum stay, as 88.2% of Lapa hosts use this setting.
- Explore offering discounts for stays of 30+ nights to attract the 5.9% of the market seeking extended stays.
- Adjust minimum nights based on seasonality – potentially shorter during low season and longer during peak demand periods in Lapa.
Lapa Airbnb Cancellation Policy Trends Analysis (2025)
Flexible
8 listings
47.1% of total
Moderate
7 listings
41.2% of total
Firm
1 listings
5.9% of total
Strict
1 listings
5.9% of total
Cancellation Policy Insights for Lapa
- The prevailing Airbnb cancellation policy trend in Lapa is Flexible, used by 47.1% of listings.
- The market strongly favors guest-friendly terms, with 88.3% of listings offering Flexible or Moderate policies. This suggests guests in Lapa may expect booking flexibility.
- Strict cancellation policies are quite rare (5.9%), potentially making listings with this policy less competitive unless justified by high demand or property type.
Recommendations for Hosts
- Consider adopting a Flexible policy to align with the 47.1% market standard in Lapa.
- Using a Strict policy might deter some guests, as only 5.9% of listings use it. Evaluate if potential revenue protection outweighs possible lower booking rates.
- Regularly review your cancellation policy against competitors and market demand shifts in Lapa.
Lapa STR Booking Lead Time Analysis (2025)
Average Booking Lead Time by Month
Booking Lead Time Insights for Lapa
- The overall average booking lead time for vacation rentals in Lapa is 22 days.
- Guests book furthest in advance for stays during November (average 46 days), likely coinciding with peak travel demand or local events.
- The shortest booking windows occur for stays in August (average 6 days), indicating more last-minute travel plans during this time.
- Seasonally, Fall (29 days avg.) sees the longest lead times, while Summer (9 days avg.) has the shortest, reflecting typical travel planning cycles.
Recommendations for Hosts
- Use the overall average lead time (22 days) as a baseline for your pricing and availability strategy in Lapa.
- For November stays, consider implementing length-of-stay discounts or slightly higher rates for bookings made less than 46 days out to capitalize on advance planning.
- During August, focus on last-minute booking availability and promotions, as guests book with very short notice (6 days avg.).
- Target marketing efforts for the Fall season well in advance (at least 29 days) to capture early planners.
- Monitor your own booking lead times against these Lapa averages to identify opportunities for dynamic pricing adjustments.
Popular & Essential Airbnb Amenities in Lapa (2025)
Amenity Prevalence
Amenity Insights for Lapa
- Essential amenities in Lapa that guests expect include: TV. Lacking these (this) could significantly impact bookings.
- Popular amenities like Wifi, Free parking on premises, Kitchen are common but not universal. Offering these can provide a competitive edge.
- Warning: Wifi is not universally provided but is considered essential globally. Ensure reliable Wifi is offered.
Recommendations for Hosts
- Ensure your listing includes all essential amenities for Lapa: TV.
- Consider adding popular differentiators like Wifi or Free parking on premises to increase appeal.
- Highlight unique or less common amenities you offer (e.g., hot tub, dedicated workspace, EV charger) in your listing description and photos.
- Regularly check competitor amenities in Lapa to stay competitive.
Lapa Airbnb Guest Demographics & Profile Analysis (2025)
Guest Profile Summary for Lapa
- The typical guest profile for Airbnb in Lapa consists of primarily domestic travelers (100%), often arriving from nearby Curitiba, typically belonging to the Post-2000s (Gen Z/Alpha) group (50%), primarily speaking Portuguese or English.
- Domestic travelers account for 100.0% of guests.
- Top languages spoken are Portuguese (54.8%) followed by English (29%).
- A significant demographic segment is the Post-2000s (Gen Z/Alpha) group, representing 50% of guests.
Recommendations for Hosts
- Target domestic marketing efforts towards travelers from Curitiba and Paraná.
- Tailor amenities and listing descriptions to appeal to the dominant Post-2000s (Gen Z/Alpha) demographic (e.g., highlight fast WiFi, smart home features, local guides).
- Highlight unique local experiences or amenities relevant to the primary guest profile.
- Consider seasonal promotions aligned with peak travel times for key origin markets.
Nearby Short-Term Rental Market Comparison
How does the Lapa Airbnb market stack up against its neighbors? Compare key performance metrics like average monthly revenue, ADR, and occupancy rates in surrounding areas to understand the broader regional STR landscape.
| Market | Active Properties | Monthly Revenue | Daily Rate | Avg. Occupancy |
|---|---|---|---|---|
| Almirante Tamandaré | 16 | $1,341 | $118.94 | 40% |
| Campo Magro | 22 | $1,218 | $131.10 | 34% |
| Quatro Barras | 35 | $1,175 | $156.39 | 31% |
| Rio dos Cedros | 141 | $1,055 | $143.76 | 28% |
| Balsa Nova | 54 | $1,046 | $129.18 | 29% |
| Balneário Camboriú | 4,463 | $1,044 | $119.43 | 40% |
| Campo Largo | 62 | $977 | $146.21 | 38% |
| Campina Grande do Sul | 92 | $957 | $108.29 | 33% |
| Araucária | 12 | $850 | $68.02 | 43% |
| Contenda | 10 | $794 | $119.31 | 44% |