Balsa Nova Airbnb Market Analysis 2026: Short Term Rental Data & Vacation Rental Statistics in Paraná, Brazil
Is Airbnb profitable in Balsa Nova in 2026? Explore comprehensive Airbnb analytics for Balsa Nova, Paraná, Brazil to uncover income potential. This 2026 STR market report for Balsa Nova, based on AirROI data from February 2025 to January 2026, reveals key trends in the niche market of 55 active listings.
Whether you're considering an Airbnb investment in Balsa Nova, optimizing your existing vacation rental, or exploring rental arbitrage opportunities, understanding the Balsa Nova Airbnb data is crucial. Leveraging the low regulation environment is key to maximizing your short term rental income potential. Let's dive into the specifics.
Key Balsa Nova Airbnb Performance Metrics Overview
Monthly Airbnb Revenue Variations & Income Potential in Balsa Nova (2026)
Understanding the monthly revenue variations for Airbnb listings in Balsa Nova is key to maximizing your short term rental income potential. Seasonality significantly impacts earnings. Our analysis, based on data from the past 12 months, shows that the peak revenue month for STRs in Balsa Nova is typically July, while February often presents the lowest earnings, highlighting opportunities for strategic pricing adjustments during shoulder and low seasons. Explore the typical Airbnb income in Balsa Nova across different performance tiers:
- Best-in-class properties (Top 10%) achieve $2,366+ monthly, often utilizing dynamic pricing and superior guest experiences.
- Strong performing properties (Top 25%) earn $1,501 or more, indicating effective management and desirable locations/amenities.
- Typical properties (Median) generate around $890 per month, representing the average market performance.
- Entry-level properties (Bottom 25%) see earnings around $442, often with potential for optimization.
Average Monthly Airbnb Earnings Trend in Balsa Nova
Balsa Nova Airbnb Occupancy Rate Trends (2026)
Maximize your bookings by understanding the Balsa Nova STR occupancy trends. Seasonal demand shifts significantly influence how often properties are booked. Typically, Julysees the highest demand (peak season occupancy), while February experiences the lowest (low season). Effective strategies, like adjusting minimum stays or offering promotions, can boost occupancy during slower periods. Here's how different property tiers perform in Balsa Nova:
- Best-in-class properties (Top 10%) achieve 57%+ occupancy, indicating high desirability and potentially optimized availability.
- Strong performing properties (Top 25%) maintain 40% or higher occupancy, suggesting good market fit and guest satisfaction.
- Typical properties (Median) have an occupancy rate around 27%.
- Entry-level properties (Bottom 25%) average 14% occupancy, potentially facing higher vacancy.
Average Monthly Occupancy Rate Trend in Balsa Nova
Average Daily Rate (ADR) Airbnb Trends in Balsa Nova (2026)
Effective short term rental pricing strategy in Balsa Nova involves understanding monthly ADR fluctuations. The Average Daily Rate (ADR) for Airbnb in Balsa Nova typically peaks in December and dips lowest during February. Leveraging Airbnb dynamic pricing tools or strategies based on this seasonality can significantly boost revenue. Here's a look at the typical nightly rates achieved:
- Best-in-class properties (Top 10%) command rates of $187+ per night, often due to premium features or locations.
- Strong performing properties (Top 25%) achieve nightly rates of $154 or more.
- Typical properties (Median) charge around $118 per night.
- Entry-level properties (Bottom 25%) earn around $86 per night.
Average Daily Rate (ADR) Trend by Month in Balsa Nova
Get Live Balsa Nova Market Intelligence 👇
Explore Real-time Analytics
Airbnb Seasonality Analysis & Trends in Balsa Nova (2026)
Peak Season (July, June, December)
- Revenue averages $1,354 per month
- Occupancy rates average 34.2%
- Daily rates average $132
Shoulder Season
- Revenue averages $1,109 per month
- Occupancy maintains around 30.0%
- Daily rates hold near $127
Low Season (February, August, October)
- Revenue drops to average $909 per month
- Occupancy decreases to average 25.4%
- Daily rates adjust to average $126
Seasonality Insights for Balsa Nova
- The Airbnb seasonality in Balsa Nova shows highly seasonal trends requiring careful strategy. While the sections above show seasonal averages, it's also insightful to look at the extremes:
- During the high season, the absolute peak month showcases Balsa Nova's highest earning potential, with monthly revenues capable of climbing to $1,543, occupancy reaching a high of 40.4%, and ADRs peaking at $134.
- Conversely, the slowest single month of the year, typically falling within the low season, marks the market's lowest point. In this month, revenue might dip to $732, occupancy could drop to 22.9%, and ADRs may adjust down to $123.
- Understanding both the seasonal averages and these monthly peaks and troughs in revenue, occupancy, and ADR is crucial for maximizing your Airbnb profit potential in Balsa Nova.
Seasonal Strategies for Maximizing Profit
- Peak Season: Maximize revenue through premium pricing and potentially longer minimum stays. Ensure high availability.
- Low Season: Offer competitive pricing, special promotions (e.g., extended stay discounts), and flexible cancellation policies. Target off-season travelers like remote workers or budget-conscious guests.
- Shoulder Seasons: Implement dynamic pricing that balances peak and low rates. Target weekend travelers or specific events. Offer slightly more flexible terms than peak season.
- Regularly analyze your own performance against these Balsa Nova seasonality benchmarks and adjust your pricing and availability strategy accordingly.
Best Areas for Airbnb Investment in Balsa Nova (2026)
Exploring the top neighborhoods for short-term rentals in Balsa Nova? This section highlights key areas, outlining why they are attractive for hosts and guests, along with notable local attractions. Consider these locations based on your target guest profile and investment strategy.
| Neighborhood / Area | Why Host Here? (Target Guests & Appeal) | Key Attractions & Landmarks |
|---|---|---|
| Centro de Balsa Nova | The main commercial area with a variety of shops and services, popular with both locals and visitors. It's a great base for exploring the region. | Igreja Matriz, Praça 14 de Novembro, Café com Livro, Escola Municipal, Feira de Artesanato |
| Tremembe | A quiet and green neighborhood close to nature, suitable for tourists looking for tranquility away from the hustle and bustle. | Parque Natural Tremembé, Caminhos do Lago, Trilhas e fauna local, Lago de Tremembé |
| Balsa Nova Rural | Ideal for guests seeking a rural experience with farms and nature, providing a unique Airbnb experience for city dwellers. | Fazendas locais, Atividades ao ar livre, Caminhadas e trilhas, Cultura rural |
| São Miguel | A charming neighborhood with a small-town feel, perfect for family visits and offering a taste of local life. | Praça São Miguel, Igreja de São Miguel, Mercado Municipal, Eventos culturais locais |
| Jardim Planalto | A residential area that offers a peaceful environment with good access to recreational areas, ideal for families. | Parque do Jardim Planalto, Praças locais, Caminhadas familiares |
| Bairro Alto | Known for its cultural community vibe, this area attracts guests who appreciate local art and music scenes. | Centro Cultural, Feiras de arte, Eventos musicais |
| Vila Nova | A well-connected area with lots of amenities, great for travelers who want accessibility and convenience. | Supermercados e lojas, Restaurantes locais, Cafés e confeitarias |
| Cerro Azul | Located a little outside Balsa Nova, this area is perfect for outdoor enthusiasts and offers beautiful views of nature. | Cascatas, Trilhas para caminhadas, Parques naturais |
Understanding Airbnb License Requirements & STR Laws in Balsa Nova (2026)
While Balsa Nova, Paraná, Brazil currently shows low STR regulations, specific Airbnb license requirements might still exist or change. Always verify the latest short term rental regulations and Airbnb license requirements directly with local government authorities for Balsa Nova to ensure full compliance before hosting.
(Source: AirROI data, 2026, finding no licensed listings among those analyzed)
Top Performing Airbnb Properties in Balsa Nova (2026)
Benchmark your potential! Explore examples of top-performing Airbnb properties in Balsa Novabased on Trailing Twelve Month (TTM) revenue. Analyze their characteristics, revenue, occupancy rate, and ADR to understand what drives success in this market.
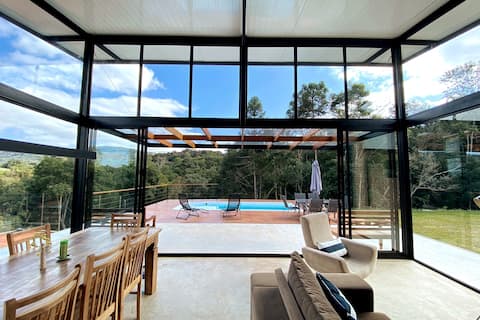
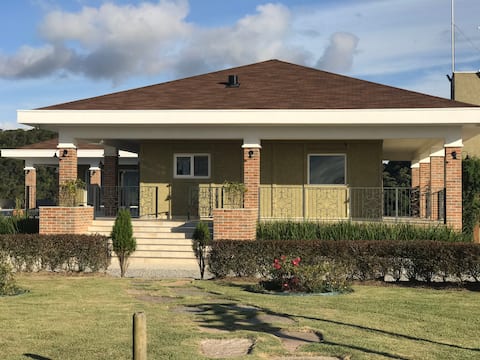
Modern and cozy farmhouse, near Curitiba
Entire Place • 3 bedrooms

Purunã Cabins (Yellow Ipê)
Entire Place • 2 bedrooms

Purunã Cabins (Araucária)
Entire Place • 2 bedrooms
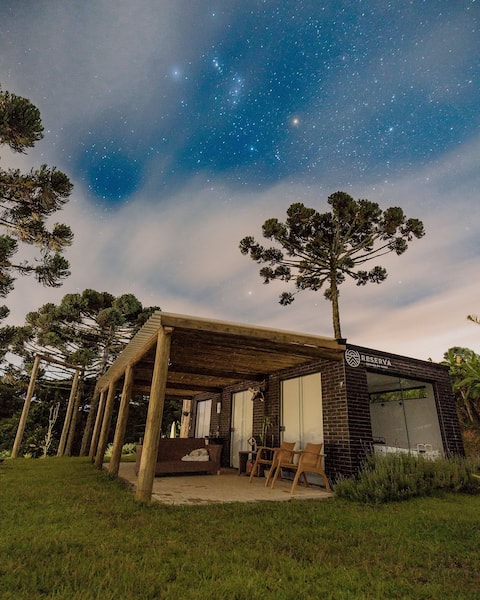
Cabana da Vista - Nature, Design and Comfort
Entire Place • 1 bedroom
Be enchanted by Purunã on the banks of the Canyon
Entire Place • 2 bedrooms
Cabana do Sol - Nature, Design and Comfort for less
Entire Place • 1 bedroom
Note: Performance varies based on location, size, amenities, seasonality, and management quality. Data reflects the past 12 months.
Top Performing Airbnb Hosts in Balsa Nova (2026)
Learn from the best! This table showcases top-performing Airbnb hosts in Balsa Nova based on the number of properties managed and estimated total revenue over the past year. Analyze their scale and performance metrics.
| Host Name | Properties | Grossing Revenue | Stay Reviews | Avg Rating |
|---|---|---|---|---|
| Paola | 3 | $50,009 | 282 | 4.99/5.0 |
| Diana | 2 | $49,410 | 375 | 4.86/5.0 |
| Ana Claudia | 3 | $48,463 | 299 | 4.97/5.0 |
| Ariane | 1 | $46,029 | 35 | 4.91/5.0 |
| BM Administradora | 2 | $44,769 | 137 | 4.84/5.0 |
| Carlos | 2 | $32,999 | 136 | 4.97/5.0 |
| Recanto Purunã | 2 | $32,454 | 37 | 5.00/5.0 |
| Andrea | 1 | $32,070 | 53 | 5.00/5.0 |
| Fabricio | 3 | $31,557 | 141 | 4.96/5.0 |
| Andre | 1 | $28,993 | 63 | 4.97/5.0 |
Analyzing the strategies of top hosts, such as their property selection, pricing, and guest communication, can offer valuable lessons for optimizing your own Airbnb operations in Balsa Nova.
Dive Deeper: Advanced Balsa Nova STR Market Data (2026)
Ready to unlock more insights? AirROI provides access to advanced metrics and comprehensive Airbnb data for Balsa Nova. Explore detailed analytics beyond this report to refine your investment strategy, optimize pricing, and maximize your vacation rental profits.
Explore Advanced MetricsBalsa Nova Short-Term Rental Market Composition (2026): Property & Room Types
Room Type Distribution
Property Type Distribution
Market Composition Insights for Balsa Nova
- The Balsa Nova Airbnb market composition is heavily skewed towards Entire Home/Apt listings, which make up 94.5% of the 55 active rentals. This indicates strong guest preference for privacy and space.
- Looking at the property type distribution in Balsa Nova, House properties are the most common (65.5%), reflecting the local real estate landscape.
- Houses represent a significant 65.5% portion, catering likely to families or larger groups.
- The presence of 5.5% Hotel/Boutique listings indicates integration with traditional hospitality.
- Smaller segments like others (combined 1.8%) offer potential for unique stay experiences.
Balsa Nova Airbnb Room Capacity Analysis (2026): Bedroom Distribution
Distribution of Listings by Number of Bedrooms
Room Capacity Insights for Balsa Nova
- The dominant room capacity in Balsa Nova is 1 bedroom listings, making up 54.5% of the market. This suggests a strong demand for properties suitable for couples or solo travelers.
- Together, 1 bedroom and 2 bedrooms properties represent 72.7% of the active Airbnb listings in Balsa Nova, indicating a high concentration in these sizes.
- With over half the market (54.5%) consisting of studios or 1-bedroom units, Balsa Nova is particularly well-suited for individuals or couples.
Balsa Nova Vacation Rental Guest Capacity Trends (2026)
Distribution of Listings by Guest Capacity
Guest Capacity Insights for Balsa Nova
- The most common guest capacity trend in Balsa Nova vacation rentals is listings accommodating 4 guests (30.9%). This suggests the primary traveler segment is likely small families or groups.
- Properties designed for 4 guests and 2 guests dominate the Balsa Nova STR market, accounting for 56.4% of listings.
- 21.8% of properties accommodate 6+ guests, serving the market segment for larger families or group travel in Balsa Nova.
- On average, properties in Balsa Nova are equipped to host 4.3 guests.
Balsa Nova Airbnb Booking Patterns (2026): Available vs. Booked Days
Available Days Distribution
Booked Days Distribution
Booking Pattern Insights for Balsa Nova
- The most common availability pattern in Balsa Nova falls within the 271-366 days range, representing 52.7% of listings. This suggests many properties have significant open periods on their calendars.
- Approximately 92.7% of listings show high availability (181+ days open annually), indicating potential for increased bookings or specific owner usage patterns.
- For booked days, the 31-90 days range is most frequent in Balsa Nova (43.6%), reflecting common guest stay durations or potential owner blocking patterns.
- A notable 9.1% of properties secure long booking periods (181+ days booked per year), highlighting successful long-term rental strategies or significant owner usage.
Balsa Nova Airbnb Minimum Stay Requirements Analysis
Distribution of Listings by Minimum Night Requirement
1 Night
27 listings
49.1% of total
2 Nights
18 listings
32.7% of total
30+ Nights
10 listings
18.2% of total
Key Insights
- The most prevalent minimum stay requirement in Balsa Nova is 1 Night, adopted by 49.1% of listings. This highlights the market's preference for shorter, flexible bookings.
- A strong majority (81.8%) of the Balsa Nova Airbnb data shows acceptance of very short stays (1-2 nights), indicating a dynamic, high-turnover market.
- A significant segment (18.2%) caters to monthly stays (30+ nights) in Balsa Nova, pointing to opportunities in the extended-stay market.
Recommendations
- Align with the market by considering a 1 Night minimum stay, as 49.1% of Balsa Nova hosts use this setting.
- Explore offering discounts for stays of 30+ nights to attract the 18.2% of the market seeking extended stays.
- Adjust minimum nights based on seasonality – potentially shorter during low season and longer during peak demand periods in Balsa Nova.
Balsa Nova Airbnb Cancellation Policy Trends Analysis (2026)
Super Strict 60 Days
1 listings
1.8% of total
Flexible
15 listings
27.3% of total
Moderate
16 listings
29.1% of total
Firm
16 listings
29.1% of total
Strict
7 listings
12.7% of total
Cancellation Policy Insights for Balsa Nova
- The prevailing Airbnb cancellation policy trend in Balsa Nova is Moderate, used by 29.1% of listings.
- There's a relatively balanced mix between guest-friendly (56.4%) and stricter (41.8%) policies, offering choices for different guest needs.
Recommendations for Hosts
- Consider adopting a Moderate policy to align with the 29.1% market standard in Balsa Nova.
- Using a Strict policy might deter some guests, as only 12.7% of listings use it. Evaluate if potential revenue protection outweighs possible lower booking rates.
- Regularly review your cancellation policy against competitors and market demand shifts in Balsa Nova.
Balsa Nova STR Booking Lead Time Analysis (2026)
Average Booking Lead Time by Month
Booking Lead Time Insights for Balsa Nova
- The overall average booking lead time for vacation rentals in Balsa Nova is 32 days.
- Guests book furthest in advance for stays during December (average 55 days), likely coinciding with peak travel demand or local events.
- The shortest booking windows occur for stays in May (average 21 days), indicating more last-minute travel plans during this time.
- Seasonally, Winter (35 days avg.) sees the longest lead times, while Spring (25 days avg.) has the shortest, reflecting typical travel planning cycles.
Recommendations for Hosts
- Use the overall average lead time (32 days) as a baseline for your pricing and availability strategy in Balsa Nova.
- For December stays, consider implementing length-of-stay discounts or slightly higher rates for bookings made less than 55 days out to capitalize on advance planning.
- Target marketing efforts for the Winter season well in advance (at least 35 days) to capture early planners.
- Monitor your own booking lead times against these Balsa Nova averages to identify opportunities for dynamic pricing adjustments.
Popular & Essential Airbnb Amenities in Balsa Nova (2026)
Amenity Prevalence
Amenity Insights for Balsa Nova
- Essential amenities in Balsa Nova that guests expect include: Free parking on premises. Lacking these (this) could significantly impact bookings.
- Popular amenities like Wifi, Kitchen, Dishes and silverware are common but not universal. Offering these can provide a competitive edge.
- Warning: Wifi is not universally provided but is considered essential globally. Ensure reliable Wifi is offered.
Recommendations for Hosts
- Ensure your listing includes all essential amenities for Balsa Nova: Free parking on premises.
- Prioritize adding missing essentials: Free parking on premises.
- Consider adding popular differentiators like Wifi or Kitchen to increase appeal.
- Highlight unique or less common amenities you offer (e.g., hot tub, dedicated workspace, EV charger) in your listing description and photos.
- Regularly check competitor amenities in Balsa Nova to stay competitive.
Balsa Nova Airbnb Guest Demographics & Profile Analysis (2026)
Guest Profile Summary for Balsa Nova
- The typical guest profile for Airbnb in Balsa Nova consists of primarily domestic travelers (98%), often arriving from nearby Curitiba, typically belonging to the Post-2000s (Gen Z/Alpha) group (50%), primarily speaking Portuguese or English.
- Domestic travelers account for 97.6% of guests.
- Key international markets include Brazil (97.6%) and United Kingdom (0.3%).
- Top languages spoken are Portuguese (46.1%) followed by English (34%).
- A significant demographic segment is the Post-2000s (Gen Z/Alpha) group, representing 50% of guests.
Recommendations for Hosts
- Target domestic marketing efforts towards travelers from Curitiba and Paraná.
- Tailor amenities and listing descriptions to appeal to the dominant Post-2000s (Gen Z/Alpha) demographic (e.g., highlight fast WiFi, smart home features, local guides).
- Highlight unique local experiences or amenities relevant to the primary guest profile.
- Consider seasonal promotions aligned with peak travel times for key origin markets.
Nearby Short-Term Rental Market Comparison
How does the Balsa Nova Airbnb market stack up against its neighbors? Compare key performance metrics like average monthly revenue, ADR, and occupancy rates in surrounding areas to understand the broader regional STR landscape.
| Market | Active Properties | Monthly Revenue | Daily Rate | Avg. Occupancy |
|---|---|---|---|---|
| Almirante Tamandaré | 16 | $1,292 | $118.23 | 39% |
| Quatro Barras | 39 | $1,134 | $137.97 | 32% |
| Campo Magro | 24 | $1,069 | $134.14 | 30% |
| Rio dos Cedros | 147 | $993 | $142.58 | 27% |
| Palmeira | 15 | $989 | $131.05 | 29% |
| Contenda | 11 | $881 | $92.99 | 45% |
| Balneário Camboriú | 4,575 | $867 | $116.75 | 36% |
| Massaranduba | 11 | $844 | $86.77 | 36% |
| Campina Grande do Sul | 97 | $841 | $104.73 | 31% |
| Campo Largo | 66 | $801 | $106.98 | 36% |