Piraí Airbnb Market Analysis 2026: Short Term Rental Data & Vacation Rental Statistics in Rio de Janeiro, Brazil
Is Airbnb profitable in Piraí in 2026? Explore comprehensive Airbnb analytics for Piraí, Rio de Janeiro, Brazil to uncover income potential. This 2026 STR market report for Piraí, based on AirROI data from February 2025 to January 2026, reveals key trends in the niche market of 23 active listings.
Whether you're considering an Airbnb investment in Piraí, optimizing your existing vacation rental, or exploring rental arbitrage opportunities, understanding the Piraí Airbnb data is crucial. Leveraging the low regulation environment is key to maximizing your short term rental income potential. Let's dive into the specifics.
Key Piraí Airbnb Performance Metrics Overview
Monthly Airbnb Revenue Variations & Income Potential in Piraí (2026)
Understanding the monthly revenue variations for Airbnb listings in Piraí is key to maximizing your short term rental income potential. Seasonality significantly impacts earnings. Our analysis, based on data from the past 12 months, shows that the peak revenue month for STRs in Piraí is typically November, while August often presents the lowest earnings, highlighting opportunities for strategic pricing adjustments during shoulder and low seasons. Explore the typical Airbnb income in Piraí across different performance tiers:
- Best-in-class properties (Top 10%) achieve $2,413+ monthly, often utilizing dynamic pricing and superior guest experiences.
- Strong performing properties (Top 25%) earn $947 or more, indicating effective management and desirable locations/amenities.
- Typical properties (Median) generate around $429 per month, representing the average market performance.
- Entry-level properties (Bottom 25%) see earnings around $181, often with potential for optimization.
Average Monthly Airbnb Earnings Trend in Piraí
Piraí Airbnb Occupancy Rate Trends (2026)
Maximize your bookings by understanding the Piraí STR occupancy trends. Seasonal demand shifts significantly influence how often properties are booked. Typically, Decembersees the highest demand (peak season occupancy), while September experiences the lowest (low season). Effective strategies, like adjusting minimum stays or offering promotions, can boost occupancy during slower periods. Here's how different property tiers perform in Piraí:
- Best-in-class properties (Top 10%) achieve 63%+ occupancy, indicating high desirability and potentially optimized availability.
- Strong performing properties (Top 25%) maintain 34% or higher occupancy, suggesting good market fit and guest satisfaction.
- Typical properties (Median) have an occupancy rate around 18%.
- Entry-level properties (Bottom 25%) average 10% occupancy, potentially facing higher vacancy.
Average Monthly Occupancy Rate Trend in Piraí
Average Daily Rate (ADR) Airbnb Trends in Piraí (2026)
Effective short term rental pricing strategy in Piraí involves understanding monthly ADR fluctuations. The Average Daily Rate (ADR) for Airbnb in Piraí typically peaks in December and dips lowest during February. Leveraging Airbnb dynamic pricing tools or strategies based on this seasonality can significantly boost revenue. Here's a look at the typical nightly rates achieved:
- Best-in-class properties (Top 10%) command rates of $165+ per night, often due to premium features or locations.
- Strong performing properties (Top 25%) achieve nightly rates of $112 or more.
- Typical properties (Median) charge around $71 per night.
- Entry-level properties (Bottom 25%) earn around $45 per night.
Average Daily Rate (ADR) Trend by Month in Piraí
Get Live Piraí Market Intelligence 👇

Explore Real-time Analytics
Airbnb Seasonality Analysis & Trends in Piraí (2026)
Peak Season (November, December, June)
- Revenue averages $981 per month
- Occupancy rates average 28.9%
- Daily rates average $97
Shoulder Season
- Revenue averages $829 per month
- Occupancy maintains around 25.4%
- Daily rates hold near $88
Low Season (July, August, September)
- Revenue drops to average $724 per month
- Occupancy decreases to average 26.2%
- Daily rates adjust to average $90
Seasonality Insights for Piraí
- The Airbnb seasonality in Piraí shows moderate seasonality with distinct peak and low periods. While the sections above show seasonal averages, it's also insightful to look at the extremes:
- During the high season, the absolute peak month showcases Piraí's highest earning potential, with monthly revenues capable of climbing to $992, occupancy reaching a high of 30.6%, and ADRs peaking at $103.
- Conversely, the slowest single month of the year, typically falling within the low season, marks the market's lowest point. In this month, revenue might dip to $670, occupancy could drop to 20.6%, and ADRs may adjust down to $81.
- Understanding both the seasonal averages and these monthly peaks and troughs in revenue, occupancy, and ADR is crucial for maximizing your Airbnb profit potential in Piraí.
Seasonal Strategies for Maximizing Profit
- Peak Season: Maximize revenue through premium pricing and potentially longer minimum stays. Ensure high availability.
- Low Season: Offer competitive pricing, special promotions (e.g., extended stay discounts), and flexible cancellation policies. Target off-season travelers like remote workers or budget-conscious guests.
- Shoulder Seasons: Implement dynamic pricing that balances peak and low rates. Target weekend travelers or specific events. Offer slightly more flexible terms than peak season.
- Regularly analyze your own performance against these Piraí seasonality benchmarks and adjust your pricing and availability strategy accordingly.
Best Areas for Airbnb Investment in Piraí (2026)
Exploring the top neighborhoods for short-term rentals in Piraí? This section highlights key areas, outlining why they are attractive for hosts and guests, along with notable local attractions. Consider these locations based on your target guest profile and investment strategy.
| Neighborhood / Area | Why Host Here? (Target Guests & Appeal) | Key Attractions & Landmarks |
|---|---|---|
| Centro | The historic downtown area of Piraí, featuring colonial architecture and proximity to local shops and restaurants. Ideal for travelers wanting to experience the cultural heart of the city. | Museu de Piraí, Teatro Municipal, Cascata de Piraí, Parque Natural, Igreja de São Sebastião |
| Parque Natural | A beautiful area surrounding the natural park, perfect for nature lovers and those seeking outdoor activities. It attracts visitors looking for tranquility and adventure. | Hiking Trails, Picnic Areas, Waterfalls, Biodiversity, Nature Observation |
| Prainha | A picturesque small beach area in Piraí that attracts visitors for relaxation and local cuisine. Great for families and weekend getaways. | Local Beaches, Fishing Tours, Water Sports, Beachfront Restaurants |
| Bairros de Piraí | The residential neighborhoods of Piraí are gaining popularity for their local vibe and accessibility. Visitors can experience the true lifestyle of Piraí away from tourist spots. | Local Markets, Community Events, Cultural Festivals |
| Horto Florestal | A green area known for its vast gardens and plant nurseries. Ideal for eco-tourism and those interested in gardening and nature. | Botanical Gardens, Eco Tours, Workshops, Plant Sales |
| Ribeirão | Located near the river, this area is perfect for those seeking active adventures such as fishing, kayaking and river sports. | Water Activities, River Walks, Fishing Spots, Camping Sites |
| Cascata do Piraí | A natural attraction featuring a beautiful waterfall. It’s a refreshing destination for day trips and eco-tourism enthusiasts. | Waterfall Trails, Nature Photography, Swimming Areas |
| Cultura Local | Areas that host local cultural events, artisan markets, and festivals. Attracts visitors interested in cultural immersion and local traditions. | Artisan Fairs, Cultural Festivals, Local Cuisine |
Understanding Airbnb License Requirements & STR Laws in Piraí (2026)
While Piraí, Rio de Janeiro, Brazil currently shows low STR regulations, specific Airbnb license requirements might still exist or change. Always verify the latest short term rental regulations and Airbnb license requirements directly with local government authorities for Piraí to ensure full compliance before hosting.
(Source: AirROI data, 2026, finding no licensed listings among those analyzed)
Top Performing Airbnb Properties in Piraí (2026)
Benchmark your potential! Explore examples of top-performing Airbnb properties in Piraíbased on Trailing Twelve Month (TTM) revenue. Analyze their characteristics, revenue, occupancy rate, and ADR to understand what drives success in this market.
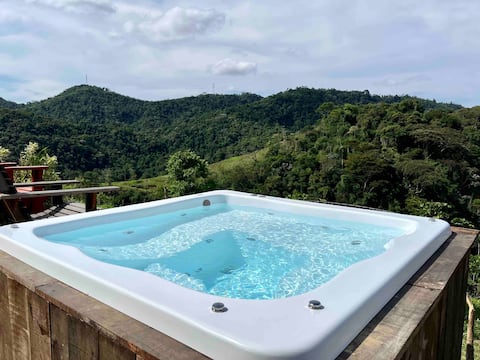
Cabin with Jacuzzi, Swimming Pool, Fireplace, A/C
Entire Place • 1 bedroom
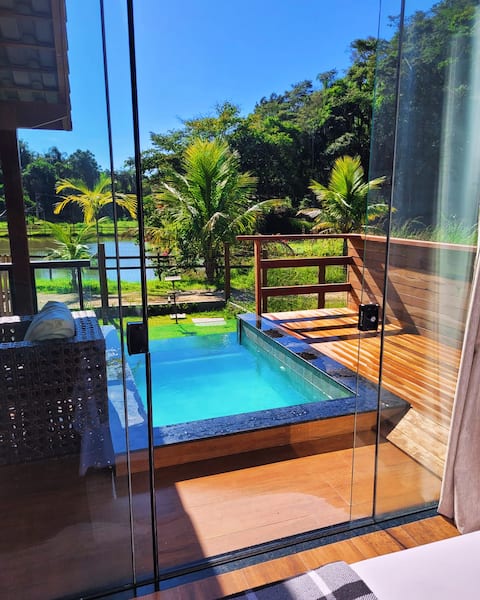
Lake House
Entire Place • 2 bedrooms
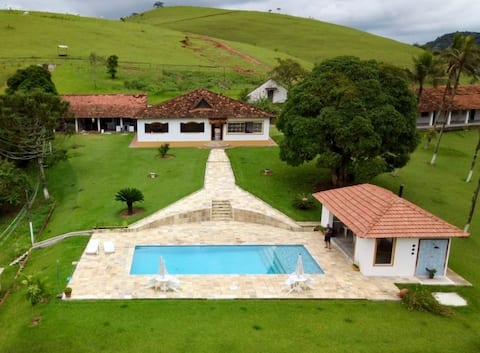
Villa Ipê - Rustic & Charming Rural Property
Entire Place • 6 bedrooms

Mountain house with pool near Rio de Janeiro
Entire Place • 4 bedrooms

Studio-House in Serra das Araras
Entire Place • 3 bedrooms

Ranch with large pool, barbecue area and Wi-Fi
Entire Place • 4 bedrooms
Note: Performance varies based on location, size, amenities, seasonality, and management quality. Data reflects the past 12 months.
Top Performing Airbnb Hosts in Piraí (2026)
Learn from the best! This table showcases top-performing Airbnb hosts in Piraí based on the number of properties managed and estimated total revenue over the past year. Analyze their scale and performance metrics.
| Host Name | Properties | Grossing Revenue | Stay Reviews | Avg Rating |
|---|---|---|---|---|
| Viviane | 1 | $40,882 | 59 | 4.98/5.0 |
| Wesley | 1 | $19,752 | 12 | 5.00/5.0 |
| Gui | 1 | $18,197 | 36 | 4.94/5.0 |
| Marcelo E Ana | 1 | $13,087 | 95 | 4.99/5.0 |
| Marcos | 3 | $11,940 | 25 | 4.91/5.0 |
| Ciderley | 1 | $10,483 | 3 | 5.00/5.0 |
| Ismar | 3 | $5,257 | 51 | 4.98/5.0 |
| Marcelle | 1 | $4,999 | 44 | 4.66/5.0 |
| Michel | 1 | $4,414 | 16 | 4.88/5.0 |
| Fernando Varella | 1 | $3,510 | 36 | 5.00/5.0 |
Analyzing the strategies of top hosts, such as their property selection, pricing, and guest communication, can offer valuable lessons for optimizing your own Airbnb operations in Piraí.
Dive Deeper: Advanced Piraí STR Market Data (2026)
Ready to unlock more insights? AirROI provides access to advanced metrics and comprehensive Airbnb data for Piraí. Explore detailed analytics beyond this report to refine your investment strategy, optimize pricing, and maximize your vacation rental profits.
Explore Advanced MetricsPiraí Short-Term Rental Market Composition (2026): Property & Room Types
Room Type Distribution
Property Type Distribution
Market Composition Insights for Piraí
- The Piraí Airbnb market composition is heavily skewed towards Entire Home/Apt listings, which make up 82.6% of the 23 active rentals. This indicates strong guest preference for privacy and space.
- Looking at the property type distribution in Piraí, House properties are the most common (78.3%), reflecting the local real estate landscape.
- Houses represent a significant 78.3% portion, catering likely to families or larger groups.
- The presence of 13% Hotel/Boutique listings indicates integration with traditional hospitality.
Piraí Airbnb Room Capacity Analysis (2026): Bedroom Distribution
Distribution of Listings by Number of Bedrooms
Room Capacity Insights for Piraí
- The dominant room capacity in Piraí is 1 bedroom listings, making up 26.1% of the market. This suggests a strong demand for properties suitable for couples or solo travelers.
- Together, 1 bedroom and 5+ bedrooms properties represent 47.8% of the active Airbnb listings in Piraí, indicating a high concentration in these sizes.
- A significant 52.1% of listings offer 3+ bedrooms, catering to larger groups and families seeking more space in Piraí.
Piraí Vacation Rental Guest Capacity Trends (2026)
Distribution of Listings by Guest Capacity
Guest Capacity Insights for Piraí
- The most common guest capacity trend in Piraí vacation rentals is listings accommodating 8+ guests (52.2%). This suggests the primary traveler segment is likely larger groups.
- Properties designed for 8+ guests and 2 guests dominate the Piraí STR market, accounting for 60.9% of listings.
- 56.5% of properties accommodate 6+ guests, serving the market segment for larger families or group travel in Piraí.
- On average, properties in Piraí are equipped to host 5.4 guests.
Piraí Airbnb Booking Patterns (2026): Available vs. Booked Days
Available Days Distribution
Booked Days Distribution
Booking Pattern Insights for Piraí
- The most common availability pattern in Piraí falls within the 271-366 days range, representing 78.3% of listings. This suggests many properties have significant open periods on their calendars.
- Approximately 91.3% of listings show high availability (181+ days open annually), indicating potential for increased bookings or specific owner usage patterns.
- For booked days, the 1-30 days range is most frequent in Piraí (43.5%), reflecting common guest stay durations or potential owner blocking patterns.
- A notable 8.6% of properties secure long booking periods (181+ days booked per year), highlighting successful long-term rental strategies or significant owner usage.
Piraí Airbnb Minimum Stay Requirements Analysis
Distribution of Listings by Minimum Night Requirement
1 Night
15 listings
65.2% of total
2 Nights
4 listings
17.4% of total
3 Nights
1 listings
4.3% of total
30+ Nights
3 listings
13% of total
Key Insights
- The most prevalent minimum stay requirement in Piraí is 1 Night, adopted by 65.2% of listings. This highlights the market's preference for shorter, flexible bookings.
- A strong majority (82.6%) of the Piraí Airbnb data shows acceptance of very short stays (1-2 nights), indicating a dynamic, high-turnover market.
- A significant segment (13%) caters to monthly stays (30+ nights) in Piraí, pointing to opportunities in the extended-stay market.
Recommendations
- Align with the market by considering a 1 Night minimum stay, as 65.2% of Piraí hosts use this setting.
- Explore offering discounts for stays of 30+ nights to attract the 13% of the market seeking extended stays.
- Adjust minimum nights based on seasonality – potentially shorter during low season and longer during peak demand periods in Piraí.
Piraí Airbnb Cancellation Policy Trends Analysis (2026)
Flexible
7 listings
30.4% of total
Moderate
5 listings
21.7% of total
Firm
7 listings
30.4% of total
Strict
4 listings
17.4% of total
Cancellation Policy Insights for Piraí
- The prevailing Airbnb cancellation policy trend in Piraí is Flexible, used by 30.4% of listings.
- There's a relatively balanced mix between guest-friendly (52.1%) and stricter (47.8%) policies, offering choices for different guest needs.
Recommendations for Hosts
- Consider adopting a Flexible policy to align with the 30.4% market standard in Piraí.
- Regularly review your cancellation policy against competitors and market demand shifts in Piraí.
Piraí STR Booking Lead Time Analysis (2026)
Average Booking Lead Time by Month
Booking Lead Time Insights for Piraí
- The overall average booking lead time for vacation rentals in Piraí is 33 days.
- Guests book furthest in advance for stays during November (average 67 days), likely coinciding with peak travel demand or local events.
- The shortest booking windows occur for stays in September (average 8 days), indicating more last-minute travel plans during this time.
- Seasonally, Spring (40 days avg.) sees the longest lead times, while Summer (27 days avg.) has the shortest, reflecting typical travel planning cycles.
Recommendations for Hosts
- Use the overall average lead time (33 days) as a baseline for your pricing and availability strategy in Piraí.
- For November stays, consider implementing length-of-stay discounts or slightly higher rates for bookings made less than 67 days out to capitalize on advance planning.
- During September, focus on last-minute booking availability and promotions, as guests book with very short notice (8 days avg.).
- Target marketing efforts for the Spring season well in advance (at least 40 days) to capture early planners.
- Monitor your own booking lead times against these Piraí averages to identify opportunities for dynamic pricing adjustments.
Popular & Essential Airbnb Amenities in Piraí (2026)
Amenity Prevalence
Amenity Insights for Piraí
- Essential amenities in Piraí that guests expect include: Wifi, Free parking on premises, Kitchen. Lacking these (any) could significantly impact bookings.
- Popular amenities like Dishes and silverware, Refrigerator, TV are common but not universal. Offering these can provide a competitive edge.
- A pool is a highly desired but not standard amenity, making it a key feature for attracting guests seeking leisure in Piraí.
Recommendations for Hosts
- Ensure your listing includes all essential amenities for Piraí: Wifi, Free parking on premises, Kitchen.
- Prioritize adding missing essentials: Free parking on premises, Kitchen.
- Consider adding popular differentiators like Dishes and silverware or Refrigerator to increase appeal.
- Highlight unique or less common amenities you offer (e.g., hot tub, dedicated workspace, EV charger) in your listing description and photos.
- Regularly check competitor amenities in Piraí to stay competitive.
Piraí Airbnb Guest Demographics & Profile Analysis (2026)
Guest Profile Summary for Piraí
- The typical guest profile for Airbnb in Piraí consists of primarily domestic travelers (95%), often arriving from nearby Rio de Janeiro, typically belonging to the Post-2000s (Gen Z/Alpha) group (50%), primarily speaking Portuguese or English.
- Domestic travelers account for 95.2% of guests.
- Key international markets include Brazil (95.2%) and Netherlands (1.6%).
- Top languages spoken are Portuguese (50%) followed by English (27.3%).
- A significant demographic segment is the Post-2000s (Gen Z/Alpha) group, representing 50% of guests.
Recommendations for Hosts
- Target domestic marketing efforts towards travelers from Rio de Janeiro and São Paulo.
- Tailor amenities and listing descriptions to appeal to the dominant Post-2000s (Gen Z/Alpha) demographic (e.g., highlight fast WiFi, smart home features, local guides).
- Highlight unique local experiences or amenities relevant to the primary guest profile.
- Consider seasonal promotions aligned with peak travel times for key origin markets.
Nearby Short-Term Rental Market Comparison
How does the Piraí Airbnb market stack up against its neighbors? Compare key performance metrics like average monthly revenue, ADR, and occupancy rates in surrounding areas to understand the broader regional STR landscape.
| Market | Active Properties | Monthly Revenue | Daily Rate | Avg. Occupancy |
|---|---|---|---|---|
| Areal | 82 | $1,532 | $198.25 | 30% |
| Queluz | 17 | $1,291 | $152.05 | 30% |
| Rio de Janeiro | 27,660 | $1,085 | $106.45 | 43% |
| Angra dos Reis | 2,446 | $1,017 | $158.25 | 33% |
| Petrópolis | 2,096 | $964 | $143.70 | 27% |
| Paraíba do Sul | 49 | $930 | $208.87 | 25% |
| Ijaci | 16 | $792 | $140.06 | 28% |
| Itanhandu | 31 | $788 | $108.00 | 22% |
| Guapimirim | 142 | $778 | $123.54 | 27% |
| Ilha Grande | 11 | $1,783 | $166.42 | 38% |