Carlos Barbosa Airbnb Market Analysis 2026: Short Term Rental Data & Vacation Rental Statistics in Rio Grande do Sul, Brazil
Is Airbnb profitable in Carlos Barbosa in 2026? Explore comprehensive Airbnb analytics for Carlos Barbosa, Rio Grande do Sul, Brazil to uncover income potential. This 2026 STR market report for Carlos Barbosa, based on AirROI data from February 2025 to January 2026, reveals key trends in the niche market of 31 active listings.
Whether you're considering an Airbnb investment in Carlos Barbosa, optimizing your existing vacation rental, or exploring rental arbitrage opportunities, understanding the Carlos Barbosa Airbnb data is crucial. Leveraging the low regulation environment is key to maximizing your short term rental income potential. Let's dive into the specifics.
Key Carlos Barbosa Airbnb Performance Metrics Overview
Monthly Airbnb Revenue Variations & Income Potential in Carlos Barbosa (2026)
Understanding the monthly revenue variations for Airbnb listings in Carlos Barbosa is key to maximizing your short term rental income potential. Seasonality significantly impacts earnings. Our analysis, based on data from the past 12 months, shows that the peak revenue month for STRs in Carlos Barbosa is typically December, while August often presents the lowest earnings, highlighting opportunities for strategic pricing adjustments during shoulder and low seasons. Explore the typical Airbnb income in Carlos Barbosa across different performance tiers:
- Best-in-class properties (Top 10%) achieve $2,163+ monthly, often utilizing dynamic pricing and superior guest experiences.
- Strong performing properties (Top 25%) earn $1,223 or more, indicating effective management and desirable locations/amenities.
- Typical properties (Median) generate around $527 per month, representing the average market performance.
- Entry-level properties (Bottom 25%) see earnings around $235, often with potential for optimization.
Average Monthly Airbnb Earnings Trend in Carlos Barbosa
Carlos Barbosa Airbnb Occupancy Rate Trends (2026)
Maximize your bookings by understanding the Carlos Barbosa STR occupancy trends. Seasonal demand shifts significantly influence how often properties are booked. Typically, Marchsees the highest demand (peak season occupancy), while August experiences the lowest (low season). Effective strategies, like adjusting minimum stays or offering promotions, can boost occupancy during slower periods. Here's how different property tiers perform in Carlos Barbosa:
- Best-in-class properties (Top 10%) achieve 70%+ occupancy, indicating high desirability and potentially optimized availability.
- Strong performing properties (Top 25%) maintain 51% or higher occupancy, suggesting good market fit and guest satisfaction.
- Typical properties (Median) have an occupancy rate around 29%.
- Entry-level properties (Bottom 25%) average 14% occupancy, potentially facing higher vacancy.
Average Monthly Occupancy Rate Trend in Carlos Barbosa
Average Daily Rate (ADR) Airbnb Trends in Carlos Barbosa (2026)
Effective short term rental pricing strategy in Carlos Barbosa involves understanding monthly ADR fluctuations. The Average Daily Rate (ADR) for Airbnb in Carlos Barbosa typically peaks in December and dips lowest during February. Leveraging Airbnb dynamic pricing tools or strategies based on this seasonality can significantly boost revenue. Here's a look at the typical nightly rates achieved:
- Best-in-class properties (Top 10%) command rates of $164+ per night, often due to premium features or locations.
- Strong performing properties (Top 25%) achieve nightly rates of $117 or more.
- Typical properties (Median) charge around $63 per night.
- Entry-level properties (Bottom 25%) earn around $33 per night.
Average Daily Rate (ADR) Trend by Month in Carlos Barbosa
Get Live Carlos Barbosa Market Intelligence 👇

Explore Real-time Analytics
Airbnb Seasonality Analysis & Trends in Carlos Barbosa (2026)
Peak Season (December, January, March)
- Revenue averages $1,107 per month
- Occupancy rates average 39.3%
- Daily rates average $89
Shoulder Season
- Revenue averages $840 per month
- Occupancy maintains around 33.7%
- Daily rates hold near $78
Low Season (February, August, November)
- Revenue drops to average $684 per month
- Occupancy decreases to average 29.8%
- Daily rates adjust to average $79
Seasonality Insights for Carlos Barbosa
- The Airbnb seasonality in Carlos Barbosa shows highly seasonal trends requiring careful strategy. While the sections above show seasonal averages, it's also insightful to look at the extremes:
- During the high season, the absolute peak month showcases Carlos Barbosa's highest earning potential, with monthly revenues capable of climbing to $1,293, occupancy reaching a high of 42.7%, and ADRs peaking at $102.
- Conversely, the slowest single month of the year, typically falling within the low season, marks the market's lowest point. In this month, revenue might dip to $642, occupancy could drop to 24.1%, and ADRs may adjust down to $65.
- Understanding both the seasonal averages and these monthly peaks and troughs in revenue, occupancy, and ADR is crucial for maximizing your Airbnb profit potential in Carlos Barbosa.
Seasonal Strategies for Maximizing Profit
- Peak Season: Maximize revenue through premium pricing and potentially longer minimum stays. Ensure high availability.
- Low Season: Offer competitive pricing, special promotions (e.g., extended stay discounts), and flexible cancellation policies. Target off-season travelers like remote workers or budget-conscious guests.
- Shoulder Seasons: Implement dynamic pricing that balances peak and low rates. Target weekend travelers or specific events. Offer slightly more flexible terms than peak season.
- Regularly analyze your own performance against these Carlos Barbosa seasonality benchmarks and adjust your pricing and availability strategy accordingly.
Best Areas for Airbnb Investment in Carlos Barbosa (2026)
Exploring the top neighborhoods for short-term rentals in Carlos Barbosa? This section highlights key areas, outlining why they are attractive for hosts and guests, along with notable local attractions. Consider these locations based on your target guest profile and investment strategy.
| Neighborhood / Area | Why Host Here? (Target Guests & Appeal) | Key Attractions & Landmarks |
|---|---|---|
| Centro | The heart of Carlos Barbosa, perfect for visitors seeking culture, dining, and shopping. It offers a vibrant atmosphere with various amenities and easy access to attractions. | Catedral São Sebastião, Museu Municipal de Carlos Barbosa, Parque da Estação, Teatro Municipal, Shopping São Marcos |
| Vila Flores | A charming neighborhood known for its historical architecture and community vibes. Ideal for hosting travelers who appreciate local culture and antique shops. | Igreja Matriz São Sebastião, Armazém do Campo, Café e Bistrô da Vila Flores, Caminho de Pedestres da Vila Flores |
| Baixa de Montanha | Offers stunning natural views and eco-tourism opportunities. Great for those looking to escape into nature while still being close to the city. | Parque Natural Municipal de Carlos Barbosa, Trilhas Ecológicas, Mirante da Montanha |
| São José dos Ferreiros | A peaceful area with beautiful nature and local farms. Attractive for families and anyone seeking a quieter stay close to nature. | Fazenda do Vale, Caminhadas pela natureza, Mercadão de produtos locais |
| Pinhal Alto | Famous for its wine production, offering guests a unique stay among vineyards. Perfect for wine enthusiasts and romantic getaways. | Vinícolas locais, Degustações de vinho, Caminhos do Vinho |
| Caminho dos Antiquários | A street known for its antique stores and cultural heritage. A delight for guests interested in history and vintage items. | Loja de Antiguidades, Galeria de Arte, Feiras de antiguidades |
| Bairro St. Clara | A family-friendly neighborhood with parks and recreational areas. Ideal for hosting families looking for comfort and convenience. | Parque das Águas, Praça de São Clara, Atividades para crianças |
| Travessão | An area with a rural atmosphere and beautiful landscapes, suitable for those who wish to experience rural life and local cuisine. | Atividades rurais, Restaurantes de comida típica, Passeios a cavalo |
Understanding Airbnb License Requirements & STR Laws in Carlos Barbosa (2026)
While Carlos Barbosa, Rio Grande do Sul, Brazil currently shows low STR regulations, specific Airbnb license requirements might still exist or change. Always verify the latest short term rental regulations and Airbnb license requirements directly with local government authorities for Carlos Barbosa to ensure full compliance before hosting.
(Source: AirROI data, 2026, finding no licensed listings among those analyzed)
Top Performing Airbnb Properties in Carlos Barbosa (2026)
Benchmark your potential! Explore examples of top-performing Airbnb properties in Carlos Barbosabased on Trailing Twelve Month (TTM) revenue. Analyze their characteristics, revenue, occupancy rate, and ADR to understand what drives success in this market.
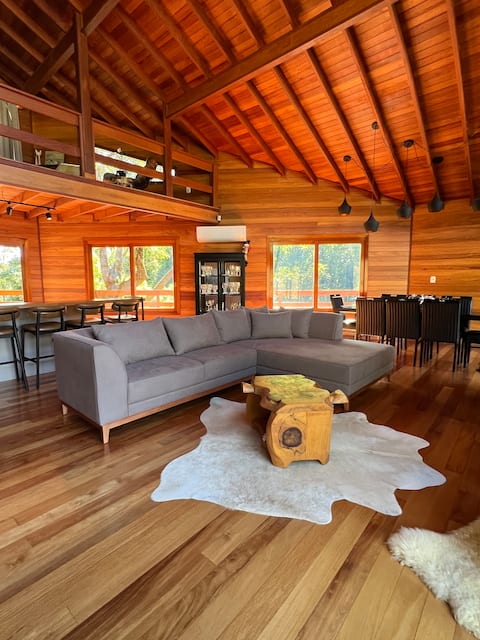
Cabin of the araucárias
Entire Place • 2 bedrooms

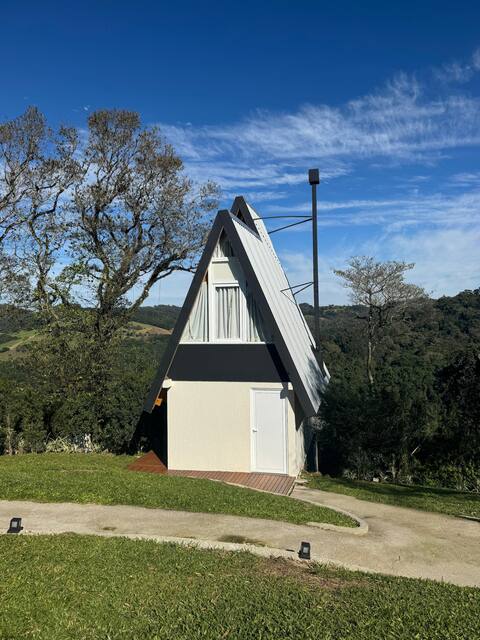
Alpinada cabanas, a refuge in the midst of nature.
Entire Place • 1 bedroom
Cabana Atalaia
Entire Place • 1 bedroom
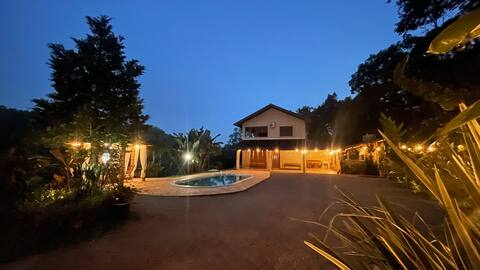
Sítio dos Coqueiros in the midst of nature with a swimming pool
Entire Place • 4 bedrooms

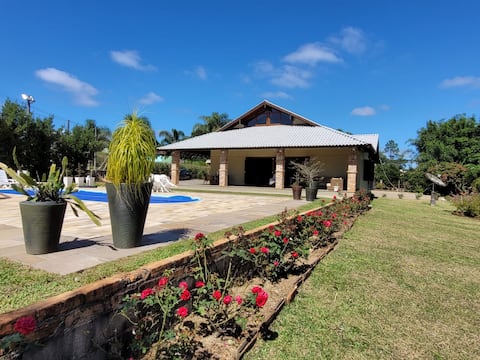
Villa Refúgio do Valle with Spa Pool
Entire Place • 4 bedrooms
House in Carlos Barbosa, RS
Entire Place • 2 bedrooms
Note: Performance varies based on location, size, amenities, seasonality, and management quality. Data reflects the past 12 months.
Top Performing Airbnb Hosts in Carlos Barbosa (2026)
Learn from the best! This table showcases top-performing Airbnb hosts in Carlos Barbosa based on the number of properties managed and estimated total revenue over the past year. Analyze their scale and performance metrics.
| Host Name | Properties | Grossing Revenue | Stay Reviews | Avg Rating |
|---|---|---|---|---|
| Giane | 1 | $30,908 | 18 | 5.00/5.0 |
| Adrielson | 1 | $29,666 | 33 | 5.00/5.0 |
| Claudino | 2 | $28,513 | 79 | 4.97/5.0 |
| Andreia | 2 | $21,598 | 70 | 4.97/5.0 |
| Cristiano Guaragni | 1 | $21,211 | 100 | 4.98/5.0 |
| Luiza | 2 | $13,495 | 226 | 4.96/5.0 |
| Eduardo | 2 | $13,190 | 155 | 4.94/5.0 |
| Marisa | 1 | $12,738 | 5 | 5.00/5.0 |
| Carlos Alberto | 1 | $8,564 | 204 | 4.98/5.0 |
| Rosane | 1 | $8,252 | 24 | 4.92/5.0 |
Analyzing the strategies of top hosts, such as their property selection, pricing, and guest communication, can offer valuable lessons for optimizing your own Airbnb operations in Carlos Barbosa.
Dive Deeper: Advanced Carlos Barbosa STR Market Data (2026)
Ready to unlock more insights? AirROI provides access to advanced metrics and comprehensive Airbnb data for Carlos Barbosa. Explore detailed analytics beyond this report to refine your investment strategy, optimize pricing, and maximize your vacation rental profits.
Explore Advanced MetricsCarlos Barbosa Short-Term Rental Market Composition (2026): Property & Room Types
Room Type Distribution
Property Type Distribution
Market Composition Insights for Carlos Barbosa
- The Carlos Barbosa Airbnb market composition is heavily skewed towards Entire Home/Apt listings, which make up 80.6% of the 31 active rentals. This indicates strong guest preference for privacy and space.
- Looking at the property type distribution in Carlos Barbosa, House properties are the most common (58.1%), reflecting the local real estate landscape.
- Houses represent a significant 58.1% portion, catering likely to families or larger groups.
- Smaller segments like others, hotel/boutique (combined 6.4%) offer potential for unique stay experiences.
Carlos Barbosa Airbnb Room Capacity Analysis (2026): Bedroom Distribution
Distribution of Listings by Number of Bedrooms
Room Capacity Insights for Carlos Barbosa
- The dominant room capacity in Carlos Barbosa is 1 bedroom listings, making up 38.7% of the market. This suggests a strong demand for properties suitable for couples or solo travelers.
- Together, 1 bedroom and 2 bedrooms properties represent 64.5% of the active Airbnb listings in Carlos Barbosa, indicating a high concentration in these sizes.
- A significant 25.8% of listings offer 3+ bedrooms, catering to larger groups and families seeking more space in Carlos Barbosa.
Carlos Barbosa Vacation Rental Guest Capacity Trends (2026)
Distribution of Listings by Guest Capacity
Guest Capacity Insights for Carlos Barbosa
- The most common guest capacity trend in Carlos Barbosa vacation rentals is listings accommodating 4 guests (25.8%). This suggests the primary traveler segment is likely small families or groups.
- Properties designed for 4 guests and 8+ guests dominate the Carlos Barbosa STR market, accounting for 51.6% of listings.
- 35.5% of properties accommodate 6+ guests, serving the market segment for larger families or group travel in Carlos Barbosa.
- On average, properties in Carlos Barbosa are equipped to host 4.4 guests.
Carlos Barbosa Airbnb Booking Patterns (2026): Available vs. Booked Days
Available Days Distribution
Booked Days Distribution
Booking Pattern Insights for Carlos Barbosa
- The most common availability pattern in Carlos Barbosa falls within the 271-366 days range, representing 54.8% of listings. This suggests many properties have significant open periods on their calendars.
- Approximately 87.1% of listings show high availability (181+ days open annually), indicating potential for increased bookings or specific owner usage patterns.
- For booked days, the 31-90 days range is most frequent in Carlos Barbosa (38.7%), reflecting common guest stay durations or potential owner blocking patterns.
- A notable 19.3% of properties secure long booking periods (181+ days booked per year), highlighting successful long-term rental strategies or significant owner usage.
Carlos Barbosa Airbnb Minimum Stay Requirements Analysis
Distribution of Listings by Minimum Night Requirement
1 Night
17 listings
54.8% of total
2 Nights
6 listings
19.4% of total
3 Nights
1 listings
3.2% of total
30+ Nights
7 listings
22.6% of total
Key Insights
- The most prevalent minimum stay requirement in Carlos Barbosa is 1 Night, adopted by 54.8% of listings. This highlights the market's preference for shorter, flexible bookings.
- A strong majority (74.2%) of the Carlos Barbosa Airbnb data shows acceptance of very short stays (1-2 nights), indicating a dynamic, high-turnover market.
- A significant segment (22.6%) caters to monthly stays (30+ nights) in Carlos Barbosa, pointing to opportunities in the extended-stay market.
Recommendations
- Align with the market by considering a 1 Night minimum stay, as 54.8% of Carlos Barbosa hosts use this setting.
- Explore offering discounts for stays of 30+ nights to attract the 22.6% of the market seeking extended stays.
- Adjust minimum nights based on seasonality – potentially shorter during low season and longer during peak demand periods in Carlos Barbosa.
Carlos Barbosa Airbnb Cancellation Policy Trends Analysis (2026)
Limited
1 listings
3.2% of total
Flexible
18 listings
58.1% of total
Moderate
6 listings
19.4% of total
Firm
5 listings
16.1% of total
Strict
1 listings
3.2% of total
Cancellation Policy Insights for Carlos Barbosa
- The prevailing Airbnb cancellation policy trend in Carlos Barbosa is Flexible, used by 58.1% of listings.
- The market strongly favors guest-friendly terms, with 77.5% of listings offering Flexible or Moderate policies. This suggests guests in Carlos Barbosa may expect booking flexibility.
- Strict cancellation policies are quite rare (3.2%), potentially making listings with this policy less competitive unless justified by high demand or property type.
Recommendations for Hosts
- Consider adopting a Flexible policy to align with the 58.1% market standard in Carlos Barbosa.
- Given the high prevalence of Flexible policies (58.1%), offering this can enhance booking appeal, especially during shoulder seasons.
- Using a Strict policy might deter some guests, as only 3.2% of listings use it. Evaluate if potential revenue protection outweighs possible lower booking rates.
- Regularly review your cancellation policy against competitors and market demand shifts in Carlos Barbosa.
Carlos Barbosa STR Booking Lead Time Analysis (2026)
Average Booking Lead Time by Month
Booking Lead Time Insights for Carlos Barbosa
- The overall average booking lead time for vacation rentals in Carlos Barbosa is 32 days.
- Guests book furthest in advance for stays during June (average 49 days), likely coinciding with peak travel demand or local events.
- The shortest booking windows occur for stays in May (average 18 days), indicating more last-minute travel plans during this time.
- Seasonally, Summer (39 days avg.) sees the longest lead times, while Spring (21 days avg.) has the shortest, reflecting typical travel planning cycles.
Recommendations for Hosts
- Use the overall average lead time (32 days) as a baseline for your pricing and availability strategy in Carlos Barbosa.
- For June stays, consider implementing length-of-stay discounts or slightly higher rates for bookings made less than 49 days out to capitalize on advance planning.
- Target marketing efforts for the Summer season well in advance (at least 39 days) to capture early planners.
- Monitor your own booking lead times against these Carlos Barbosa averages to identify opportunities for dynamic pricing adjustments.
Popular & Essential Airbnb Amenities in Carlos Barbosa (2026)
Amenity Prevalence
Amenity Insights for Carlos Barbosa
- Essential amenities in Carlos Barbosa that guests expect include: Wifi. Lacking these (this) could significantly impact bookings.
- Popular amenities like Kitchen, Free parking on premises, BBQ grill are common but not universal. Offering these can provide a competitive edge.
Recommendations for Hosts
- Ensure your listing includes all essential amenities for Carlos Barbosa: Wifi.
- Prioritize adding missing essentials: Wifi.
- Consider adding popular differentiators like Kitchen or Free parking on premises to increase appeal.
- Highlight unique or less common amenities you offer (e.g., hot tub, dedicated workspace, EV charger) in your listing description and photos.
- Regularly check competitor amenities in Carlos Barbosa to stay competitive.
Carlos Barbosa Airbnb Guest Demographics & Profile Analysis (2026)
Guest Profile Summary for Carlos Barbosa
- The typical guest profile for Airbnb in Carlos Barbosa consists of primarily domestic travelers (99%), often arriving from nearby Rio Grande do Sul, typically belonging to the Post-2000s (Gen Z/Alpha) group (50%), primarily speaking Portuguese or English.
- Domestic travelers account for 98.7% of guests.
- Key international markets include Brazil (98.7%) and Chile (0.4%).
- Top languages spoken are Portuguese (52.1%) followed by English (22.6%).
- A significant demographic segment is the Post-2000s (Gen Z/Alpha) group, representing 50% of guests.
Recommendations for Hosts
- Target domestic marketing efforts towards travelers from Rio Grande do Sul and Porto Alegre.
- Tailor amenities and listing descriptions to appeal to the dominant Post-2000s (Gen Z/Alpha) demographic (e.g., highlight fast WiFi, smart home features, local guides).
- Highlight unique local experiences or amenities relevant to the primary guest profile.
- Consider seasonal promotions aligned with peak travel times for key origin markets.
Nearby Short-Term Rental Market Comparison
How does the Carlos Barbosa Airbnb market stack up against its neighbors? Compare key performance metrics like average monthly revenue, ADR, and occupancy rates in surrounding areas to understand the broader regional STR landscape.
| Market | Active Properties | Monthly Revenue | Daily Rate | Avg. Occupancy |
|---|---|---|---|---|
| Pinto Bandeira | 20 | $1,439 | $161.98 | 31% |
| Flores da Cunha | 16 | $891 | $71.27 | 44% |
| Linha Nova | 10 | $890 | $86.73 | 37% |
| Gramado | 3,177 | $778 | $93.36 | 36% |
| Monte Belo do Sul | 14 | $768 | $96.62 | 32% |
| Picada Café | 24 | $766 | $97.19 | 32% |
| Ernestina | 13 | $682 | $142.94 | 21% |
| Garibaldi | 66 | $672 | $90.05 | 30% |
| Santa Maria do Herval | 39 | $638 | $67.87 | 33% |
| Canela | 1,145 | $604 | $80.61 | 32% |