Pinto Bandeira Airbnb Market Analysis 2026: Short Term Rental Data & Vacation Rental Statistics in Rio Grande do Sul, Brazil
Is Airbnb profitable in Pinto Bandeira in 2026? Explore comprehensive Airbnb analytics for Pinto Bandeira, Rio Grande do Sul, Brazil to uncover income potential. This 2026 STR market report for Pinto Bandeira, based on AirROI data from February 2025 to January 2026, reveals key trends in the niche market of 20 active listings.
Whether you're considering an Airbnb investment in Pinto Bandeira, optimizing your existing vacation rental, or exploring rental arbitrage opportunities, understanding the Pinto Bandeira Airbnb data is crucial. Leveraging the low regulation environment is key to maximizing your short term rental income potential. Let's dive into the specifics.
Key Pinto Bandeira Airbnb Performance Metrics Overview
Monthly Airbnb Revenue Variations & Income Potential in Pinto Bandeira (2026)
Understanding the monthly revenue variations for Airbnb listings in Pinto Bandeira is key to maximizing your short term rental income potential. Seasonality significantly impacts earnings. Our analysis, based on data from the past 12 months, shows that the peak revenue month for STRs in Pinto Bandeira is typically July, while January often presents the lowest earnings, highlighting opportunities for strategic pricing adjustments during shoulder and low seasons. Explore the typical Airbnb income in Pinto Bandeira across different performance tiers:
- Best-in-class properties (Top 10%) achieve $3,847+ monthly, often utilizing dynamic pricing and superior guest experiences.
- Strong performing properties (Top 25%) earn $2,636 or more, indicating effective management and desirable locations/amenities.
- Typical properties (Median) generate around $1,366 per month, representing the average market performance.
- Entry-level properties (Bottom 25%) see earnings around $710, often with potential for optimization.
Average Monthly Airbnb Earnings Trend in Pinto Bandeira
Pinto Bandeira Airbnb Occupancy Rate Trends (2026)
Maximize your bookings by understanding the Pinto Bandeira STR occupancy trends. Seasonal demand shifts significantly influence how often properties are booked. Typically, Julysees the highest demand (peak season occupancy), while January experiences the lowest (low season). Effective strategies, like adjusting minimum stays or offering promotions, can boost occupancy during slower periods. Here's how different property tiers perform in Pinto Bandeira:
- Best-in-class properties (Top 10%) achieve 61%+ occupancy, indicating high desirability and potentially optimized availability.
- Strong performing properties (Top 25%) maintain 47% or higher occupancy, suggesting good market fit and guest satisfaction.
- Typical properties (Median) have an occupancy rate around 31%.
- Entry-level properties (Bottom 25%) average 18% occupancy, potentially facing higher vacancy.
Average Monthly Occupancy Rate Trend in Pinto Bandeira
Average Daily Rate (ADR) Airbnb Trends in Pinto Bandeira (2026)
Effective short term rental pricing strategy in Pinto Bandeira involves understanding monthly ADR fluctuations. The Average Daily Rate (ADR) for Airbnb in Pinto Bandeira typically peaks in December and dips lowest during February. Leveraging Airbnb dynamic pricing tools or strategies based on this seasonality can significantly boost revenue. Here's a look at the typical nightly rates achieved:
- Best-in-class properties (Top 10%) command rates of $234+ per night, often due to premium features or locations.
- Strong performing properties (Top 25%) achieve nightly rates of $203 or more.
- Typical properties (Median) charge around $159 per night.
- Entry-level properties (Bottom 25%) earn around $133 per night.
Average Daily Rate (ADR) Trend by Month in Pinto Bandeira
Get Live Pinto Bandeira Market Intelligence 👇

Explore Real-time Analytics
Airbnb Seasonality Analysis & Trends in Pinto Bandeira (2026)
Peak Season (July, June, May)
- Revenue averages $2,117 per month
- Occupancy rates average 38.6%
- Daily rates average $158
Shoulder Season
- Revenue averages $1,831 per month
- Occupancy maintains around 34.9%
- Daily rates hold near $159
Low Season (January, April, November)
- Revenue drops to average $1,409 per month
- Occupancy decreases to average 26.3%
- Daily rates adjust to average $162
Seasonality Insights for Pinto Bandeira
- The Airbnb seasonality in Pinto Bandeira shows moderate seasonality with distinct peak and low periods. While the sections above show seasonal averages, it's also insightful to look at the extremes:
- During the high season, the absolute peak month showcases Pinto Bandeira's highest earning potential, with monthly revenues capable of climbing to $2,312, occupancy reaching a high of 41.6%, and ADRs peaking at $176.
- Conversely, the slowest single month of the year, typically falling within the low season, marks the market's lowest point. In this month, revenue might dip to $1,319, occupancy could drop to 23.4%, and ADRs may adjust down to $145.
- Understanding both the seasonal averages and these monthly peaks and troughs in revenue, occupancy, and ADR is crucial for maximizing your Airbnb profit potential in Pinto Bandeira.
Seasonal Strategies for Maximizing Profit
- Peak Season: Maximize revenue through premium pricing and potentially longer minimum stays. Ensure high availability.
- Low Season: Offer competitive pricing, special promotions (e.g., extended stay discounts), and flexible cancellation policies. Target off-season travelers like remote workers or budget-conscious guests.
- Shoulder Seasons: Implement dynamic pricing that balances peak and low rates. Target weekend travelers or specific events. Offer slightly more flexible terms than peak season.
- Regularly analyze your own performance against these Pinto Bandeira seasonality benchmarks and adjust your pricing and availability strategy accordingly.
Best Areas for Airbnb Investment in Pinto Bandeira (2026)
Exploring the top neighborhoods for short-term rentals in Pinto Bandeira? This section highlights key areas, outlining why they are attractive for hosts and guests, along with notable local attractions. Consider these locations based on your target guest profile and investment strategy.
| Neighborhood / Area | Why Host Here? (Target Guests & Appeal) | Key Attractions & Landmarks |
|---|---|---|
| Bento Gonçalves | A nearby city known for its wine production and beautiful vineyards, attracting tourists interested in wine tourism and cultural experiences. | Wine route, Miolo Winery, Casa Valduga, Caminhos de Pedra, Vale dos Vinhedos |
| Caxias do Sul | A larger urban center close to Pinto Bandeira, popular for business and cultural events, making it a good spot for urban travelers and events. | Caxias do Sul Regional Museum, Francisco Stedile Stadium, Muralha da Cidade, Santuário Nossa Senhora de Caravaggio |
| Vale dos Vinhedos | Famous wine valley that offers picturesque landscapes and wine tasting experiences, appealing to both tourists and wine lovers. | Vinícola Aurora, Vinícola Salton, Bistrô do Milhão, Hotel e Restaurante Villa Tinto, Casa di Paolo |
| Serra Gaúcha | A region known for its natural beauty and outdoor activities, ideal for those seeking adventure tourism and nature experiences. | Parque Nacional de Aparados da Serra, Cânion do Itaimbezinho, Parque da Ferradura, Cascata do Caracol |
| Petrópolis | Known as the imperial city, it offers historical tourism, attracting visitors interested in Brazil's royal past and architecture. | Palácio de Cristal, Museu Imperial, Casa de Santos Dumont, Rua do Imperador |
| Gramado | A famous tourist destination known for its Swiss-like architecture and annual festivals, perfect for family vacations and romantic getaways. | Lago Negro, Mini Mundo, Snowland, Natal Luz, Aldeia do Papai Noel |
| Canela | Adjacent to Gramado, known for its natural attractions and adventure sports, appealing to nature enthusiasts and families. | Catedral de Pedra, Parque do Caracol, Alpen Park, Mundo a Vapor |
| Rota dos Cânions | A scenic route that showcases stunning canyons and landscapes, appealing to nature lovers and outdoor adventurers. | Cânion Fortaleza, Cânion Itaimbezinho, Trilhas e passeios de ecoturismo, Mirantes |
Understanding Airbnb License Requirements & STR Laws in Pinto Bandeira (2026)
While Pinto Bandeira, Rio Grande do Sul, Brazil currently shows low STR regulations, specific Airbnb license requirements might still exist or change. Always verify the latest short term rental regulations and Airbnb license requirements directly with local government authorities for Pinto Bandeira to ensure full compliance before hosting.
(Source: AirROI data, 2026, finding no licensed listings among those analyzed)
Top Performing Airbnb Properties in Pinto Bandeira (2026)
Benchmark your potential! Explore examples of top-performing Airbnb properties in Pinto Bandeirabased on Trailing Twelve Month (TTM) revenue. Analyze their characteristics, revenue, occupancy rate, and ADR to understand what drives success in this market.

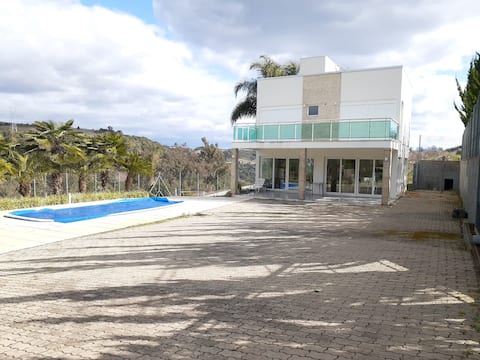
Águas Claras Country House
Entire Place • 3 bedrooms

Romantic Cabin with Jacuzzi, Esmeralda
Entire Place • 1 bedroom
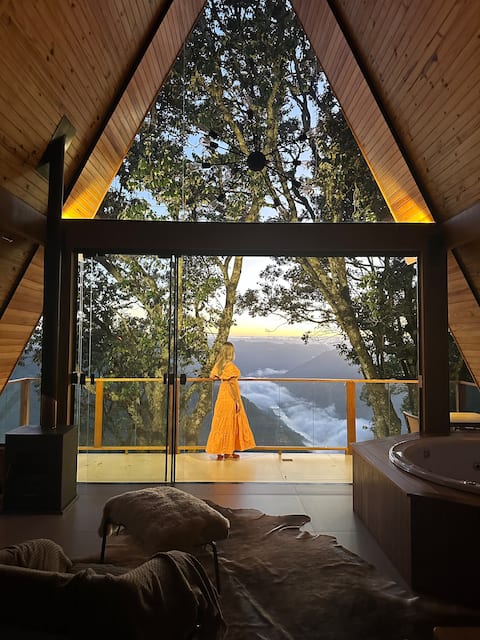
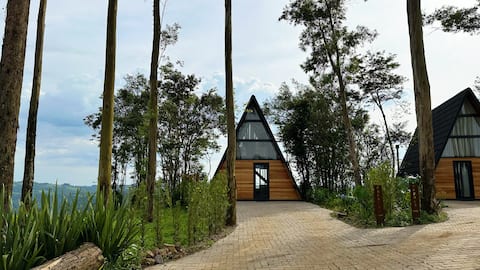
Wake up above the clouds, Hare
Entire Place • 1 bedroom

Cabanas Le Vigne - Cabernet Franc
Entire Place • 1 bedroom
Country house in the vineyards
Entire Place • 3 bedrooms
Romantic Cabin with Jacuzzi, Crystal
Entire Place • 1 bedroom
Note: Performance varies based on location, size, amenities, seasonality, and management quality. Data reflects the past 12 months.
Top Performing Airbnb Hosts in Pinto Bandeira (2026)
Learn from the best! This table showcases top-performing Airbnb hosts in Pinto Bandeira based on the number of properties managed and estimated total revenue over the past year. Analyze their scale and performance metrics.
| Host Name | Properties | Grossing Revenue | Stay Reviews | Avg Rating |
|---|---|---|---|---|
| Romulo Augusto | 3 | $79,701 | 15 | 5.00/5.0 |
| Alex | 2 | $70,277 | 30 | 4.97/5.0 |
| Nathalia | 1 | $49,829 | 84 | 5.00/5.0 |
| Leticia | 2 | $44,766 | 20 | 5.00/5.0 |
| Mariana | 1 | $28,607 | 41 | 4.90/5.0 |
| Lares | 1 | $15,791 | 9 | 5.00/5.0 |
| Noeli | 2 | $12,923 | 11 | 4.56/5.0 |
| Giordano | 1 | $9,112 | 7 | 4.86/5.0 |
| Fabiano Manara | 1 | $8,282 | 40 | 4.98/5.0 |
| Isadora | 1 | $7,563 | 18 | 5.00/5.0 |
Analyzing the strategies of top hosts, such as their property selection, pricing, and guest communication, can offer valuable lessons for optimizing your own Airbnb operations in Pinto Bandeira.
Dive Deeper: Advanced Pinto Bandeira STR Market Data (2026)
Ready to unlock more insights? AirROI provides access to advanced metrics and comprehensive Airbnb data for Pinto Bandeira. Explore detailed analytics beyond this report to refine your investment strategy, optimize pricing, and maximize your vacation rental profits.
Explore Advanced MetricsPinto Bandeira Short-Term Rental Market Composition (2026): Property & Room Types
Room Type Distribution
Property Type Distribution
Market Composition Insights for Pinto Bandeira
- The Pinto Bandeira Airbnb market composition is heavily skewed towards Entire Home/Apt listings, which make up 95% of the 20 active rentals. This indicates strong guest preference for privacy and space.
- Looking at the property type distribution in Pinto Bandeira, Outdoor/Unique properties are the most common (65%), reflecting the local real estate landscape.
- Houses represent a significant 30% portion, catering likely to families or larger groups.
Pinto Bandeira Airbnb Room Capacity Analysis (2026): Bedroom Distribution
Distribution of Listings by Number of Bedrooms
Room Capacity Insights for Pinto Bandeira
- The dominant room capacity in Pinto Bandeira is 1 bedroom listings, making up 60% of the market. This suggests a strong demand for properties suitable for couples or solo travelers.
- Together, 1 bedroom and 4 bedrooms properties represent 80.0% of the active Airbnb listings in Pinto Bandeira, indicating a high concentration in these sizes.
- With over half the market (60%) consisting of studios or 1-bedroom units, Pinto Bandeira is particularly well-suited for individuals or couples.
- A significant 40.0% of listings offer 3+ bedrooms, catering to larger groups and families seeking more space in Pinto Bandeira.
Pinto Bandeira Vacation Rental Guest Capacity Trends (2026)
Distribution of Listings by Guest Capacity
Guest Capacity Insights for Pinto Bandeira
- The most common guest capacity trend in Pinto Bandeira vacation rentals is listings accommodating 8+ guests (20%). This suggests the primary traveler segment is likely larger groups.
- Properties designed for 8+ guests and 6 guests dominate the Pinto Bandeira STR market, accounting for 40.0% of listings.
- 40.0% of properties accommodate 6+ guests, serving the market segment for larger families or group travel in Pinto Bandeira.
- On average, properties in Pinto Bandeira are equipped to host 4.5 guests.
Pinto Bandeira Airbnb Booking Patterns (2026): Available vs. Booked Days
Available Days Distribution
Booked Days Distribution
Booking Pattern Insights for Pinto Bandeira
- The most common availability pattern in Pinto Bandeira falls within the 271-366 days range, representing 50% of listings. This suggests many properties have significant open periods on their calendars.
- Approximately 90.0% of listings show high availability (181+ days open annually), indicating potential for increased bookings or specific owner usage patterns.
- For booked days, the 91-180 days range is most frequent in Pinto Bandeira (40%), reflecting common guest stay durations or potential owner blocking patterns.
- A notable 10.0% of properties secure long booking periods (181+ days booked per year), highlighting successful long-term rental strategies or significant owner usage.
Pinto Bandeira Airbnb Minimum Stay Requirements Analysis
Distribution of Listings by Minimum Night Requirement
1 Night
15 listings
75% of total
2 Nights
2 listings
10% of total
30+ Nights
3 listings
15% of total
Key Insights
- The most prevalent minimum stay requirement in Pinto Bandeira is 1 Night, adopted by 75% of listings. This highlights the market's preference for shorter, flexible bookings.
- A strong majority (85.0%) of the Pinto Bandeira Airbnb data shows acceptance of very short stays (1-2 nights), indicating a dynamic, high-turnover market.
- A significant segment (15%) caters to monthly stays (30+ nights) in Pinto Bandeira, pointing to opportunities in the extended-stay market.
Recommendations
- Align with the market by considering a 1 Night minimum stay, as 75% of Pinto Bandeira hosts use this setting.
- Explore offering discounts for stays of 30+ nights to attract the 15% of the market seeking extended stays.
- Adjust minimum nights based on seasonality – potentially shorter during low season and longer during peak demand periods in Pinto Bandeira.
Pinto Bandeira Airbnb Cancellation Policy Trends Analysis (2026)
Flexible
7 listings
35% of total
Moderate
6 listings
30% of total
Firm
5 listings
25% of total
Strict
2 listings
10% of total
Cancellation Policy Insights for Pinto Bandeira
- The prevailing Airbnb cancellation policy trend in Pinto Bandeira is Flexible, used by 35% of listings.
- There's a relatively balanced mix between guest-friendly (65.0%) and stricter (35.0%) policies, offering choices for different guest needs.
Recommendations for Hosts
- Consider adopting a Flexible policy to align with the 35% market standard in Pinto Bandeira.
- Using a Strict policy might deter some guests, as only 10% of listings use it. Evaluate if potential revenue protection outweighs possible lower booking rates.
- Regularly review your cancellation policy against competitors and market demand shifts in Pinto Bandeira.
Pinto Bandeira STR Booking Lead Time Analysis (2026)
Average Booking Lead Time by Month
Booking Lead Time Insights for Pinto Bandeira
- The overall average booking lead time for vacation rentals in Pinto Bandeira is 42 days.
- Guests book furthest in advance for stays during November (average 54 days), likely coinciding with peak travel demand or local events.
- The shortest booking windows occur for stays in February (average 29 days), indicating more last-minute travel plans during this time.
- Seasonally, Summer (46 days avg.) sees the longest lead times, while Spring (37 days avg.) has the shortest, reflecting typical travel planning cycles.
Recommendations for Hosts
- Use the overall average lead time (42 days) as a baseline for your pricing and availability strategy in Pinto Bandeira.
- For November stays, consider implementing length-of-stay discounts or slightly higher rates for bookings made less than 54 days out to capitalize on advance planning.
- Target marketing efforts for the Summer season well in advance (at least 46 days) to capture early planners.
- Monitor your own booking lead times against these Pinto Bandeira averages to identify opportunities for dynamic pricing adjustments.
Popular & Essential Airbnb Amenities in Pinto Bandeira (2026)
Amenity Prevalence
Amenity Insights for Pinto Bandeira
- Essential amenities in Pinto Bandeira that guests expect include: TV, Kitchen, Free parking on premises, Wifi. Lacking these (any) could significantly impact bookings.
- Popular amenities like Air conditioning, Refrigerator, Dishes and silverware are common but not universal. Offering these can provide a competitive edge.
Recommendations for Hosts
- Ensure your listing includes all essential amenities for Pinto Bandeira: TV, Kitchen, Free parking on premises, Wifi.
- Prioritize adding missing essentials: Kitchen, Free parking on premises, Wifi.
- Consider adding popular differentiators like Air conditioning or Refrigerator to increase appeal.
- Highlight unique or less common amenities you offer (e.g., hot tub, dedicated workspace, EV charger) in your listing description and photos.
- Regularly check competitor amenities in Pinto Bandeira to stay competitive.
Pinto Bandeira Airbnb Guest Demographics & Profile Analysis (2026)
Guest Profile Summary for Pinto Bandeira
- The typical guest profile for Airbnb in Pinto Bandeira consists of primarily domestic travelers (92%), often arriving from nearby Rio Grande do Sul, typically belonging to the Post-2000s (Gen Z/Alpha) group (50%), primarily speaking Portuguese or English.
- Domestic travelers account for 92.1% of guests.
- Key international markets include Brazil (92.1%) and Rio Grande do Sul (3.2%).
- Top languages spoken are Portuguese (41.9%) followed by English (30.2%).
- A significant demographic segment is the Post-2000s (Gen Z/Alpha) group, representing 50% of guests.
Recommendations for Hosts
- Target domestic marketing efforts towards travelers from Rio Grande do Sul and Porto Alegre.
- Tailor amenities and listing descriptions to appeal to the dominant Post-2000s (Gen Z/Alpha) demographic (e.g., highlight fast WiFi, smart home features, local guides).
- Highlight unique local experiences or amenities relevant to the primary guest profile.
- Consider seasonal promotions aligned with peak travel times for key origin markets.
Nearby Short-Term Rental Market Comparison
How does the Pinto Bandeira Airbnb market stack up against its neighbors? Compare key performance metrics like average monthly revenue, ADR, and occupancy rates in surrounding areas to understand the broader regional STR landscape.
| Market | Active Properties | Monthly Revenue | Daily Rate | Avg. Occupancy |
|---|---|---|---|---|
| Flores da Cunha | 16 | $891 | $71.27 | 44% |
| Linha Nova | 10 | $890 | $86.73 | 37% |
| Gramado | 3,177 | $778 | $93.36 | 36% |
| Monte Belo do Sul | 14 | $768 | $96.62 | 32% |
| Picada Café | 24 | $766 | $97.19 | 32% |
| Ernestina | 13 | $682 | $142.94 | 21% |
| Garibaldi | 66 | $672 | $90.05 | 30% |
| Santa Maria do Herval | 39 | $638 | $67.87 | 33% |
| Carlos Barbosa | 31 | $631 | $78.33 | 32% |
| Canela | 1,145 | $604 | $80.61 | 32% |