Santa Maria Airbnb Market Analysis 2026: Short Term Rental Data & Vacation Rental Statistics in Rio Grande do Sul, Brazil
Is Airbnb profitable in Santa Maria in 2026? Explore comprehensive Airbnb analytics for Santa Maria, Rio Grande do Sul, Brazil to uncover income potential. This 2026 STR market report for Santa Maria, based on AirROI data from February 2025 to January 2026, reveals key trends in the market of 328 active listings.
Whether you're considering an Airbnb investment in Santa Maria, optimizing your existing vacation rental, or exploring rental arbitrage opportunities, understanding the Santa Maria Airbnb data is crucial. Leveraging the low regulation environment is key to maximizing your short term rental income potential. Let's dive into the specifics.
Key Santa Maria Airbnb Performance Metrics Overview
Monthly Airbnb Revenue Variations & Income Potential in Santa Maria (2026)
Understanding the monthly revenue variations for Airbnb listings in Santa Maria is key to maximizing your short term rental income potential. Seasonality significantly impacts earnings. Our analysis, based on data from the past 12 months, shows that the peak revenue month for STRs in Santa Maria is typically December, while February often presents the lowest earnings, highlighting opportunities for strategic pricing adjustments during shoulder and low seasons. Explore the typical Airbnb income in Santa Maria across different performance tiers:
- Best-in-class properties (Top 10%) achieve $724+ monthly, often utilizing dynamic pricing and superior guest experiences.
- Strong performing properties (Top 25%) earn $480 or more, indicating effective management and desirable locations/amenities.
- Typical properties (Median) generate around $275 per month, representing the average market performance.
- Entry-level properties (Bottom 25%) see earnings around $138, often with potential for optimization.
Average Monthly Airbnb Earnings Trend in Santa Maria
Santa Maria Airbnb Occupancy Rate Trends (2026)
Maximize your bookings by understanding the Santa Maria STR occupancy trends. Seasonal demand shifts significantly influence how often properties are booked. Typically, Marchsees the highest demand (peak season occupancy), while January experiences the lowest (low season). Effective strategies, like adjusting minimum stays or offering promotions, can boost occupancy during slower periods. Here's how different property tiers perform in Santa Maria:
- Best-in-class properties (Top 10%) achieve 72%+ occupancy, indicating high desirability and potentially optimized availability.
- Strong performing properties (Top 25%) maintain 53% or higher occupancy, suggesting good market fit and guest satisfaction.
- Typical properties (Median) have an occupancy rate around 32%.
- Entry-level properties (Bottom 25%) average 15% occupancy, potentially facing higher vacancy.
Average Monthly Occupancy Rate Trend in Santa Maria
Average Daily Rate (ADR) Airbnb Trends in Santa Maria (2026)
Effective short term rental pricing strategy in Santa Maria involves understanding monthly ADR fluctuations. The Average Daily Rate (ADR) for Airbnb in Santa Maria typically peaks in October and dips lowest during February. Leveraging Airbnb dynamic pricing tools or strategies based on this seasonality can significantly boost revenue. Here's a look at the typical nightly rates achieved:
- Best-in-class properties (Top 10%) command rates of $46+ per night, often due to premium features or locations.
- Strong performing properties (Top 25%) achieve nightly rates of $35 or more.
- Typical properties (Median) charge around $27 per night.
- Entry-level properties (Bottom 25%) earn around $22 per night.
Average Daily Rate (ADR) Trend by Month in Santa Maria
Get Live Santa Maria Market Intelligence 👇

Explore Real-time Analytics
Airbnb Seasonality Analysis & Trends in Santa Maria (2026)
Peak Season (December, March, October)
- Revenue averages $395 per month
- Occupancy rates average 38.8%
- Daily rates average $33
Shoulder Season
- Revenue averages $354 per month
- Occupancy maintains around 35.3%
- Daily rates hold near $33
Low Season (February, May, June)
- Revenue drops to average $312 per month
- Occupancy decreases to average 34.9%
- Daily rates adjust to average $31
Seasonality Insights for Santa Maria
- The Airbnb seasonality in Santa Maria shows moderate seasonality with distinct peak and low periods. While the sections above show seasonal averages, it's also insightful to look at the extremes:
- During the high season, the absolute peak month showcases Santa Maria's highest earning potential, with monthly revenues capable of climbing to $413, occupancy reaching a high of 45.8%, and ADRs peaking at $35.
- Conversely, the slowest single month of the year, typically falling within the low season, marks the market's lowest point. In this month, revenue might dip to $302, occupancy could drop to 30.9%, and ADRs may adjust down to $29.
- Understanding both the seasonal averages and these monthly peaks and troughs in revenue, occupancy, and ADR is crucial for maximizing your Airbnb profit potential in Santa Maria.
Seasonal Strategies for Maximizing Profit
- Peak Season: Maximize revenue through premium pricing and potentially longer minimum stays. Ensure high availability.
- Low Season: Offer competitive pricing, special promotions (e.g., extended stay discounts), and flexible cancellation policies. Target off-season travelers like remote workers or budget-conscious guests.
- Shoulder Seasons: Implement dynamic pricing that balances peak and low rates. Target weekend travelers or specific events. Offer slightly more flexible terms than peak season.
- Regularly analyze your own performance against these Santa Maria seasonality benchmarks and adjust your pricing and availability strategy accordingly.
Best Areas for Airbnb Investment in Santa Maria (2026)
Exploring the top neighborhoods for short-term rentals in Santa Maria? This section highlights key areas, outlining why they are attractive for hosts and guests, along with notable local attractions. Consider these locations based on your target guest profile and investment strategy.
| Neighborhood / Area | Why Host Here? (Target Guests & Appeal) | Key Attractions & Landmarks |
|---|---|---|
| Centro | The downtown area of Santa Maria offers a rich cultural experience with historical architecture, shops, and restaurants. It attracts tourists and host visitors attending events, given its central location. | Catedral Basílica Menor de Nossa Senhora da Conceição, Teatro Treze de Maio, Museu de Arte de Santa Maria, Shopping Praça Nova, Praça Saldanha Marinho |
| Universidade Federal de Santa Maria (UFSM) | This area is popular with students and families visiting the university. The proximity to the campus makes it an ideal location for short-term rentals for academic visitors. | Universidade Federal de Santa Maria, Caminho dos Antiquários, Caminho do Sol |
| São José do Sul | A technology hub that attracts young professionals and offers a suburban feel while still being close to the city. It is a great location for those who prefer a quieter atmosphere with convenience. | Parque Natural Municipal de São José, Shopping de São José, Vista para o Lago |
| Vila Rosa | A charming neighborhood with a local vibe and scenic parks, making it attractive for families and couples seeking a peaceful getaway while still having access to city amenities. | Parque Natural da Vila Rosa, Café da manhã Monteiro, Feira de Artesanato |
| Nonoai | A vibrant neighborhood known for its cultural activities and local markets, appealing to tourists seeking an authentic Brazilian experience and local cuisine. | Praça do Nonoai, Feira do Semaneiro, Cultura do Nonoai |
| Dona Vânia | A quaint area well-suited for retreats or family gatherings, characterized by friendly community vibes and easy access to nature surroundings. | Praça Dona Vânia, Parque da Colina, Clube de Pesca |
| Camobi | Popular with students and young adults, this neighborhood features a lively atmosphere with bars, restaurants, and proximity to outdoor activities and parks. | Parque da Independência, Caminho das Pedras, Praça Camobi |
| Mariano de Matos | A residential area gaining popularity due to its peaceful surroundings and local amenities, which appeal to longer-staying visitors looking for comfort and accessibility. | Centro Comercial, Praça Mariano, Parque Municipal |
Understanding Airbnb License Requirements & STR Laws in Santa Maria (2026)
While Santa Maria, Rio Grande do Sul, Brazil currently shows low STR regulations, specific Airbnb license requirements might still exist or change. Always verify the latest short term rental regulations and Airbnb license requirements directly with local government authorities for Santa Maria to ensure full compliance before hosting.
(Source: AirROI data, 2026, based on 1% licensed listings)
Top Performing Airbnb Properties in Santa Maria (2026)
Benchmark your potential! Explore examples of top-performing Airbnb properties in Santa Mariabased on Trailing Twelve Month (TTM) revenue. Analyze their characteristics, revenue, occupancy rate, and ADR to understand what drives success in this market.
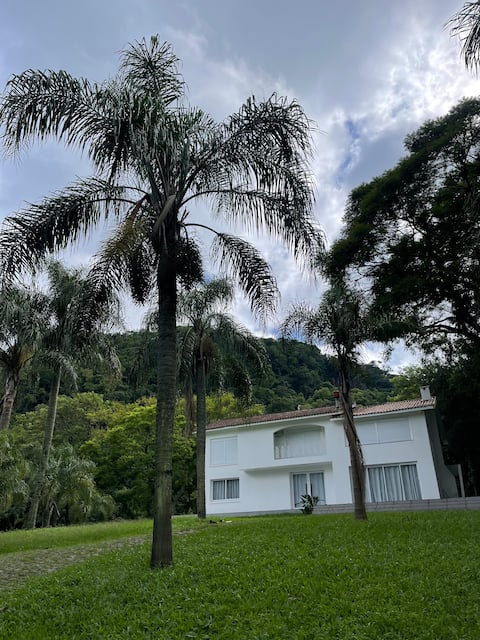
Casablanca Space Garden
Entire Place • 6 bedrooms
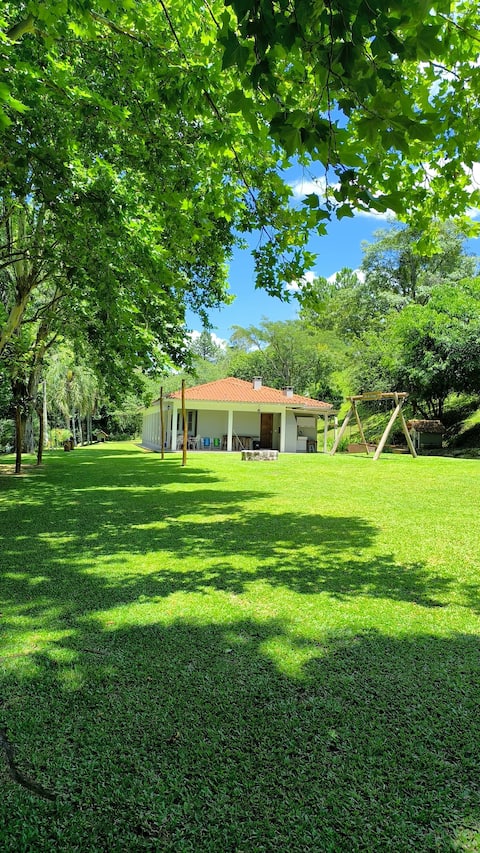
Sítio do Sossego 377 - Insta @ sitiodosossego377
Entire Place • 4 bedrooms

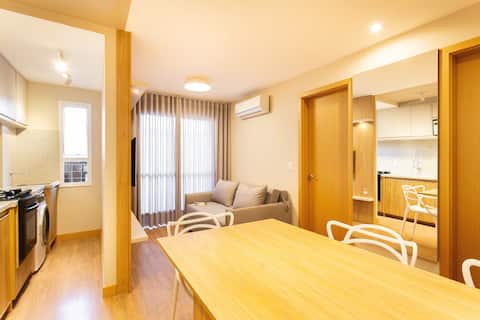
1011• Modern, Sophisticated & Perfect in StaMaria
Entire Place • 1 bedroom
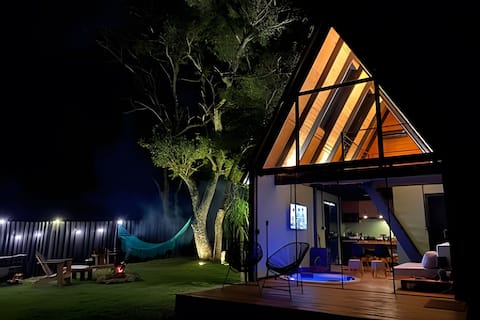
Sunrise cabin
Entire Place • 1 bedroom
Apt. 1012: “Comfort, Coziness and a Cozy Vibe”
Entire Place • 1 bedroom

Morada do Leste Apartment
Entire Place • 2 bedrooms
Note: Performance varies based on location, size, amenities, seasonality, and management quality. Data reflects the past 12 months.
Top Performing Airbnb Hosts in Santa Maria (2026)
Learn from the best! This table showcases top-performing Airbnb hosts in Santa Maria based on the number of properties managed and estimated total revenue over the past year. Analyze their scale and performance metrics.
| Host Name | Properties | Grossing Revenue | Stay Reviews | Avg Rating |
|---|---|---|---|---|
| Pedro Trost | 21 | $44,073 | 1313 | 4.75/5.0 |
| Guilherme Severo Anfitrião Pro | 16 | $38,528 | 385 | 4.89/5.0 |
| LZN Hospedagens | 8 | $31,478 | 179 | 4.94/5.0 |
| Fabricio | 6 | $29,786 | 216 | 4.87/5.0 |
| Jobim Imóveis | 12 | $27,584 | 285 | 4.81/5.0 |
| Verônica | 2 | $22,882 | 281 | 4.93/5.0 |
| Silvana | 1 | $21,506 | 2 | Not Rated |
| Janaina | 12 | $21,134 | 245 | 4.72/5.0 |
| Carla | 3 | $19,867 | 142 | 5.00/5.0 |
| Marcelo | 2 | $18,539 | 151 | 4.96/5.0 |
Analyzing the strategies of top hosts, such as their property selection, pricing, and guest communication, can offer valuable lessons for optimizing your own Airbnb operations in Santa Maria.
Dive Deeper: Advanced Santa Maria STR Market Data (2026)
Ready to unlock more insights? AirROI provides access to advanced metrics and comprehensive Airbnb data for Santa Maria. Explore detailed analytics beyond this report to refine your investment strategy, optimize pricing, and maximize your vacation rental profits.
Explore Advanced MetricsSanta Maria Short-Term Rental Market Composition (2026): Property & Room Types
Room Type Distribution
Property Type Distribution
Market Composition Insights for Santa Maria
- The Santa Maria Airbnb market composition is heavily skewed towards Entire Home/Apt listings, which make up 86% of the 328 active rentals. This indicates strong guest preference for privacy and space.
- Looking at the property type distribution in Santa Maria, Apartment/Condo properties are the most common (84.8%), reflecting the local real estate landscape.
- Smaller segments like outdoor/unique, hotel/boutique, others (combined 4.5%) offer potential for unique stay experiences.
Santa Maria Airbnb Room Capacity Analysis (2026): Bedroom Distribution
Distribution of Listings by Number of Bedrooms
Room Capacity Insights for Santa Maria
- The dominant room capacity in Santa Maria is 1 bedroom listings, making up 55.2% of the market. This suggests a strong demand for properties suitable for couples or solo travelers.
- Together, 1 bedroom and 2 bedrooms properties represent 74.7% of the active Airbnb listings in Santa Maria, indicating a high concentration in these sizes.
- With over half the market (55.2%) consisting of studios or 1-bedroom units, Santa Maria is particularly well-suited for individuals or couples.
- Listings with 3+ bedrooms (9.7%) represent a smaller niche, potentially indicating an underserved market for larger group accommodations in Santa Maria.
Santa Maria Vacation Rental Guest Capacity Trends (2026)
Distribution of Listings by Guest Capacity
Guest Capacity Insights for Santa Maria
- The most common guest capacity trend in Santa Maria vacation rentals is listings accommodating 4 guests (23.8%). This suggests the primary traveler segment is likely small families or groups.
- Properties designed for 4 guests and 2 guests dominate the Santa Maria STR market, accounting for 46.4% of listings.
- 15.9% of properties accommodate 6+ guests, serving the market segment for larger families or group travel in Santa Maria.
- On average, properties in Santa Maria are equipped to host 3.4 guests.
Santa Maria Airbnb Booking Patterns (2026): Available vs. Booked Days
Available Days Distribution
Booked Days Distribution
Booking Pattern Insights for Santa Maria
- The most common availability pattern in Santa Maria falls within the 271-366 days range, representing 58.2% of listings. This suggests many properties have significant open periods on their calendars.
- Approximately 87.5% of listings show high availability (181+ days open annually), indicating potential for increased bookings or specific owner usage patterns.
- For booked days, the 31-90 days range is most frequent in Santa Maria (33.5%), reflecting common guest stay durations or potential owner blocking patterns.
- A notable 13.7% of properties secure long booking periods (181+ days booked per year), highlighting successful long-term rental strategies or significant owner usage.
Santa Maria Airbnb Minimum Stay Requirements Analysis
Distribution of Listings by Minimum Night Requirement
1 Night
200 listings
61% of total
2 Nights
60 listings
18.3% of total
3 Nights
13 listings
4% of total
4-6 Nights
9 listings
2.7% of total
7-29 Nights
2 listings
0.6% of total
30+ Nights
44 listings
13.4% of total
Key Insights
- The most prevalent minimum stay requirement in Santa Maria is 1 Night, adopted by 61% of listings. This highlights the market's preference for shorter, flexible bookings.
- A strong majority (79.3%) of the Santa Maria Airbnb data shows acceptance of very short stays (1-2 nights), indicating a dynamic, high-turnover market.
- A significant segment (13.4%) caters to monthly stays (30+ nights) in Santa Maria, pointing to opportunities in the extended-stay market.
Recommendations
- Align with the market by considering a 1 Night minimum stay, as 61% of Santa Maria hosts use this setting.
- Explore offering discounts for stays of 30+ nights to attract the 13.4% of the market seeking extended stays.
- Adjust minimum nights based on seasonality – potentially shorter during low season and longer during peak demand periods in Santa Maria.
Santa Maria Airbnb Cancellation Policy Trends Analysis (2026)
Super Strict 30 Days
1 listings
0.3% of total
Limited
1 listings
0.3% of total
Flexible
122 listings
37.2% of total
Moderate
132 listings
40.2% of total
Firm
51 listings
15.5% of total
Strict
21 listings
6.4% of total
Cancellation Policy Insights for Santa Maria
- The prevailing Airbnb cancellation policy trend in Santa Maria is Moderate, used by 40.2% of listings.
- The market strongly favors guest-friendly terms, with 77.4% of listings offering Flexible or Moderate policies. This suggests guests in Santa Maria may expect booking flexibility.
- Strict cancellation policies are quite rare (6.4%), potentially making listings with this policy less competitive unless justified by high demand or property type.
Recommendations for Hosts
- Consider adopting a Moderate policy to align with the 40.2% market standard in Santa Maria.
- Using a Strict policy might deter some guests, as only 6.4% of listings use it. Evaluate if potential revenue protection outweighs possible lower booking rates.
- Regularly review your cancellation policy against competitors and market demand shifts in Santa Maria.
Santa Maria STR Booking Lead Time Analysis (2026)
Average Booking Lead Time by Month
Booking Lead Time Insights for Santa Maria
- The overall average booking lead time for vacation rentals in Santa Maria is 15 days.
- Guests book furthest in advance for stays during January (average 29 days), likely coinciding with peak travel demand or local events.
- The shortest booking windows occur for stays in June (average 10 days), indicating more last-minute travel plans during this time.
- Seasonally, Winter (20 days avg.) sees the longest lead times, while Spring (13 days avg.) has the shortest, reflecting typical travel planning cycles.
Recommendations for Hosts
- Use the overall average lead time (15 days) as a baseline for your pricing and availability strategy in Santa Maria.
- For January stays, consider implementing length-of-stay discounts or slightly higher rates for bookings made less than 29 days out to capitalize on advance planning.
- Target marketing efforts for the Winter season well in advance (at least 20 days) to capture early planners.
- Monitor your own booking lead times against these Santa Maria averages to identify opportunities for dynamic pricing adjustments.
Popular & Essential Airbnb Amenities in Santa Maria (2026)
Amenity Prevalence
Amenity Insights for Santa Maria
- Essential amenities in Santa Maria that guests expect include: Wifi, Kitchen. Lacking these (any) could significantly impact bookings.
- Popular amenities like TV, Air conditioning, Free parking on premises are common but not universal. Offering these can provide a competitive edge.
Recommendations for Hosts
- Ensure your listing includes all essential amenities for Santa Maria: Wifi, Kitchen.
- Prioritize adding missing essentials: Wifi, Kitchen.
- Consider adding popular differentiators like TV or Air conditioning to increase appeal.
- Highlight unique or less common amenities you offer (e.g., hot tub, dedicated workspace, EV charger) in your listing description and photos.
- Regularly check competitor amenities in Santa Maria to stay competitive.
Santa Maria Airbnb Guest Demographics & Profile Analysis (2026)
Guest Profile Summary for Santa Maria
- The typical guest profile for Airbnb in Santa Maria consists of primarily domestic travelers (93%), often arriving from nearby Rio Grande do Sul, typically belonging to the Post-2000s (Gen Z/Alpha) group (50%), primarily speaking Portuguese or English.
- Domestic travelers account for 93.3% of guests.
- Key international markets include Brazil (93.3%) and Uruguay (2.1%).
- Top languages spoken are Portuguese (48.3%) followed by English (25.3%).
- A significant demographic segment is the Post-2000s (Gen Z/Alpha) group, representing 50% of guests.
Recommendations for Hosts
- Target domestic marketing efforts towards travelers from Rio Grande do Sul and Porto Alegre.
- Tailor amenities and listing descriptions to appeal to the dominant Post-2000s (Gen Z/Alpha) demographic (e.g., highlight fast WiFi, smart home features, local guides).
- Highlight unique local experiences or amenities relevant to the primary guest profile.
- Consider seasonal promotions aligned with peak travel times for key origin markets.
Nearby Short-Term Rental Market Comparison
How does the Santa Maria Airbnb market stack up against its neighbors? Compare key performance metrics like average monthly revenue, ADR, and occupancy rates in surrounding areas to understand the broader regional STR landscape.
| Market | Active Properties | Monthly Revenue | Daily Rate | Avg. Occupancy |
|---|---|---|---|---|
| Ernestina | 13 | $682 | $142.94 | 21% |
| Itaara | 38 | $607 | $98.91 | 28% |
| Restinga Sêca | 10 | $498 | $75.11 | 27% |
| Venâncio Aires | 22 | $463 | $50.59 | 33% |
| Carazinho | 30 | $416 | $99.63 | 32% |
| Passo Fundo | 231 | $337 | $42.45 | 37% |
| Santa Cruz do Sul | 198 | $321 | $53.47 | 30% |
| Cachoeira do Sul | 56 | $222 | $28.46 | 31% |
| Não-Me-Toque | 10 | $218 | $142.68 | 17% |
| Pantano Grande | 18 | $197 | $70.81 | 28% |