São Miguel das Missões Airbnb Market Analysis 2026: Short Term Rental Data & Vacation Rental Statistics in Rio Grande do Sul, Brazil
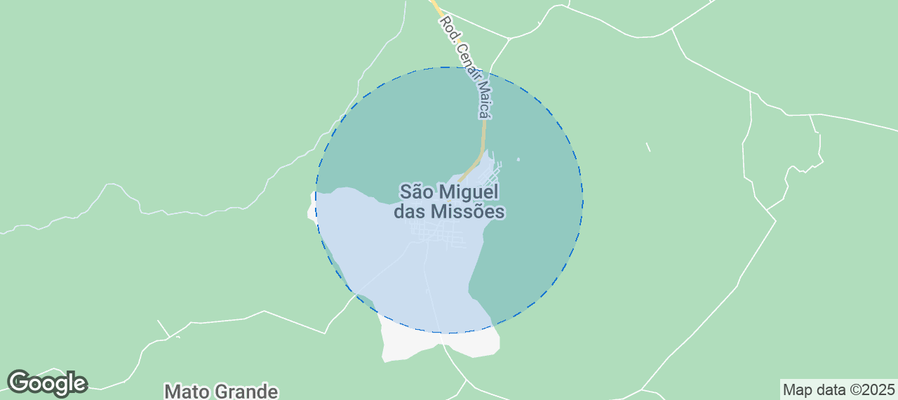
Is Airbnb profitable in São Miguel das Missões in 2026? Explore comprehensive Airbnb analytics for São Miguel das Missões, Rio Grande do Sul, Brazil to uncover income potential. This 2026 STR market report for São Miguel das Missões, based on AirROI data from February 2025 to January 2026, reveals key trends in the niche market of 25 active listings.
Whether you're considering an Airbnb investment in São Miguel das Missões, optimizing your existing vacation rental, or exploring rental arbitrage opportunities, understanding the São Miguel das Missões Airbnb data is crucial. Leveraging the low regulation environment is key to maximizing your short term rental income potential. Let's dive into the specifics.
Key São Miguel das Missões Airbnb Performance Metrics Overview
Monthly Airbnb Revenue Variations & Income Potential in São Miguel das Missões (2026)
Understanding the monthly revenue variations for Airbnb listings in São Miguel das Missões is key to maximizing your short term rental income potential. Seasonality significantly impacts earnings. Our analysis, based on data from the past 12 months, shows that the peak revenue month for STRs in São Miguel das Missões is typically December, while March often presents the lowest earnings, highlighting opportunities for strategic pricing adjustments during shoulder and low seasons. Explore the typical Airbnb income in São Miguel das Missões across different performance tiers:
- Best-in-class properties (Top 10%) achieve $474+ monthly, often utilizing dynamic pricing and superior guest experiences.
- Strong performing properties (Top 25%) earn $276 or more, indicating effective management and desirable locations/amenities.
- Typical properties (Median) generate around $158 per month, representing the average market performance.
- Entry-level properties (Bottom 25%) see earnings around $80, often with potential for optimization.
Average Monthly Airbnb Earnings Trend in São Miguel das Missões
São Miguel das Missões Airbnb Occupancy Rate Trends (2026)
Maximize your bookings by understanding the São Miguel das Missões STR occupancy trends. Seasonal demand shifts significantly influence how often properties are booked. Typically, Septembersees the highest demand (peak season occupancy), while June experiences the lowest (low season). Effective strategies, like adjusting minimum stays or offering promotions, can boost occupancy during slower periods. Here's how different property tiers perform in São Miguel das Missões:
- Best-in-class properties (Top 10%) achieve 42%+ occupancy, indicating high desirability and potentially optimized availability.
- Strong performing properties (Top 25%) maintain 24% or higher occupancy, suggesting good market fit and guest satisfaction.
- Typical properties (Median) have an occupancy rate around 12%.
- Entry-level properties (Bottom 25%) average 7% occupancy, potentially facing higher vacancy.
Average Monthly Occupancy Rate Trend in São Miguel das Missões
Average Daily Rate (ADR) Airbnb Trends in São Miguel das Missões (2026)
Effective short term rental pricing strategy in São Miguel das Missões involves understanding monthly ADR fluctuations. The Average Daily Rate (ADR) for Airbnb in São Miguel das Missões typically peaks in December and dips lowest during March. Leveraging Airbnb dynamic pricing tools or strategies based on this seasonality can significantly boost revenue. Here's a look at the typical nightly rates achieved:
- Best-in-class properties (Top 10%) command rates of $77+ per night, often due to premium features or locations.
- Strong performing properties (Top 25%) achieve nightly rates of $59 or more.
- Typical properties (Median) charge around $37 per night.
- Entry-level properties (Bottom 25%) earn around $28 per night.
Average Daily Rate (ADR) Trend by Month in São Miguel das Missões
Get Live São Miguel das Missões Market Intelligence 👇
Explore Real-time Analytics
Airbnb Seasonality Analysis & Trends in São Miguel das Missões (2026)
Peak Season (December, April, September)
- Revenue averages $304 per month
- Occupancy rates average 25.6%
- Daily rates average $47
Shoulder Season
- Revenue averages $212 per month
- Occupancy maintains around 18.5%
- Daily rates hold near $45
Low Season (March, June, October)
- Revenue drops to average $142 per month
- Occupancy decreases to average 11.3%
- Daily rates adjust to average $44
Seasonality Insights for São Miguel das Missões
- The Airbnb seasonality in São Miguel das Missões shows highly seasonal trends requiring careful strategy. While the sections above show seasonal averages, it's also insightful to look at the extremes:
- During the high season, the absolute peak month showcases São Miguel das Missões's highest earning potential, with monthly revenues capable of climbing to $342, occupancy reaching a high of 26.7%, and ADRs peaking at $49.
- Conversely, the slowest single month of the year, typically falling within the low season, marks the market's lowest point. In this month, revenue might dip to $129, occupancy could drop to 10.0%, and ADRs may adjust down to $41.
- Understanding both the seasonal averages and these monthly peaks and troughs in revenue, occupancy, and ADR is crucial for maximizing your Airbnb profit potential in São Miguel das Missões.
Seasonal Strategies for Maximizing Profit
- Peak Season: Maximize revenue through premium pricing and potentially longer minimum stays. Ensure high availability.
- Low Season: Offer competitive pricing, special promotions (e.g., extended stay discounts), and flexible cancellation policies. Target off-season travelers like remote workers or budget-conscious guests.
- Shoulder Seasons: Implement dynamic pricing that balances peak and low rates. Target weekend travelers or specific events. Offer slightly more flexible terms than peak season.
- Regularly analyze your own performance against these São Miguel das Missões seasonality benchmarks and adjust your pricing and availability strategy accordingly.
Best Areas for Airbnb Investment in S�ão Miguel das Missões (2026)
Exploring the top neighborhoods for short-term rentals in São Miguel das Missões? This section highlights key areas, outlining why they are attractive for hosts and guests, along with notable local attractions. Consider these locations based on your target guest profile and investment strategy.
| Neighborhood / Area | Why Host Here? (Target Guests & Appeal) | Key Attractions & Landmarks |
|---|---|---|
| Igreja das Missões | Historic church known for its stunning architecture and cultural significance, attracting both tourists and pilgrimage visits throughout the year. | São Miguel Arcanjo Ruins, Museum of the Missions, Cultural events, Nature trails |
| Centro Histórico | The historic center of São Miguel das Missões offers a lovely atmosphere and proximity to the main cultural attractions, making it appealing for heritage tourism. | Cultural Center, Local artisan shops, Gastronomy experiences, Historical landmarks |
| Parque Nacional das Missões | A national park featuring beautiful landscapes and wildlife, perfect for eco-tourism and outdoor activities, attracting nature lovers. | Trekking trails, Biodiversity tours, Birdwatching opportunities |
| Caminho dos Apóstolos | A pilgrimage route that attracts visitors interested in religious tourism and spiritual retreats, providing unique hosting opportunities. | Religious sites, Cultural experiences, Scenic views |
| Praça das Missões | Central square that serves as a hub for events and gatherings, making it an excellent location for tourists looking to engage with local culture events. | Local markets, Festivals, Entertainment, Food stalls |
| Cascata do Salto | A beautiful waterfall nearby that attracts nature enthusiasts and adventure tourists looking for outdoor experiences, suitable for Airbnb hosts focusing on nature experiences. | Hiking, Photography opportunities, Picnic areas |
| Rota dos Orixás | A scenic route with indigenous inspirations and cultural experiences, attracting people interested in indigenous history and nature. | Indigenous crafts, Cultural workshops, Nature experiences |
| Estação das Missões | The old train station turned cultural space that offers insight into the region’s history, making it a unique location for tourists interested in local culture. | Cultural events, Art exhibitions, Historical tours |
Understanding Airbnb License Requirements & STR Laws in São Miguel das Missões (2026)
While São Miguel das Missões, Rio Grande do Sul, Brazil currently shows low STR regulations, specific Airbnb license requirements might still exist or change. Always verify the latest short term rental regulations and Airbnb license requirements directly with local government authorities for São Miguel das Missões to ensure full compliance before hosting.
(Source: AirROI data, 2026, finding no licensed listings among those analyzed)
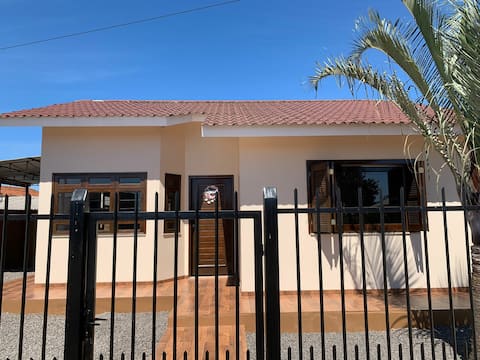
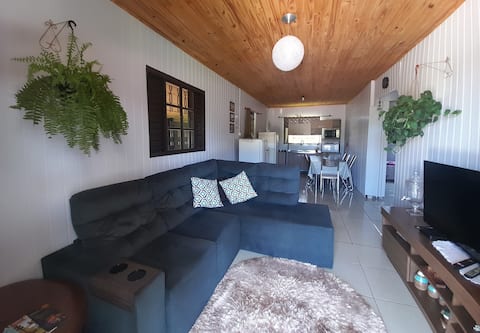
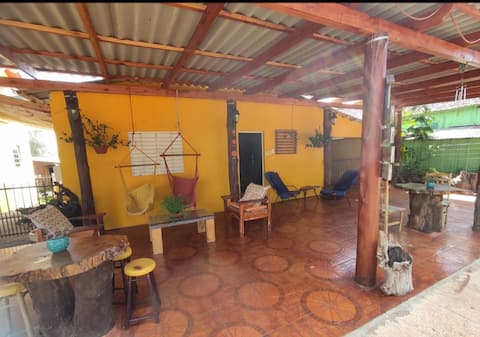
Top Performing Airbnb Properties in São Miguel das Missões (2026)
Benchmark your potential! Explore examples of top-performing Airbnb properties in São Miguel das Missõesbased on Trailing Twelve Month (TTM) revenue. Analyze their characteristics, revenue, occupancy rate, and ADR to understand what drives success in this market.
House a few meters from the Ruins. Call to negotiate
Entire Place • 2 bedrooms
Casa Encanto
Entire Place • 2 bedrooms
Avambaé house
Entire Place • 2 bedrooms

rental house 4 people
Entire Place • 2 bedrooms
Rental house for 2 people
Entire Place • 2 bedrooms
Two family rooms
Private Room • 2 bedrooms
Note: Performance varies based on location, size, amenities, seasonality, and management quality. Data reflects the past 12 months.
Top Performing Airbnb Hosts in São Miguel das Missões (2026)
Learn from the best! This table showcases top-performing Airbnb hosts in São Miguel das Missões based on the number of properties managed and estimated total revenue over the past year. Analyze their scale and performance metrics.
| Host Name | Properties | Grossing Revenue | Stay Reviews | Avg Rating |
|---|---|---|---|---|
| Karine Westerich | 5 | $8,085 | 15 | 5.00/5.0 |
| Diego | 5 | $6,138 | 158 | 4.99/5.0 |
| Maria Helena | 2 | $5,633 | 16 | 5.00/5.0 |
| Maurine | 1 | $4,884 | 121 | 4.93/5.0 |
| Andressa | 1 | $3,977 | 140 | 4.89/5.0 |
| Leda Maria Frizzo Moraes | 2 | $2,770 | 77 | 4.96/5.0 |
| Adriana | 1 | $1,942 | 22 | 4.91/5.0 |
| Norata | 1 | $1,916 | 12 | 4.83/5.0 |
| Inês | 2 | $1,911 | 274 | 4.93/5.0 |
| Kenedy | 1 | $600 | 9 | 5.00/5.0 |
Analyzing the strategies of top hosts, such as their property selection, pricing, and guest communication, can offer valuable lessons for optimizing your own Airbnb operations in São Miguel das Missões.
Dive Deeper: Advanced São Miguel das Missões STR Market Data (2026)
Ready to unlock more insights? AirROI provides access to advanced metrics and comprehensive Airbnb data for São Miguel das Missões. Explore detailed analytics beyond this report to refine your investment strategy, optimize pricing, and maximize your vacation rental profits.
Explore Advanced MetricsSão Miguel das Missões Short-Term Rental Market Composition (2026): Property & Room Types
Room Type Distribution
Property Type Distribution
Market Composition Insights for São Miguel das Missões
- The São Miguel das Missões Airbnb market composition is heavily skewed towards Entire Home/Apt listings, which make up 88% of the 25 active rentals. This indicates strong guest preference for privacy and space.
- Looking at the property type distribution in São Miguel das Missões, House properties are the most common (100%), reflecting the local real estate landscape.
- Houses represent a significant 100% portion, catering likely to families or larger groups.
São Miguel das Missões Airbnb Room Capacity Analysis (2026): Bedroom Distribution
Distribution of Listings by Number of Bedrooms
Room Capacity Insights for São Miguel das Missões
- The dominant room capacity in São Miguel das Missões is 2 bedrooms listings, making up 56% of the market. This suggests a strong demand for properties suitable for couples or solo travelers.
- Together, 2 bedrooms and 1 bedroom properties represent 72.0% of the active Airbnb listings in São Miguel das Missões, indicating a high concentration in these sizes.
São Miguel das Missões Vacation Rental Guest Capacity Trends (2026)
Distribution of Listings by Guest Capacity
Guest Capacity Insights for São Miguel das Missões
- The most common guest capacity trend in São Miguel das Missões vacation rentals is listings accommodating 4 guests (24%). This suggests the primary traveler segment is likely small families or groups.
- Properties designed for 4 guests and 2 guests dominate the São Miguel das Missões STR market, accounting for 44.0% of listings.
- 24.0% of properties accommodate 6+ guests, serving the market segment for larger families or group travel in São Miguel das Missões.
- On average, properties in São Miguel das Missões are equipped to host 3.7 guests.
São Miguel das Missões Airbnb Booking Patterns (2026): Available vs. Booked Days
Available Days Distribution
Booked Days Distribution
Booking Pattern Insights for São Miguel das Missões
- The most common availability pattern in São Miguel das Missões falls within the 271-366 days range, representing 88% of listings. This suggests many properties have significant open periods on their calendars.
- Approximately 100.0% of listings show high availability (181+ days open annually), indicating potential for increased bookings or specific owner usage patterns.
- For booked days, the 1-30 days range is most frequent in São Miguel das Missões (56%), reflecting common guest stay durations or potential owner blocking patterns.
São Miguel das Missões Airbnb Minimum Stay Requirements Analysis
Distribution of Listings by Minimum Night Requirement
1 Night
24 listings
96% of total
30+ Nights
1 listings
4% of total
Key Insights
- The most prevalent minimum stay requirement in São Miguel das Missões is 1 Night, adopted by 96% of listings. This highlights the market's preference for shorter, flexible bookings.
- A strong majority (96.0%) of the São Miguel das Missões Airbnb data shows acceptance of very short stays (1-2 nights), indicating a dynamic, high-turnover market.
Recommendations
- Align with the market by considering a 1 Night minimum stay, as 96% of São Miguel das Missões hosts use this setting.
- Adjust minimum nights based on seasonality – potentially shorter during low season and longer during peak demand periods in São Miguel das Missões.
São Miguel das Missões Airbnb Cancellation Policy Trends Analysis (2026)
Limited
1 listings
4% of total
Flexible
13 listings
52% of total
Moderate
2 listings
8% of total
Firm
9 listings
36% of total
Cancellation Policy Insights for São Miguel das Missões
- The prevailing Airbnb cancellation policy trend in São Miguel das Missões is Flexible, used by 52% of listings.
- There's a relatively balanced mix between guest-friendly (60.0%) and stricter (36.0%) policies, offering choices for different guest needs.
Recommendations for Hosts
- Consider adopting a Flexible policy to align with the 52% market standard in São Miguel das Missões.
- Given the high prevalence of Flexible policies (52%), offering this can enhance booking appeal, especially during shoulder seasons.
- Regularly review your cancellation policy against competitors and market demand shifts in São Miguel das Missões.
São Miguel das Missões STR Booking Lead Time Analysis (2026)
Average Booking Lead Time by Month
Booking Lead Time Insights for São Miguel das Missões
- The overall average booking lead time for vacation rentals in São Miguel das Missões is 24 days.
- Guests book furthest in advance for stays during December (average 52 days), likely coinciding with peak travel demand or local events.
- The shortest booking windows occur for stays in September (average 5 days), indicating more last-minute travel plans during this time.
- Seasonally, Winter (31 days avg.) sees the longest lead times, while Summer (17 days avg.) has the shortest, reflecting typical travel planning cycles.
Recommendations for Hosts
- Use the overall average lead time (24 days) as a baseline for your pricing and availability strategy in São Miguel das Missões.
- For December stays, consider implementing length-of-stay discounts or slightly higher rates for bookings made less than 52 days out to capitalize on advance planning.
- During September, focus on last-minute booking availability and promotions, as guests book with very short notice (5 days avg.).
- Target marketing efforts for the Winter season well in advance (at least 31 days) to capture early planners.
- Monitor your own booking lead times against these São Miguel das Missões averages to identify opportunities for dynamic pricing adjustments.
Popular & Essential Airbnb Amenities in São Miguel das Missões (2026)
Amenity Prevalence
Amenity Insights for São Miguel das Missões
- Essential amenities in São Miguel das Missões that guests expect include: Wifi, Kitchen, Air conditioning. Lacking these (any) could significantly impact bookings.
- Popular amenities like TV, Free parking on premises, Washer are common but not universal. Offering these can provide a competitive edge.
Recommendations for Hosts
- Ensure your listing includes all essential amenities for São Miguel das Missões: Wifi, Kitchen, Air conditioning.
- Prioritize adding missing essentials: Kitchen, Air conditioning.
- Consider adding popular differentiators like TV or Free parking on premises to increase appeal.
- Highlight unique or less common amenities you offer (e.g., hot tub, dedicated workspace, EV charger) in your listing description and photos.
- Regularly check competitor amenities in São Miguel das Missões to stay competitive.
São Miguel das Missões Airbnb Guest Demographics & Profile Analysis (2026)
Guest Profile Summary for São Miguel das Missões
- The typical guest profile for Airbnb in São Miguel das Missões consists of primarily domestic travelers (94%), often arriving from nearby Rio Grande do Sul, typically belonging to the Post-2000s (Gen Z/Alpha) group (50%), primarily speaking Portuguese or English.
- Domestic travelers account for 93.8% of guests.
- Key international markets include Brazil (93.8%) and Spain (1.2%).
- Top languages spoken are Portuguese (38.9%) followed by English (31.9%).
- A significant demographic segment is the Post-2000s (Gen Z/Alpha) group, representing 50% of guests.
Recommendations for Hosts
- Target domestic marketing efforts towards travelers from Rio Grande do Sul and Porto Alegre.
- Tailor amenities and listing descriptions to appeal to the dominant Post-2000s (Gen Z/Alpha) demographic (e.g., highlight fast WiFi, smart home features, local guides).
- Highlight unique local experiences or amenities relevant to the primary guest profile.
- Consider seasonal promotions aligned with peak travel times for key origin markets.
Nearby Short-Term Rental Market Comparison
How does the São Miguel das Missões Airbnb market stack up against its neighbors? Compare key performance metrics like average monthly revenue, ADR, and occupancy rates in surrounding areas to understand the broader regional STR landscape.
| Market | Active Properties | Monthly Revenue | Daily Rate | Avg. Occupancy |
|---|---|---|---|---|
| Itaara | 38 | $607 | $98.91 | 28% |
| Restinga Sêca | 10 | $498 | $75.11 | 27% |
| Frederico Westphalen | 15 | $405 | $37.43 | 40% |
| Ametista do Sul | 34 | $351 | $68.33 | 25% |
| Encarnación | 24 | $327 | $137.83 | 26% |
| Encarnacion | 220 | $321 | $71.77 | 24% |
| Posadas | 314 | $310 | $50.00 | 31% |
| Hohenau | 14 | $298 | $45.77 | 31% |
| Três Passos | 12 | $291 | $55.98 | 17% |
| Alegrete | 14 | $248 | $30.37 | 40% |