Olímpia Airbnb Market Analysis 2026: Short Term Rental Data & Vacation Rental Statistics in São Paulo, Brazil
Is Airbnb profitable in Olímpia in 2026? Explore comprehensive Airbnb analytics for Olímpia, São Paulo, Brazil to uncover income potential. This 2026 STR market report for Olímpia, based on AirROI data from February 2025 to January 2026, reveals key trends in the bustling market of 2,098 active listings.
Whether you're considering an Airbnb investment in Olímpia, optimizing your existing vacation rental, or exploring rental arbitrage opportunities, understanding the Olímpia Airbnb data is crucial. Leveraging the low regulation environment is key to maximizing your short term rental income potential. Let's dive into the specifics.
Key Olímpia Airbnb Performance Metrics Overview
Monthly Airbnb Revenue Variations & Income Potential in Olímpia (2026)
Understanding the monthly revenue variations for Airbnb listings in Olímpia is key to maximizing your short term rental income potential. Seasonality significantly impacts earnings. Our analysis, based on data from the past 12 months, shows that the peak revenue month for STRs in Olímpia is typically July, while April often presents the lowest earnings, highlighting opportunities for strategic pricing adjustments during shoulder and low seasons. Explore the typical Airbnb income in Olímpia across different performance tiers:
- Best-in-class properties (Top 10%) achieve $2,078+ monthly, often utilizing dynamic pricing and superior guest experiences.
- Strong performing properties (Top 25%) earn $1,537 or more, indicating effective management and desirable locations/amenities.
- Typical properties (Median) generate around $876 per month, representing the average market performance.
- Entry-level properties (Bottom 25%) see earnings around $388, often with potential for optimization.
Average Monthly Airbnb Earnings Trend in Olímpia
Olímpia Airbnb Occupancy Rate Trends (2026)
Maximize your bookings by understanding the Olímpia STR occupancy trends. Seasonal demand shifts significantly influence how often properties are booked. Typically, Julysees the highest demand (peak season occupancy), while January experiences the lowest (low season). Effective strategies, like adjusting minimum stays or offering promotions, can boost occupancy during slower periods. Here's how different property tiers perform in Olímpia:
- Best-in-class properties (Top 10%) achieve 89%+ occupancy, indicating high desirability and potentially optimized availability.
- Strong performing properties (Top 25%) maintain 68% or higher occupancy, suggesting good market fit and guest satisfaction.
- Typical properties (Median) have an occupancy rate around 34%.
- Entry-level properties (Bottom 25%) average 15% occupancy, potentially facing higher vacancy.
Average Monthly Occupancy Rate Trend in Olímpia
Average Daily Rate (ADR) Airbnb Trends in Olímpia (2026)
Effective short term rental pricing strategy in Olímpia involves understanding monthly ADR fluctuations. The Average Daily Rate (ADR) for Airbnb in Olímpia typically peaks in January and dips lowest during April. Leveraging Airbnb dynamic pricing tools or strategies based on this seasonality can significantly boost revenue. Here's a look at the typical nightly rates achieved:
- Best-in-class properties (Top 10%) command rates of $127+ per night, often due to premium features or locations.
- Strong performing properties (Top 25%) achieve nightly rates of $94 or more.
- Typical properties (Median) charge around $70 per night.
- Entry-level properties (Bottom 25%) earn around $56 per night.
Average Daily Rate (ADR) Trend by Month in Olímpia
Get Live Olímpia Market Intelligence 👇

Explore Real-time Analytics
Airbnb Seasonality Analysis & Trends in Olímpia (2026)
Peak Season (July, August, December)
- Revenue averages $1,242 per month
- Occupancy rates average 44.5%
- Daily rates average $86
Shoulder Season
- Revenue averages $1,016 per month
- Occupancy maintains around 41.1%
- Daily rates hold near $82
Low Season (April, May, June)
- Revenue drops to average $932 per month
- Occupancy decreases to average 39.9%
- Daily rates adjust to average $78
Seasonality Insights for Olímpia
- The Airbnb seasonality in Olímpia shows moderate seasonality with distinct peak and low periods. While the sections above show seasonal averages, it's also insightful to look at the extremes:
- During the high season, the absolute peak month showcases Olímpia's highest earning potential, with monthly revenues capable of climbing to $1,406, occupancy reaching a high of 51.9%, and ADRs peaking at $91.
- Conversely, the slowest single month of the year, typically falling within the low season, marks the market's lowest point. In this month, revenue might dip to $897, occupancy could drop to 32.6%, and ADRs may adjust down to $76.
- Understanding both the seasonal averages and these monthly peaks and troughs in revenue, occupancy, and ADR is crucial for maximizing your Airbnb profit potential in Olímpia.
Seasonal Strategies for Maximizing Profit
- Peak Season: Maximize revenue through premium pricing and potentially longer minimum stays. Ensure high availability.
- Low Season: Offer competitive pricing, special promotions (e.g., extended stay discounts), and flexible cancellation policies. Target off-season travelers like remote workers or budget-conscious guests.
- Shoulder Seasons: Implement dynamic pricing that balances peak and low rates. Target weekend travelers or specific events. Offer slightly more flexible terms than peak season.
- Regularly analyze your own performance against these Olímpia seasonality benchmarks and adjust your pricing and availability strategy accordingly.
Best Areas for Airbnb Investment in Olímpia (2026)
Exploring the top neighborhoods for short-term rentals in Olímpia? This section highlights key areas, outlining why they are attractive for hosts and guests, along with notable local attractions. Consider these locations based on your target guest profile and investment strategy.
| Neighborhood / Area | Why Host Here? (Target Guests & Appeal) | Key Attractions & Landmarks |
|---|---|---|
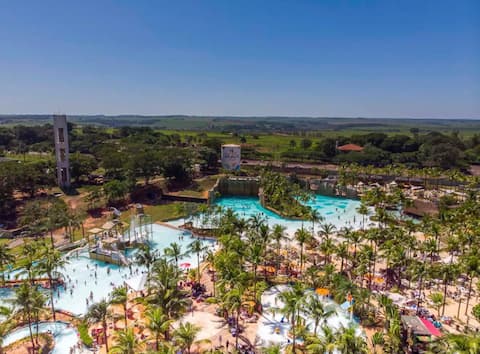
| Thermas dos Laranjais | One of the largest water parks in Brazil, Thermas dos Laranjais attracts families and tourists seeking fun and relaxation. The park's offerings make it a prime location for Airbnb investments during peak tourist seasons. | Thermas dos Laranjais Water Park, Parque Aquático, Hotel Fazenda, Aldeia das Águas Park Resort |
| Centro | The heart of Olímpia, Centro is filled with shops, restaurants, and cultural attractions. Its accessibility and vibrant atmosphere make it popular among visitors looking to experience local life. | Museu de História e Folclore de Olímpia, Igreja Matriz de São João Batista, shopping and dining options, local markets |
| Jardim das Oliveiras | This residential area is growing in popularity as a quiet neighborhood for families and travelers who want to stay close to the action while enjoying a peaceful environment. | Parks and green spaces, proximity to shopping areas, quiet streets |
| Parque Tropical | Known for its beautiful surroundings and leisure options, Parque Tropical is appealing to those seeking a tranquil and natural setting while being near tourist attractions. | nature trails, lakes, family-friendly activities |
| Cidades Parque | This region offers a variety of entertainment and dining options, making it an appealing destination for tourists wanting a mix of leisure and culture. | shopping centers, local cuisine restaurants, nightlife options |
| Residencial São José | A family-oriented neighborhood, Residencial São José provides comfortable accommodations for families visiting Thermas dos Laranjais and other attractions in Olímpia. | community parks, family-friendly services, child-friendly facilities |
| Golden Park | A newer development aimed at tourists, offering modern amenities and easy access to attractions, making it a great area for Airbnb hosting. | modern hotels, exclusive services, proximity to Thermas dos Laranjais |
| Zona Rural | The rural area surrounding Olímpia offers peace, natural beauty, and a glimpse of local agricultural life. It attracts tourists looking for a unique and immersive Brazilian experience. | farms, eco-tourism experiences, local crafts and produce |
Understanding Airbnb License Requirements & STR Laws in Olímpia (2026)
While Olímpia, São Paulo, Brazil currently shows low STR regulations, specific Airbnb license requirements might still exist or change. Always verify the latest short term rental regulations and Airbnb license requirements directly with local government authorities for Olímpia to ensure full compliance before hosting.
(Source: AirROI data, 2026, based on 0% licensed listings)
Top Performing Airbnb Properties in Olímpia (2026)
Benchmark your potential! Explore examples of top-performing Airbnb properties in Olímpiabased on Trailing Twelve Month (TTM) revenue. Analyze their characteristics, revenue, occupancy rate, and ADR to understand what drives success in this market.
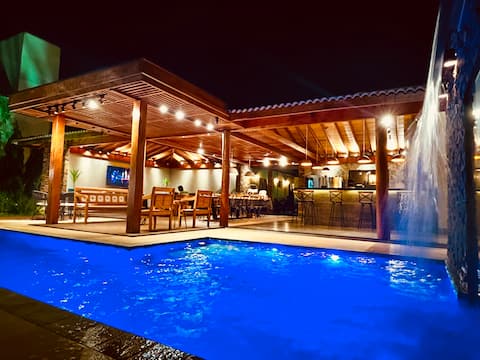
Heated Pool, 16 people, Close to Parks
Entire Place • 3 bedrooms

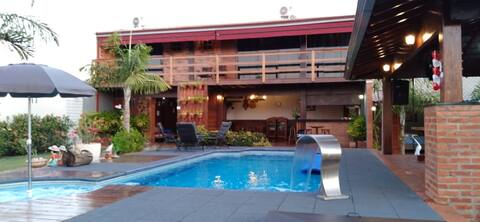
Apartment Resort Solar das Águas in Olímpia SP
Private Room • 1 bedroom
Enchanted Kingdom Corner
Entire Place • 6 bedrooms
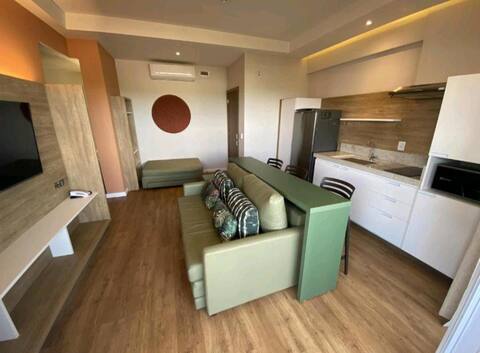
Apto. HotBeachSuites 2 Quartos/Cozinha
Entire Place • 2 bedrooms
Olímpia up to 6 people Hot Beach suits
Entire Place • 1 bedroom

Joy and fun for the whole family at the Olympic Park
Private Room • 2 bedrooms
Note: Performance varies based on location, size, amenities, seasonality, and management quality. Data reflects the past 12 months.
Top Performing Airbnb Hosts in Olímpia (2026)
Learn from the best! This table showcases top-performing Airbnb hosts in Olímpia based on the number of properties managed and estimated total revenue over the past year. Analyze their scale and performance metrics.
| Host Name | Properties | Grossing Revenue | Stay Reviews | Avg Rating |
|---|---|---|---|---|
| Luiz | 68 | $891,732 | 3891 | 4.82/5.0 |
| Denis | 34 | $164,101 | 982 | 4.86/5.0 |
| Maria Das Graças | 37 | $147,597 | 488 | 4.84/5.0 |
| Vanessa | 4 | $101,438 | 226 | 4.93/5.0 |
| Silvia | 9 | $100,319 | 71 | 4.91/5.0 |
| Tamy | 30 | $90,489 | 494 | 4.89/5.0 |
| Paulo Rogerio | 6 | $88,860 | 1066 | 4.80/5.0 |
| Claudio Gavim | 3 | $88,541 | 512 | 4.99/5.0 |
| Samuel | 8 | $86,211 | 442 | 4.98/5.0 |
| Thiago | 8 | $79,355 | 141 | 4.88/5.0 |
Analyzing the strategies of top hosts, such as their property selection, pricing, and guest communication, can offer valuable lessons for optimizing your own Airbnb operations in Olímpia.
Dive Deeper: Advanced Olímpia STR Market Data (2026)
Ready to unlock more insights? AirROI provides access to advanced metrics and comprehensive Airbnb data for Olímpia. Explore detailed analytics beyond this report to refine your investment strategy, optimize pricing, and maximize your vacation rental profits.
Explore Advanced MetricsOlímpia Short-Term Rental Market Composition (2026): Property & Room Types
Room Type Distribution
Property Type Distribution
Market Composition Insights for Olímpia
- The Olímpia Airbnb market composition is heavily skewed towards Entire Home/Apt listings, which make up 75.8% of the 2,098 active rentals. This indicates strong guest preference for privacy and space.
- Looking at the property type distribution in Olímpia, Apartment/Condo properties are the most common (54.3%), reflecting the local real estate landscape.
- Houses represent a significant 30.9% portion, catering likely to families or larger groups.
- The presence of 14.5% Hotel/Boutique listings indicates integration with traditional hospitality.
- Smaller segments like outdoor/unique, others (combined 0.2%) offer potential for unique stay experiences.
Olímpia Airbnb Room Capacity Analysis (2026): Bedroom Distribution
Distribution of Listings by Number of Bedrooms
Room Capacity Insights for Olímpia
- The dominant room capacity in Olímpia is 1 bedroom listings, making up 50.5% of the market. This suggests a strong demand for properties suitable for couples or solo travelers.
- Together, 1 bedroom and 2 bedrooms properties represent 77.2% of the active Airbnb listings in Olímpia, indicating a high concentration in these sizes.
- With over half the market (50.5%) consisting of studios or 1-bedroom units, Olímpia is particularly well-suited for individuals or couples.
Olímpia Vacation Rental Guest Capacity Trends (2026)
Distribution of Listings by Guest Capacity
Guest Capacity Insights for Olímpia
- The most common guest capacity trend in Olímpia vacation rentals is listings accommodating 8+ guests (34.3%). This suggests the primary traveler segment is likely larger groups.
- Properties designed for 8+ guests and 5 guests dominate the Olímpia STR market, accounting for 61.0% of listings.
- 66.8% of properties accommodate 6+ guests, serving the market segment for larger families or group travel in Olímpia.
- On average, properties in Olímpia are equipped to host 6.2 guests.
Olímpia Airbnb Booking Patterns (2026): Available vs. Booked Days
Available Days Distribution
Booked Days Distribution
Booking Pattern Insights for Olímpia
- The most common availability pattern in Olímpia falls within the 271-366 days range, representing 58.8% of listings. This suggests many properties have significant open periods on their calendars.
- Approximately 83.9% of listings show high availability (181+ days open annually), indicating potential for increased bookings or specific owner usage patterns.
- For booked days, the 31-90 days range is most frequent in Olímpia (31.6%), reflecting common guest stay durations or potential owner blocking patterns.
- A notable 16.9% of properties secure long booking periods (181+ days booked per year), highlighting successful long-term rental strategies or significant owner usage.
Olímpia Airbnb Minimum Stay Requirements Analysis
Distribution of Listings by Minimum Night Requirement
1 Night
481 listings
22.9% of total
2 Nights
671 listings
32% of total
3 Nights
252 listings
12% of total
4-6 Nights
79 listings
3.8% of total
7-29 Nights
15 listings
0.7% of total
30+ Nights
600 listings
28.6% of total
Key Insights
- The most prevalent minimum stay requirement in Olímpia is 2 Nights, adopted by 32% of listings. This highlights the market's preference for shorter, flexible bookings.
- A significant segment (28.6%) caters to monthly stays (30+ nights) in Olímpia, pointing to opportunities in the extended-stay market.
Recommendations
- Align with the market by considering a 2 Nights minimum stay, as 32% of Olímpia hosts use this setting.
- If feasible, allowing 1-night stays, especially midweek or during low season, could capture last-minute bookings, as only 22.9% currently do.
- Explore offering discounts for stays of 30+ nights to attract the 28.6% of the market seeking extended stays.
- Adjust minimum nights based on seasonality – potentially shorter during low season and longer during peak demand periods in Olímpia.
Olímpia Airbnb Cancellation Policy Trends Analysis (2026)
Super Strict 60 Days
1 listings
0% of total
Non-refundable
1 listings
0% of total
Refundable
1 listings
0% of total
Limited
11 listings
0.5% of total
Flexible
506 listings
24.2% of total
Moderate
362 listings
17.3% of total
Firm
852 listings
40.8% of total
Strict
356 listings
17% of total
Cancellation Policy Insights for Olímpia
- The prevailing Airbnb cancellation policy trend in Olímpia is Firm, used by 40.8% of listings.
- A majority (57.8%) of hosts in Olímpia utilize Firm or Strict policies, indicating a market where hosts prioritize booking security.
Recommendations for Hosts
- Consider adopting a Firm policy to align with the 40.8% market standard in Olímpia.
- Regularly review your cancellation policy against competitors and market demand shifts in Olímpia.
Olímpia STR Booking Lead Time Analysis (2026)
Average Booking Lead Time by Month
Booking Lead Time Insights for Olímpia
- The overall average booking lead time for vacation rentals in Olímpia is 83 days.
- Guests book furthest in advance for stays during August (average 103 days), likely coinciding with peak travel demand or local events.
- The shortest booking windows occur for stays in February (average 55 days), indicating more last-minute travel plans during this time.
- Seasonally, Summer (82 days avg.) sees the longest lead times, while Winter (64 days avg.) has the shortest, reflecting typical travel planning cycles.
Recommendations for Hosts
- Use the overall average lead time (83 days) as a baseline for your pricing and availability strategy in Olímpia.
- For August stays, consider implementing length-of-stay discounts or slightly higher rates for bookings made less than 103 days out to capitalize on advance planning.
- Target marketing efforts for the Summer season well in advance (at least 82 days) to capture early planners.
- Monitor your own booking lead times against these Olímpia averages to identify opportunities for dynamic pricing adjustments.
Popular & Essential Airbnb Amenities in Olímpia (2026)
Amenity Prevalence
Amenity Insights for Olímpia
- Essential amenities in Olímpia that guests expect include: TV, Wifi, Free parking on premises, Air conditioning. Lacking these (any) could significantly impact bookings.
- Popular amenities like Pool, Kitchen, Fire extinguisher are common but not universal. Offering these can provide a competitive edge.
- A pool is a highly desired but not standard amenity, making it a key feature for attracting guests seeking leisure in Olímpia.
Recommendations for Hosts
- Ensure your listing includes all essential amenities for Olímpia: TV, Wifi, Free parking on premises, Air conditioning.
- Prioritize adding missing essentials: TV, Wifi, Free parking on premises, Air conditioning.
- Consider adding popular differentiators like Pool or Kitchen to increase appeal.
- Highlight unique or less common amenities you offer (e.g., hot tub, dedicated workspace, EV charger) in your listing description and photos.
- Regularly check competitor amenities in Olímpia to stay competitive.
Olímpia Airbnb Guest Demographics & Profile Analysis (2026)
Guest Profile Summary for Olímpia
- The typical guest profile for Airbnb in Olímpia consists of primarily domestic travelers (99%), often arriving from nearby São Paulo, typically belonging to the Post-2000s (Gen Z/Alpha) group (50%), primarily speaking Portuguese or English.
- Domestic travelers account for 98.7% of guests.
- Key international markets include Brazil (98.7%) and United States (0.2%).
- Top languages spoken are Portuguese (62.4%) followed by English (23.4%).
- A significant demographic segment is the Post-2000s (Gen Z/Alpha) group, representing 50% of guests.
Recommendations for Hosts
- Target domestic marketing efforts towards travelers from São Paulo and Rio de Janeiro.
- Tailor amenities and listing descriptions to appeal to the dominant Post-2000s (Gen Z/Alpha) demographic (e.g., highlight fast WiFi, smart home features, local guides).
- Highlight unique local experiences or amenities relevant to the primary guest profile.
- Consider seasonal promotions aligned with peak travel times for key origin markets.
Nearby Short-Term Rental Market Comparison
How does the Olímpia Airbnb market stack up against its neighbors? Compare key performance metrics like average monthly revenue, ADR, and occupancy rates in surrounding areas to understand the broader regional STR landscape.
| Market | Active Properties | Monthly Revenue | Daily Rate | Avg. Occupancy |
|---|---|---|---|---|
| Rifaina | 41 | $870 | $187.69 | 23% |
| Miguelópolis | 15 | $795 | $231.92 | 22% |
| Santa Rita do Passa Quatro | 27 | $712 | $121.97 | 25% |
| Sacramento | 10 | $555 | $157.42 | 22% |
| Ribeirão Preto | 1,432 | $442 | $67.94 | 35% |
| São José do Rio Preto | 463 | $390 | $45.23 | 39% |
| Bebedouro | 14 | $341 | $39.48 | 34% |
| Barretos | 342 | $337 | $81.78 | 33% |
| Votuporanga | 14 | $324 | $78.96 | 33% |
| Catanduva | 24 | $323 | $41.25 | 37% |