São Vicente Airbnb Market Analysis 2026: Short Term Rental Data & Vacation Rental Statistics in São Paulo, Brazil
Is Airbnb profitable in São Vicente in 2026? Explore comprehensive Airbnb analytics for São Vicente, São Paulo, Brazil to uncover income potential. This 2026 STR market report for São Vicente, based on AirROI data from February 2025 to January 2026, reveals key trends in the market of 908 active listings.
Whether you're considering an Airbnb investment in São Vicente, optimizing your existing vacation rental, or exploring rental arbitrage opportunities, understanding the São Vicente Airbnb data is crucial. Leveraging the low regulation environment is key to maximizing your short term rental income potential. Let's dive into the specifics.
Key São Vicente Airbnb Performance Metrics Overview
Monthly Airbnb Revenue Variations & Income Potential in São Vicente (2026)
Understanding the monthly revenue variations for Airbnb listings in São Vicente is key to maximizing your short term rental income potential. Seasonality significantly impacts earnings. Our analysis, based on data from the past 12 months, shows that the peak revenue month for STRs in São Vicente is typically December, while August often presents the lowest earnings, highlighting opportunities for strategic pricing adjustments during shoulder and low seasons. Explore the typical Airbnb income in São Vicente across different performance tiers:
- Best-in-class properties (Top 10%) achieve $1,019+ monthly, often utilizing dynamic pricing and superior guest experiences.
- Strong performing properties (Top 25%) earn $658 or more, indicating effective management and desirable locations/amenities.
- Typical properties (Median) generate around $357 per month, representing the average market performance.
- Entry-level properties (Bottom 25%) see earnings around $165, often with potential for optimization.
Average Monthly Airbnb Earnings Trend in São Vicente
São Vicente Airbnb Occupancy Rate Trends (2026)
Maximize your bookings by understanding the São Vicente STR occupancy trends. Seasonal demand shifts significantly influence how often properties are booked. Typically, Februarysees the highest demand (peak season occupancy), while June experiences the lowest (low season). Effective strategies, like adjusting minimum stays or offering promotions, can boost occupancy during slower periods. Here's how different property tiers perform in São Vicente:
- Best-in-class properties (Top 10%) achieve 73%+ occupancy, indicating high desirability and potentially optimized availability.
- Strong performing properties (Top 25%) maintain 50% or higher occupancy, suggesting good market fit and guest satisfaction.
- Typical properties (Median) have an occupancy rate around 27%.
- Entry-level properties (Bottom 25%) average 12% occupancy, potentially facing higher vacancy.
Average Monthly Occupancy Rate Trend in São Vicente
Average Daily Rate (ADR) Airbnb Trends in São Vicente (2026)
Effective short term rental pricing strategy in São Vicente involves understanding monthly ADR fluctuations. The Average Daily Rate (ADR) for Airbnb in São Vicente typically peaks in December and dips lowest during April. Leveraging Airbnb dynamic pricing tools or strategies based on this seasonality can significantly boost revenue. Here's a look at the typical nightly rates achieved:
- Best-in-class properties (Top 10%) command rates of $78+ per night, often due to premium features or locations.
- Strong performing properties (Top 25%) achieve nightly rates of $56 or more.
- Typical properties (Median) charge around $41 per night.
- Entry-level properties (Bottom 25%) earn around $32 per night.
Average Daily Rate (ADR) Trend by Month in São Vicente
Get Live São Vicente Market Intelligence 👇

Explore Real-time Analytics
Airbnb Seasonality Analysis & Trends in São Vicente (2026)
Peak Season (December, January, November)
- Revenue averages $662 per month
- Occupancy rates average 36.7%
- Daily rates average $60
Shoulder Season
- Revenue averages $449 per month
- Occupancy maintains around 34.8%
- Daily rates hold near $50
Low Season (May, June, August)
- Revenue drops to average $359 per month
- Occupancy decreases to average 28.0%
- Daily rates adjust to average $49
Seasonality Insights for São Vicente
- The Airbnb seasonality in São Vicente shows highly seasonal trends requiring careful strategy. While the sections above show seasonal averages, it's also insightful to look at the extremes:
- During the high season, the absolute peak month showcases São Vicente's highest earning potential, with monthly revenues capable of climbing to $778, occupancy reaching a high of 40.4%, and ADRs peaking at $64.
- Conversely, the slowest single month of the year, typically falling within the low season, marks the market's lowest point. In this month, revenue might dip to $349, occupancy could drop to 26.4%, and ADRs may adjust down to $46.
- Understanding both the seasonal averages and these monthly peaks and troughs in revenue, occupancy, and ADR is crucial for maximizing your Airbnb profit potential in São Vicente.
Seasonal Strategies for Maximizing Profit
- Peak Season: Maximize revenue through premium pricing and potentially longer minimum stays. Ensure high availability.
- Low Season: Offer competitive pricing, special promotions (e.g., extended stay discounts), and flexible cancellation policies. Target off-season travelers like remote workers or budget-conscious guests.
- Shoulder Seasons: Implement dynamic pricing that balances peak and low rates. Target weekend travelers or specific events. Offer slightly more flexible terms than peak season.
- Regularly analyze your own performance against these São Vicente seasonality benchmarks and adjust your pricing and availability strategy accordingly.
Best Areas for Airbnb Investment in São Vicente (2026)
Exploring the top neighborhoods for short-term rentals in São Vicente? This section highlights key areas, outlining why they are attractive for hosts and guests, along with notable local attractions. Consider these locations based on your target guest profile and investment strategy.
| Neighborhood / Area | Why Host Here? (Target Guests & Appeal) | Key Attractions & Landmarks |
|---|---|---|
| Praia do Itararé | One of the most popular beaches in São Vicente, attracting beachgoers looking for sun and water sports. Ideal for tourists wanting easy access to the beach and local dining options. | Itararé Beach, Fort of São Vicente, Calçada da Fama, Shopping Brisamar, Joyce's Beach Bar |
| Centro Histórico | The historic center of São Vicente offers rich history, culture, and proximity to local markets and historical landmarks. A perfect area for those interested in culture and heritage tourism. | São Vicente Church, Praça 22 de Janeiro, Museu de Santo André, Mercado Municipal, Cine Roxy |
| Vila Cascais | A charming neighborhood known for its calm atmosphere and beautiful coastline, ideal for families and couples looking for a peaceful getaway. | Cascais Beach, Ponta da Praia, Biquinha de Anchieta, Praia dos Milionários, Seafront promenade |
| Enseada | Famous for its long stretch of beach and vibrant nightlife. Ideal for nightlife seekers and tourists looking for beach entertainment. | Enseada Beach, Aquário de Santos, Shopping Jequitimar, Praia do Pernambuco, Nightclubs and bars |
| Vila Valença | A quieter residential area with a local vibe, great for travelers wanting to experience the local culture, yet close to tourist attractions. | Local markets, Parks and gardens, Cafes and restaurants, Cultural events, Proximity to Itararé Beach |
| Santos | Just across the bay, Santos offers a mix of beach, culture and urban life. A vibrant area that attracts both beachgoers and culture seekers. | Praia de Santos, Santos Coffee Museum, Orchid Garden, Jardins da Orla, Museu do Futebol |
| Gonzaguinha | A increasingly popular area with beautiful beaches and typical seaside charm, suitable for families and those looking for coastal relaxation. | Gonzaguinha Beach, Cultural festivals, Local artisan shops, Beachfront dining, Promenade events |
| Praia do Boqueirão | Famed for its strong community feel and picturesque views, this area is fantastic for tourists seeking both relaxation and a glimpse into local life. | Boqueirão Beach, Boardwalk and bike path, Parks, Local eateries, Community events |
Understanding Airbnb License Requirements & STR Laws in São Vicente (2026)
While São Vicente, São Paulo, Brazil currently shows low STR regulations, specific Airbnb license requirements might still exist or change. Always verify the latest short term rental regulations and Airbnb license requirements directly with local government authorities for São Vicente to ensure full compliance before hosting.
(Source: AirROI data, 2026, based on 0% licensed listings)
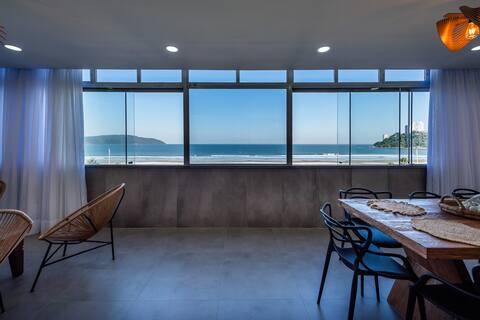
Top Performing Airbnb Properties in São Vicente (2026)
Benchmark your potential! Explore examples of top-performing Airbnb properties in São Vicentebased on Trailing Twelve Month (TTM) revenue. Analyze their characteristics, revenue, occupancy rate, and ADR to understand what drives success in this market.

Amazing View of the SEA | Parking | Wi-Fi
Entire Place • 3 bedrooms

Estúdio Ilha Residence - Vista Espetacular do mar
Entire Place • 1 bedroom

Very nice - up to 7 guests - up to 2 garages
Entire Place • 2 bedrooms

Loft with spectacular ocean view and air conditioning
Entire Place • 1 bedroom
PANORAMIC SEA VIEW | Garage | Air-conditioning | Wi-Fi
Entire Place • 3 bedrooms

Beachfront apartment, sleep with the sound of the sea
Entire Place • 3 bedrooms
Note: Performance varies based on location, size, amenities, seasonality, and management quality. Data reflects the past 12 months.
Top Performing Airbnb Hosts in São Vicente (2026)
Learn from the best! This table showcases top-performing Airbnb hosts in São Vicente based on the number of properties managed and estimated total revenue over the past year. Analyze their scale and performance metrics.
| Host Name | Properties | Grossing Revenue | Stay Reviews | Avg Rating |
|---|---|---|---|---|
| Victor | 10 | $67,910 | 546 | 4.68/5.0 |
| Suiteslitoral | 5 | $56,815 | 798 | 4.88/5.0 |
| Silvana | 5 | $54,092 | 92 | 4.96/5.0 |
| Patricia | 3 | $42,813 | 1596 | 4.90/5.0 |
| Marcio | 7 | $41,317 | 390 | 4.94/5.0 |
| Raquel | 10 | $41,081 | 432 | 4.84/5.0 |
| Roberta Molinari | 2 | $32,237 | 251 | 4.96/5.0 |
| Bertha | 3 | $30,142 | 642 | 4.99/5.0 |
| Ana Corrêa | 4 | $29,576 | 93 | 4.87/5.0 |
| Fagner | 1 | $26,968 | 18 | 4.83/5.0 |
Analyzing the strategies of top hosts, such as their property selection, pricing, and guest communication, can offer valuable lessons for optimizing your own Airbnb operations in São Vicente.
Dive Deeper: Advanced São Vicente STR Market Data (2026)
Ready to unlock more insights? AirROI provides access to advanced metrics and comprehensive Airbnb data for São Vicente. Explore detailed analytics beyond this report to refine your investment strategy, optimize pricing, and maximize your vacation rental profits.
Explore Advanced MetricsSão Vicente Short-Term Rental Market Composition (2026): Property & Room Types
Room Type Distribution
Property Type Distribution
Market Composition Insights for São Vicente
- The São Vicente Airbnb market composition is heavily skewed towards Entire Home/Apt listings, which make up 97.8% of the 908 active rentals. This indicates strong guest preference for privacy and space.
- Looking at the property type distribution in São Vicente, Apartment/Condo properties are the most common (96%), reflecting the local real estate landscape.
- Smaller segments like house, hotel/boutique, others (combined 4.0%) offer potential for unique stay experiences.
São Vicente Airbnb Room Capacity Analysis (2026): Bedroom Distribution
Distribution of Listings by Number of Bedrooms
Room Capacity Insights for São Vicente
- The dominant room capacity in São Vicente is 1 bedroom listings, making up 68.3% of the market. This suggests a strong demand for properties suitable for couples or solo travelers.
- Together, 1 bedroom and 2 bedrooms properties represent 83.4% of the active Airbnb listings in São Vicente, indicating a high concentration in these sizes.
- With over half the market (68.3%) consisting of studios or 1-bedroom units, São Vicente is particularly well-suited for individuals or couples.
- Listings with 3+ bedrooms (4.4%) represent a smaller niche, potentially indicating an underserved market for larger group accommodations in São Vicente.
São Vicente Vacation Rental Guest Capacity Trends (2026)
Distribution of Listings by Guest Capacity
Guest Capacity Insights for São Vicente
- The most common guest capacity trend in São Vicente vacation rentals is listings accommodating 4 guests (42.7%). This suggests the primary traveler segment is likely small families or groups.
- Properties designed for 4 guests and 2 guests dominate the São Vicente STR market, accounting for 55.8% of listings.
- 19.6% of properties accommodate 6+ guests, serving the market segment for larger families or group travel in São Vicente.
- On average, properties in São Vicente are equipped to host 4.2 guests.
São Vicente Airbnb Booking Patterns (2026): Available vs. Booked Days
Available Days Distribution
Booked Days Distribution
Booking Pattern Insights for São Vicente
- The most common availability pattern in São Vicente falls within the 271-366 days range, representing 67.6% of listings. This suggests many properties have significant open periods on their calendars.
- Approximately 90.6% of listings show high availability (181+ days open annually), indicating potential for increased bookings or specific owner usage patterns.
- For booked days, the 31-90 days range is most frequent in São Vicente (34.6%), reflecting common guest stay durations or potential owner blocking patterns.
- A notable 9.8% of properties secure long booking periods (181+ days booked per year), highlighting successful long-term rental strategies or significant owner usage.
São Vicente Airbnb Minimum Stay Requirements Analysis
Distribution of Listings by Minimum Night Requirement
1 Night
273 listings
30.1% of total
2 Nights
317 listings
35% of total
3 Nights
26 listings
2.9% of total
4-6 Nights
11 listings
1.2% of total
7-29 Nights
3 listings
0.3% of total
30+ Nights
277 listings
30.5% of total
Key Insights
- The most prevalent minimum stay requirement in São Vicente is 2 Nights, adopted by 35% of listings. This highlights the market's preference for shorter, flexible bookings.
- A strong majority (65.1%) of the São Vicente Airbnb data shows acceptance of very short stays (1-2 nights), indicating a dynamic, high-turnover market.
- A significant segment (30.5%) caters to monthly stays (30+ nights) in São Vicente, pointing to opportunities in the extended-stay market.
Recommendations
- Align with the market by considering a 2 Nights minimum stay, as 35% of São Vicente hosts use this setting.
- Explore offering discounts for stays of 30+ nights to attract the 30.5% of the market seeking extended stays.
- Adjust minimum nights based on seasonality – potentially shorter during low season and longer during peak demand periods in São Vicente.
São Vicente Airbnb Cancellation Policy Trends Analysis (2026)
Limited
15 listings
1.7% of total
Super Strict 30 Days
1 listings
0.1% of total
Flexible
243 listings
26.8% of total
Moderate
272 listings
30% of total
Firm
280 listings
30.9% of total
Strict
95 listings
10.5% of total
Cancellation Policy Insights for São Vicente
- The prevailing Airbnb cancellation policy trend in São Vicente is Firm, used by 30.9% of listings.
- There's a relatively balanced mix between guest-friendly (56.8%) and stricter (41.4%) policies, offering choices for different guest needs.
Recommendations for Hosts
- Consider adopting a Firm policy to align with the 30.9% market standard in São Vicente.
- Using a Strict policy might deter some guests, as only 10.5% of listings use it. Evaluate if potential revenue protection outweighs possible lower booking rates.
- Regularly review your cancellation policy against competitors and market demand shifts in São Vicente.
São Vicente STR Booking Lead Time Analysis (2026)
Average Booking Lead Time by Month
Booking Lead Time Insights for São Vicente
- The overall average booking lead time for vacation rentals in São Vicente is 26 days.
- Guests book furthest in advance for stays during December (average 49 days), likely coinciding with peak travel demand or local events.
- The shortest booking windows occur for stays in July (average 11 days), indicating more last-minute travel plans during this time.
- Seasonally, Winter (31 days avg.) sees the longest lead times, while Summer (13 days avg.) has the shortest, reflecting typical travel planning cycles.
Recommendations for Hosts
- Use the overall average lead time (26 days) as a baseline for your pricing and availability strategy in São Vicente.
- For December stays, consider implementing length-of-stay discounts or slightly higher rates for bookings made less than 49 days out to capitalize on advance planning.
- During July, focus on last-minute booking availability and promotions, as guests book with very short notice (11 days avg.).
- Target marketing efforts for the Winter season well in advance (at least 31 days) to capture early planners.
- Monitor your own booking lead times against these São Vicente averages to identify opportunities for dynamic pricing adjustments.
Popular & Essential Airbnb Amenities in São Vicente (2026)
Amenity Prevalence
Amenity Insights for São Vicente
- Essential amenities in São Vicente that guests expect include: Kitchen, TV. Lacking these (any) could significantly impact bookings.
- Popular amenities like Wifi, Dishes and silverware, Beach access are common but not universal. Offering these can provide a competitive edge.
- Warning: Wifi is not universally provided but is considered essential globally. Ensure reliable Wifi is offered.
Recommendations for Hosts
- Ensure your listing includes all essential amenities for São Vicente: Kitchen, TV.
- Prioritize adding missing essentials: Kitchen, TV.
- Consider adding popular differentiators like Wifi or Dishes and silverware to increase appeal.
- Highlight unique or less common amenities you offer (e.g., hot tub, dedicated workspace, EV charger) in your listing description and photos.
- Regularly check competitor amenities in São Vicente to stay competitive.
São Vicente Airbnb Guest Demographics & Profile Analysis (2026)
Guest Profile Summary for São Vicente
- The typical guest profile for Airbnb in São Vicente consists of primarily domestic travelers (96%), often arriving from nearby São Paulo, typically belonging to the Post-2000s (Gen Z/Alpha) group (50%), primarily speaking Portuguese or English.
- Domestic travelers account for 95.8% of guests.
- Key international markets include Brazil (95.8%) and United States (0.9%).
- Top languages spoken are Portuguese (55.2%) followed by English (25.7%).
- A significant demographic segment is the Post-2000s (Gen Z/Alpha) group, representing 50% of guests.
Recommendations for Hosts
- Target domestic marketing efforts towards travelers from São Paulo and Santos.
- Tailor amenities and listing descriptions to appeal to the dominant Post-2000s (Gen Z/Alpha) demographic (e.g., highlight fast WiFi, smart home features, local guides).
- Highlight unique local experiences or amenities relevant to the primary guest profile.
- Consider seasonal promotions aligned with peak travel times for key origin markets.
Nearby Short-Term Rental Market Comparison
How does the São Vicente Airbnb market stack up against its neighbors? Compare key performance metrics like average monthly revenue, ADR, and occupancy rates in surrounding areas to understand the broader regional STR landscape.
| Market | Active Properties | Monthly Revenue | Daily Rate | Avg. Occupancy |
|---|---|---|---|---|
| Riviera de São Lourenço | 10 | $2,868 | $213.78 | 46% |
| Tuiuti | 18 | $1,686 | $156.45 | 30% |
| Itupeva | 136 | $1,561 | $225.82 | 28% |
| Morungaba | 31 | $1,435 | $263.39 | 27% |
| Campo Limpo Paulista | 49 | $1,428 | $181.02 | 30% |
| Valinhos | 61 | $1,370 | $176.28 | 33% |
| Itatiba | 171 | $1,331 | $177.58 | 29% |
| Vargem | 48 | $1,319 | $190.42 | 28% |
| Elias Fausto | 13 | $1,296 | $143.78 | 30% |
| Porto Feliz | 69 | $1,279 | $260.86 | 27% |