Obzor Airbnb Market Analysis 2026: Short Term Rental Data & Vacation Rental Statistics in Burgas, Bulgaria
Is Airbnb profitable in Obzor in 2026? Explore comprehensive Airbnb analytics for Obzor, Burgas, Bulgaria to uncover income potential. This 2026 STR market report for Obzor, based on AirROI data from February 2025 to January 2026, reveals key trends in the niche market of 45 active listings.
Whether you're considering an Airbnb investment in Obzor, optimizing your existing vacation rental, or exploring rental arbitrage opportunities, understanding the Obzor Airbnb data is crucial. Leveraging the low regulation environment is key to maximizing your short term rental income potential. Let's dive into the specifics.
Key Obzor Airbnb Performance Metrics Overview
Monthly Airbnb Revenue Variations & Income Potential in Obzor (2026)
Understanding the monthly revenue variations for Airbnb listings in Obzor is key to maximizing your short term rental income potential. Seasonality significantly impacts earnings. Our analysis, based on data from the past 12 months, shows that the peak revenue month for STRs in Obzor is typically August, while December often presents the lowest earnings, highlighting opportunities for strategic pricing adjustments during shoulder and low seasons. Explore the typical Airbnb income in Obzor across different performance tiers:
- Best-in-class properties (Top 10%) achieve $1,454+ monthly, often utilizing dynamic pricing and superior guest experiences.
- Strong performing properties (Top 25%) earn $1,090 or more, indicating effective management and desirable locations/amenities.
- Typical properties (Median) generate around $546 per month, representing the average market performance.
- Entry-level properties (Bottom 25%) see earnings around $345, often with potential for optimization.
Average Monthly Airbnb Earnings Trend in Obzor
Obzor Airbnb Occupancy Rate Trends (2026)
Maximize your bookings by understanding the Obzor STR occupancy trends. Seasonal demand shifts significantly influence how often properties are booked. Typically, Augustsees the highest demand (peak season occupancy), while December experiences the lowest (low season). Effective strategies, like adjusting minimum stays or offering promotions, can boost occupancy during slower periods. Here's how different property tiers perform in Obzor:
- Best-in-class properties (Top 10%) achieve 39%+ occupancy, indicating high desirability and potentially optimized availability.
- Strong performing properties (Top 25%) maintain 33% or higher occupancy, suggesting good market fit and guest satisfaction.
- Typical properties (Median) have an occupancy rate around 20%.
- Entry-level properties (Bottom 25%) average 12% occupancy, potentially facing higher vacancy.
Average Monthly Occupancy Rate Trend in Obzor
Average Daily Rate (ADR) Airbnb Trends in Obzor (2026)
Effective short term rental pricing strategy in Obzor involves understanding monthly ADR fluctuations. The Average Daily Rate (ADR) for Airbnb in Obzor typically peaks in August and dips lowest during April. Leveraging Airbnb dynamic pricing tools or strategies based on this seasonality can significantly boost revenue. Here's a look at the typical nightly rates achieved:
- Best-in-class properties (Top 10%) command rates of $130+ per night, often due to premium features or locations.
- Strong performing properties (Top 25%) achieve nightly rates of $105 or more.
- Typical properties (Median) charge around $75 per night.
- Entry-level properties (Bottom 25%) earn around $57 per night.
Average Daily Rate (ADR) Trend by Month in Obzor
Get Live Obzor Market Intelligence 👇

Explore Real-time Analytics
Airbnb Seasonality Analysis & Trends in Obzor (2026)
Peak Season (August, July, February)
- Revenue averages $1,557 per month
- Occupancy rates average 45.6%
- Daily rates average $93
Shoulder Season
- Revenue averages $521 per month
- Occupancy maintains around 17.6%
- Daily rates hold near $79
Low Season (January, November, December)
- Revenue drops to average $290 per month
- Occupancy decreases to average 11.3%
- Daily rates adjust to average $80
Seasonality Insights for Obzor
- The Airbnb seasonality in Obzor shows highly seasonal trends requiring careful strategy. While the sections above show seasonal averages, it's also insightful to look at the extremes:
- During the high season, the absolute peak month showcases Obzor's highest earning potential, with monthly revenues capable of climbing to $2,032, occupancy reaching a high of 53.8%, and ADRs peaking at $103.
- Conversely, the slowest single month of the year, typically falling within the low season, marks the market's lowest point. In this month, revenue might dip to $231, occupancy could drop to 7.5%, and ADRs may adjust down to $72.
- Understanding both the seasonal averages and these monthly peaks and troughs in revenue, occupancy, and ADR is crucial for maximizing your Airbnb profit potential in Obzor.
Seasonal Strategies for Maximizing Profit
- Peak Season: Maximize revenue through premium pricing and potentially longer minimum stays. Ensure high availability.
- Low Season: Offer competitive pricing, special promotions (e.g., extended stay discounts), and flexible cancellation policies. Target off-season travelers like remote workers or budget-conscious guests.
- Shoulder Seasons: Implement dynamic pricing that balances peak and low rates. Target weekend travelers or specific events. Offer slightly more flexible terms than peak season.
- Regularly analyze your own performance against these Obzor seasonality benchmarks and adjust your pricing and availability strategy accordingly.
Best Areas for Airbnb Investment in Obzor (2026)
Exploring the top neighborhoods for short-term rentals in Obzor? This section highlights key areas, outlining why they are attractive for hosts and guests, along with notable local attractions. Consider these locations based on your target guest profile and investment strategy.
| Neighborhood / Area | Why Host Here? (Target Guests & Appeal) | Key Attractions & Landmarks |
|---|---|---|
| Central Obzor | Close to the main beach and restaurants, Central Obzor offers easy access to amenities and attractions. It attracts families and tourists looking for convenience and fun. | Obzor Beach, Local restaurants, Market Square, Historical site of the old fortress, Water sports activities |
| Obzor South Beach | This area is known for its spacious sandy beaches and beautiful sea views. Ideal for those seeking a relaxing beach vacation. | South Beach area, Seaside promenade, Beach bars, Sunbeds and umbrellas, Watersports |
| Obzor North Beach | Less crowded than other beaches, North Beach offers a more tranquil experience. Great for families and those looking to unwind. | Quiet beachfront, Natural scenery, Fishing spots, Coastal walking paths, Small cafes |
| St. John the Baptist Church | Historic church that adds cultural value to the area. It attracts visitors interested in history and architecture. | Church architecture, Cultural tours, Local festivals, Artisan shops, Historical documentaries |
| Variety Sports Complex | A local sports complex that attracts those looking for recreational activities, making it popular among active tourists and sports groups. | Football fields, Tennis courts, Basketball courts, Gym facilities, Local tournaments |
| Obzor Nature Park | A beautiful natural area that attracts ecotourists and nature lovers. Perfect for hiking and exploring the local biodiversity. | Hiking trails, Bird watching, Flora and fauna, Picnic spots, Guided nature tours |
| Local Wineries | Obzor is near several vineyards and wineries, making it attractive for wine enthusiasts and tourists looking for unique experiences. | Wine tasting tours, Vineyard tours, Local wine shops, Gastronomic experiences, Culinary workshops |
| Nightlife District | The area with vibrant nightlife, popular among younger tourists and locals looking for entertainment and socializing. | Bars and clubs, Live music venues, Beach parties, Themed nights, Outdoor events |
Understanding Airbnb License Requirements & STR Laws in Obzor (2026)
While Obzor, Burgas, Bulgaria currently shows low STR regulations, specific Airbnb license requirements might still exist or change. Always verify the latest short term rental regulations and Airbnb license requirements directly with local government authorities for Obzor to ensure full compliance before hosting.
(Source: AirROI data, 2026, finding no licensed listings among those analyzed)
Top Performing Airbnb Properties in Obzor (2026)
Benchmark your potential! Explore examples of top-performing Airbnb properties in Obzorbased on Trailing Twelve Month (TTM) revenue. Analyze their characteristics, revenue, occupancy rate, and ADR to understand what drives success in this market.

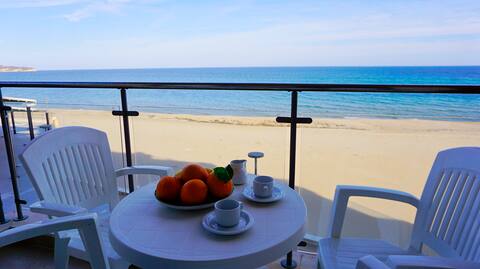
Apartment Beach View Obzor on the beach
Entire Place • 2 bedrooms
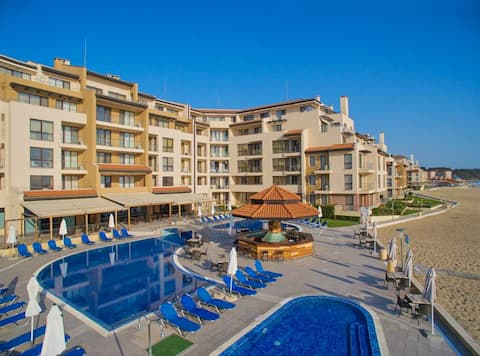
Beachfront Apartment in Obzor Beach Resort
Entire Place • 2 bedrooms
Apartment Obzor Beach Resort directly on the beach
Entire Place • 2 bedrooms
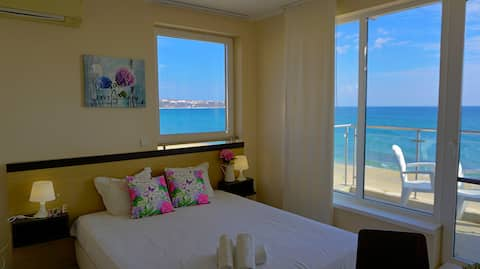
Seafront Apartment in Obzor Beach Resort
Entire Place • 2 bedrooms
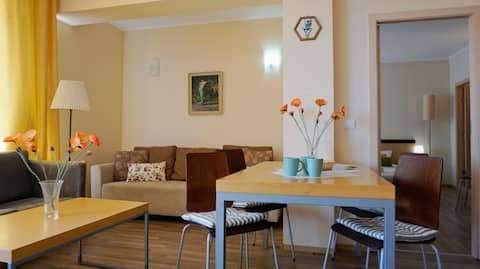
Apartment with a large terrace on the beach in Obzor
Entire Place • 2 bedrooms

Sea view Penthouse (YooBulgaria)
Entire Place • 2 bedrooms
Note: Performance varies based on location, size, amenities, seasonality, and management quality. Data reflects the past 12 months.
Top Performing Airbnb Hosts in Obzor (2026)
Learn from the best! This table showcases top-performing Airbnb hosts in Obzor based on the number of properties managed and estimated total revenue over the past year. Analyze their scale and performance metrics.
| Host Name | Properties | Grossing Revenue | Stay Reviews | Avg Rating |
|---|---|---|---|---|
| Maya | 16 | $99,374 | 44 | 4.84/5.0 |
| Edda | 2 | $13,612 | 26 | 4.88/5.0 |
| Yanka | 2 | $6,998 | 8 | 5.00/5.0 |
| Brian | 1 | $6,169 | 32 | 4.91/5.0 |
| Нина | 1 | $5,652 | 4 | 5.00/5.0 |
| Adelina | 1 | $5,220 | 2 | Not Rated |
| Øystein | 2 | $4,612 | 41 | 4.54/5.0 |
| Rumen | 2 | $4,488 | 32 | 4.54/5.0 |
| Aleksandar | 1 | $4,153 | 7 | 4.86/5.0 |
| Narek | 1 | $3,977 | 3 | 5.00/5.0 |
Analyzing the strategies of top hosts, such as their property selection, pricing, and guest communication, can offer valuable lessons for optimizing your own Airbnb operations in Obzor.
Dive Deeper: Advanced Obzor STR Market Data (2026)
Ready to unlock more insights? AirROI provides access to advanced metrics and comprehensive Airbnb data for Obzor. Explore detailed analytics beyond this report to refine your investment strategy, optimize pricing, and maximize your vacation rental profits.
Explore Advanced MetricsObzor Short-Term Rental Market Composition (2026): Property & Room Types
Room Type Distribution
Property Type Distribution
Market Composition Insights for Obzor
- The Obzor Airbnb market composition is heavily skewed towards Entire Home/Apt listings, which make up 88.9% of the 45 active rentals. This indicates strong guest preference for privacy and space.
- Looking at the property type distribution in Obzor, Apartment/Condo properties are the most common (80%), reflecting the local real estate landscape.
- The presence of 13.3% Hotel/Boutique listings indicates integration with traditional hospitality.
Obzor Airbnb Room Capacity Analysis (2026): Bedroom Distribution
Distribution of Listings by Number of Bedrooms
Room Capacity Insights for Obzor
- The dominant room capacity in Obzor is 1 bedroom listings, making up 73.3% of the market. This suggests a strong demand for properties suitable for couples or solo travelers.
- Together, 1 bedroom and 2 bedrooms properties represent 95.5% of the active Airbnb listings in Obzor, indicating a high concentration in these sizes.
- With over half the market (73.3%) consisting of studios or 1-bedroom units, Obzor is particularly well-suited for individuals or couples.
- Listings with 3+ bedrooms (2.2%) represent a smaller niche, potentially indicating an underserved market for larger group accommodations in Obzor.
Obzor Vacation Rental Guest Capacity Trends (2026)
Distribution of Listings by Guest Capacity
Guest Capacity Insights for Obzor
- The most common guest capacity trend in Obzor vacation rentals is listings accommodating 4 guests (42.2%). This suggests the primary traveler segment is likely small families or groups.
- Properties designed for 4 guests and 5 guests dominate the Obzor STR market, accounting for 55.5% of listings.
- 22.2% of properties accommodate 6+ guests, serving the market segment for larger families or group travel in Obzor.
- On average, properties in Obzor are equipped to host 4.4 guests.
Obzor Airbnb Booking Patterns (2026): Available vs. Booked Days
Available Days Distribution
Booked Days Distribution
Booking Pattern Insights for Obzor
- The most common availability pattern in Obzor falls within the 271-366 days range, representing 95.6% of listings. This suggests many properties have significant open periods on their calendars.
- Approximately 100.0% of listings show high availability (181+ days open annually), indicating potential for increased bookings or specific owner usage patterns.
- For booked days, the 31-90 days range is most frequent in Obzor (48.9%), reflecting common guest stay durations or potential owner blocking patterns.
Obzor Airbnb Minimum Stay Requirements Analysis
Distribution of Listings by Minimum Night Requirement
1 Night
8 listings
17.8% of total
2 Nights
21 listings
46.7% of total
3 Nights
5 listings
11.1% of total
4-6 Nights
5 listings
11.1% of total
30+ Nights
6 listings
13.3% of total
Key Insights
- The most prevalent minimum stay requirement in Obzor is 2 Nights, adopted by 46.7% of listings. This highlights the market's preference for shorter, flexible bookings.
- A strong majority (64.5%) of the Obzor Airbnb data shows acceptance of very short stays (1-2 nights), indicating a dynamic, high-turnover market.
- A significant segment (13.3%) caters to monthly stays (30+ nights) in Obzor, pointing to opportunities in the extended-stay market.
Recommendations
- Align with the market by considering a 2 Nights minimum stay, as 46.7% of Obzor hosts use this setting.
- If feasible, allowing 1-night stays, especially midweek or during low season, could capture last-minute bookings, as only 17.8% currently do.
- A 2-night minimum appears standard (46.7%). Consider this for weekends or peak periods.
- Explore offering discounts for stays of 30+ nights to attract the 13.3% of the market seeking extended stays.
- Adjust minimum nights based on seasonality – potentially shorter during low season and longer during peak demand periods in Obzor.
Obzor Airbnb Cancellation Policy Trends Analysis (2026)
Limited
1 listings
2.3% of total
Flexible
8 listings
18.2% of total
Moderate
10 listings
22.7% of total
Firm
11 listings
25% of total
Strict
14 listings
31.8% of total
Cancellation Policy Insights for Obzor
- The prevailing Airbnb cancellation policy trend in Obzor is Strict, used by 31.8% of listings.
- A majority (56.8%) of hosts in Obzor utilize Firm or Strict policies, indicating a market where hosts prioritize booking security.
Recommendations for Hosts
- Consider adopting a Strict policy to align with the 31.8% market standard in Obzor.
- With 31.8% using Strict terms, this is a viable option in Obzor, particularly for high-value properties or during peak demand periods.
- Regularly review your cancellation policy against competitors and market demand shifts in Obzor.
Obzor STR Booking Lead Time Analysis (2026)
Average Booking Lead Time by Month
Booking Lead Time Insights for Obzor
- The overall average booking lead time for vacation rentals in Obzor is 59 days.
- Guests book furthest in advance for stays during August (average 83 days), likely coinciding with peak travel demand or local events.
- The shortest booking windows occur for stays in November (average 1 days), indicating more last-minute travel plans during this time.
- Seasonally, Summer (76 days avg.) sees the longest lead times, while Winter (16 days avg.) has the shortest, reflecting typical travel planning cycles.
Recommendations for Hosts
- Use the overall average lead time (59 days) as a baseline for your pricing and availability strategy in Obzor.
- For August stays, consider implementing length-of-stay discounts or slightly higher rates for bookings made less than 83 days out to capitalize on advance planning.
- During November, focus on last-minute booking availability and promotions, as guests book with very short notice (1 days avg.).
- Target marketing efforts for the Summer season well in advance (at least 76 days) to capture early planners.
- Monitor your own booking lead times against these Obzor averages to identify opportunities for dynamic pricing adjustments.
Popular & Essential Airbnb Amenities in Obzor (2026)
Amenity Prevalence
Amenity Insights for Obzor
- Essential amenities in Obzor that guests expect include: Wifi, Air conditioning, TV. Lacking these (any) could significantly impact bookings.
- Popular amenities like Kitchen, Dishes and silverware, Patio or balcony are common but not universal. Offering these can provide a competitive edge.
Recommendations for Hosts
- Ensure your listing includes all essential amenities for Obzor: Wifi, Air conditioning, TV.
- Prioritize adding missing essentials: TV.
- Consider adding popular differentiators like Kitchen or Dishes and silverware to increase appeal.
- Highlight unique or less common amenities you offer (e.g., hot tub, dedicated workspace, EV charger) in your listing description and photos.
- Regularly check competitor amenities in Obzor to stay competitive.
Obzor Airbnb Guest Demographics & Profile Analysis (2026)
Guest Profile Summary for Obzor
- The typical guest profile for Airbnb in Obzor consists of predominantly international visitors (76%), with top international origins including Romania, typically belonging to the Post-2000s (Gen Z/Alpha) group (50%), primarily speaking English or Russian.
- Domestic travelers account for 24.0% of guests.
- Key international markets include Bulgaria (24%) and Romania (16%).
- Top languages spoken are English (31.3%) followed by Russian (15.6%).
- A significant demographic segment is the Post-2000s (Gen Z/Alpha) group, representing 50% of guests.
Recommendations for Hosts
- Focus marketing internationally, particularly towards travelers from Romania.
- Tailor amenities and listing descriptions to appeal to the dominant Post-2000s (Gen Z/Alpha) demographic (e.g., highlight fast WiFi, smart home features, local guides).
- Highlight unique local experiences or amenities relevant to the primary guest profile.
- Consider seasonal promotions aligned with peak travel times for key origin markets.
Nearby Short-Term Rental Market Comparison
How does the Obzor Airbnb market stack up against its neighbors? Compare key performance metrics like average monthly revenue, ADR, and occupancy rates in surrounding areas to understand the broader regional STR landscape.
| Market | Active Properties | Monthly Revenue | Daily Rate | Avg. Occupancy |
|---|---|---|---|---|
| Rogachevo | 12 | $1,464 | $213.81 | 30% |
| Silivri | 13 | $1,351 | $287.24 | 27% |
| Büyükçekmece | 44 | $1,223 | $157.86 | 33% |
| Güngören | 11 | $890 | $60.22 | 58% |
| Beyoğlu | 4,405 | $871 | $115.44 | 38% |
| Fatih | 1,861 | $838 | $91.05 | 38% |
| Gaziosmanpaşa | 15 | $830 | $83.35 | 33% |
| Bozhurets | 13 | $751 | $160.05 | 36% |
| Obrochishte | 26 | $716 | $188.57 | 28% |
| Balchik | 130 | $709 | $164.80 | 27% |