Velingrad Airbnb Market Analysis 2026: Short Term Rental Data & Vacation Rental Statistics in Pazardzhik, Bulgaria
Is Airbnb profitable in Velingrad in 2026? Explore comprehensive Airbnb analytics for Velingrad, Pazardzhik, Bulgaria to uncover income potential. This 2026 STR market report for Velingrad, based on AirROI data from February 2025 to January 2026, reveals key trends in the niche market of 53 active listings.
Whether you're considering an Airbnb investment in Velingrad, optimizing your existing vacation rental, or exploring rental arbitrage opportunities, understanding the Velingrad Airbnb data is crucial. Leveraging the low regulation environment is key to maximizing your short term rental income potential. Let's dive into the specifics.
Key Velingrad Airbnb Performance Metrics Overview
Monthly Airbnb Revenue Variations & Income Potential in Velingrad (2026)
Understanding the monthly revenue variations for Airbnb listings in Velingrad is key to maximizing your short term rental income potential. Seasonality significantly impacts earnings. Our analysis, based on data from the past 12 months, shows that the peak revenue month for STRs in Velingrad is typically August, while January often presents the lowest earnings, highlighting opportunities for strategic pricing adjustments during shoulder and low seasons. Explore the typical Airbnb income in Velingrad across different performance tiers:
- Best-in-class properties (Top 10%) achieve $1,276+ monthly, often utilizing dynamic pricing and superior guest experiences.
- Strong performing properties (Top 25%) earn $837 or more, indicating effective management and desirable locations/amenities.
- Typical properties (Median) generate around $475 per month, representing the average market performance.
- Entry-level properties (Bottom 25%) see earnings around $244, often with potential for optimization.
Average Monthly Airbnb Earnings Trend in Velingrad
Velingrad Airbnb Occupancy Rate Trends (2026)
Maximize your bookings by understanding the Velingrad STR occupancy trends. Seasonal demand shifts significantly influence how often properties are booked. Typically, Augustsees the highest demand (peak season occupancy), while January experiences the lowest (low season). Effective strategies, like adjusting minimum stays or offering promotions, can boost occupancy during slower periods. Here's how different property tiers perform in Velingrad:
- Best-in-class properties (Top 10%) achieve 44%+ occupancy, indicating high desirability and potentially optimized availability.
- Strong performing properties (Top 25%) maintain 31% or higher occupancy, suggesting good market fit and guest satisfaction.
- Typical properties (Median) have an occupancy rate around 19%.
- Entry-level properties (Bottom 25%) average 10% occupancy, potentially facing higher vacancy.
Average Monthly Occupancy Rate Trend in Velingrad
Average Daily Rate (ADR) Airbnb Trends in Velingrad (2026)
Effective short term rental pricing strategy in Velingrad involves understanding monthly ADR fluctuations. The Average Daily Rate (ADR) for Airbnb in Velingrad typically peaks in January and dips lowest during April. Leveraging Airbnb dynamic pricing tools or strategies based on this seasonality can significantly boost revenue. Here's a look at the typical nightly rates achieved:
- Best-in-class properties (Top 10%) command rates of $138+ per night, often due to premium features or locations.
- Strong performing properties (Top 25%) achieve nightly rates of $95 or more.
- Typical properties (Median) charge around $71 per night.
- Entry-level properties (Bottom 25%) earn around $55 per night.
Average Daily Rate (ADR) Trend by Month in Velingrad
Get Live Velingrad Market Intelligence 👇

Explore Real-time Analytics
Airbnb Seasonality Analysis & Trends in Velingrad (2026)
Peak Season (August, February, July)
- Revenue averages $839 per month
- Occupancy rates average 28.5%
- Daily rates average $87
Shoulder Season
- Revenue averages $635 per month
- Occupancy maintains around 22.8%
- Daily rates hold near $89
Low Season (January, June, October)
- Revenue drops to average $500 per month
- Occupancy decreases to average 16.4%
- Daily rates adjust to average $91
Seasonality Insights for Velingrad
- The Airbnb seasonality in Velingrad shows highly seasonal trends requiring careful strategy. While the sections above show seasonal averages, it's also insightful to look at the extremes:
- During the high season, the absolute peak month showcases Velingrad's highest earning potential, with monthly revenues capable of climbing to $1,042, occupancy reaching a high of 31.3%, and ADRs peaking at $94.
- Conversely, the slowest single month of the year, typically falling within the low season, marks the market's lowest point. In this month, revenue might dip to $390, occupancy could drop to 13.4%, and ADRs may adjust down to $85.
- Understanding both the seasonal averages and these monthly peaks and troughs in revenue, occupancy, and ADR is crucial for maximizing your Airbnb profit potential in Velingrad.
Seasonal Strategies for Maximizing Profit
- Peak Season: Maximize revenue through premium pricing and potentially longer minimum stays. Ensure high availability.
- Low Season: Offer competitive pricing, special promotions (e.g., extended stay discounts), and flexible cancellation policies. Target off-season travelers like remote workers or budget-conscious guests.
- Shoulder Seasons: Implement dynamic pricing that balances peak and low rates. Target weekend travelers or specific events. Offer slightly more flexible terms than peak season.
- Regularly analyze your own performance against these Velingrad seasonality benchmarks and adjust your pricing and availability strategy accordingly.
Best Areas for Airbnb Investment in Velingrad (2026)
Exploring the top neighborhoods for short-term rentals in Velingrad? This section highlights key areas, outlining why they are attractive for hosts and guests, along with notable local attractions. Consider these locations based on your target guest profile and investment strategy.
| Neighborhood / Area | Why Host Here? (Target Guests & Appeal) | Key Attractions & Landmarks |
|---|---|---|
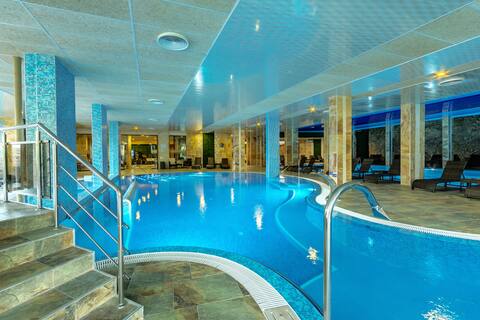
| Center Velingrad | The heart of Velingrad, ideal for tourists seeking relaxation in the numerous spa hotels and wellness centers. Close to restaurants and cafes, offering a vibrant atmosphere. | Velingrad Mineral Baths, Historical Museum of Velingrad, Church of St. Alexander Nevski, Park Kleptuza, Velingrad Spa Festival |
| Kleptuza | Known for its natural beauty, the Kleptuza Lake is a serene spot for tourists to unwind. This area is popular for its tranquil environment and proximity to nature walks and treatments. | Kleptuza Lake, Walking trails around the lake, Natural mineral water springs |
| Chepino Valley | A picturesque valley known for its mineral springs, attracting those seeking both relaxation and adventure activities like hiking and mountain biking. | Chepino River, Hiking trails, Thermal pools |
| Lajčevtsi | An emerging neighborhood, perfect for those looking for a peaceful escape while still being close to the town's amenities. Popular among families and nature lovers. | Nearby hiking trails, Local eateries, Quiet parks |
| Piren National Park | A fantastic location for tourists wishing to explore nature, with extensive hiking trails and scenic views. Ideal for eco-tourism and outdoor adventures. | Pirin Peaks, Wildlife watching, Hiking routes |
| Rila Monastery | A bit further out but a key destination for its UNESCO World Heritage site status. Attracts many tourists, making it a good area for seasonal Airbnb hosting. | Rila Monastery, Surrounding nature trails, Cultural heritage sites |
| Sarnitsa | Located by the water, this area is gaining popularity among travelers looking for picturesque views and recreation such as fishing and boating. Great for summer stays. | Sarnitsa Lake, Fishing spots, Boating activities |
| Batak | A historic town near Velingrad, known for its fascinating history and beautiful nature. It attracts visitors interested in both culture and outdoor activities. | Batak Reservoir, Historical museum, Hiking to local villages |
Understanding Airbnb License Requirements & STR Laws in Velingrad (2026)
While Velingrad, Pazardzhik, Bulgaria currently shows low STR regulations, specific Airbnb license requirements might still exist or change. Always verify the latest short term rental regulations and Airbnb license requirements directly with local government authorities for Velingrad to ensure full compliance before hosting.
(Source: AirROI data, 2026, finding no licensed listings among those analyzed)
Top Performing Airbnb Properties in Velingrad (2026)
Benchmark your potential! Explore examples of top-performing Airbnb properties in Velingradbased on Trailing Twelve Month (TTM) revenue. Analyze their characteristics, revenue, occupancy rate, and ADR to understand what drives success in this market.

Cheerful guest house Anna-Maria with hot tub !
Entire Place • 4 bedrooms

Villa Dea & SPA Park in Velingrad
Entire Place • 2 bedrooms
Villa Ina & SPA Park in Velingrad
Entire Place • 2 bedrooms

Nikol 3 SPA CLUB BOR
Entire Place • 2 bedrooms
Nikol Deluxe
Entire Place • 1 bedroom
The Owl's Nest 2
Entire Place • 1 bedroom
Note: Performance varies based on location, size, amenities, seasonality, and management quality. Data reflects the past 12 months.
Top Performing Airbnb Hosts in Velingrad (2026)
Learn from the best! This table showcases top-performing Airbnb hosts in Velingrad based on the number of properties managed and estimated total revenue over the past year. Analyze their scale and performance metrics.
| Host Name | Properties | Grossing Revenue | Stay Reviews | Avg Rating |
|---|---|---|---|---|
| Stoycho | 5 | $37,848 | 74 | 4.95/5.0 |
| Irina | 8 | $33,486 | 50 | 4.96/5.0 |
| Petar | 1 | $29,850 | 18 | 4.83/5.0 |
| Kamen | 2 | $26,757 | 6 | 4.75/5.0 |
| Andrey | 3 | $11,136 | 10 | 5.00/5.0 |
| Stoyan | 2 | $9,584 | 113 | 4.87/5.0 |
| Nikola | 2 | $9,293 | 11 | 4.80/5.0 |
| Prestige-Ro LTD | 2 | $6,315 | 10 | 5.00/5.0 |
| Валдим-22 | 1 | $5,603 | 7 | 5.00/5.0 |
| Марияна | 1 | $5,141 | 3 | 5.00/5.0 |
Analyzing the strategies of top hosts, such as their property selection, pricing, and guest communication, can offer valuable lessons for optimizing your own Airbnb operations in Velingrad.
Dive Deeper: Advanced Velingrad STR Market Data (2026)
Ready to unlock more insights? AirROI provides access to advanced metrics and comprehensive Airbnb data for Velingrad. Explore detailed analytics beyond this report to refine your investment strategy, optimize pricing, and maximize your vacation rental profits.
Explore Advanced MetricsVelingrad Short-Term Rental Market Composition (2026): Property & Room Types
Room Type Distribution
Property Type Distribution
Market Composition Insights for Velingrad
- The Velingrad Airbnb market composition is heavily skewed towards Entire Home/Apt listings, which make up 96.2% of the 53 active rentals. This indicates strong guest preference for privacy and space.
- Looking at the property type distribution in Velingrad, Apartment/Condo properties are the most common (88.7%), reflecting the local real estate landscape.
- Smaller segments like hotel/boutique (combined 1.9%) offer potential for unique stay experiences.
Velingrad Airbnb Room Capacity Analysis (2026): Bedroom Distribution
Distribution of Listings by Number of Bedrooms
Room Capacity Insights for Velingrad
- The dominant room capacity in Velingrad is 1 bedroom listings, making up 58.5% of the market. This suggests a strong demand for properties suitable for couples or solo travelers.
- Together, 1 bedroom and 2 bedrooms properties represent 90.6% of the active Airbnb listings in Velingrad, indicating a high concentration in these sizes.
- With over half the market (58.5%) consisting of studios or 1-bedroom units, Velingrad is particularly well-suited for individuals or couples.
- Listings with 3+ bedrooms (5.7%) represent a smaller niche, potentially indicating an underserved market for larger group accommodations in Velingrad.
Velingrad Vacation Rental Guest Capacity Trends (2026)
Distribution of Listings by Guest Capacity
Guest Capacity Insights for Velingrad
- The most common guest capacity trend in Velingrad vacation rentals is listings accommodating 4 guests (45.3%). This suggests the primary traveler segment is likely small families or groups.
- Properties designed for 4 guests and 3 guests dominate the Velingrad STR market, accounting for 60.4% of listings.
- 15.1% of properties accommodate 6+ guests, serving the market segment for larger families or group travel in Velingrad.
- On average, properties in Velingrad are equipped to host 3.9 guests.
Velingrad Airbnb Booking Patterns (2026): Available vs. Booked Days
Available Days Distribution
Booked Days Distribution
Booking Pattern Insights for Velingrad
- The most common availability pattern in Velingrad falls within the 271-366 days range, representing 90.6% of listings. This suggests many properties have significant open periods on their calendars.
- Approximately 100.0% of listings show high availability (181+ days open annually), indicating potential for increased bookings or specific owner usage patterns.
- For booked days, the 31-90 days range is most frequent in Velingrad (45.3%), reflecting common guest stay durations or potential owner blocking patterns.
Velingrad Airbnb Minimum Stay Requirements Analysis
Distribution of Listings by Minimum Night Requirement
1 Night
25 listings
47.2% of total
2 Nights
22 listings
41.5% of total
3 Nights
1 listings
1.9% of total
30+ Nights
5 listings
9.4% of total
Key Insights
- The most prevalent minimum stay requirement in Velingrad is 1 Night, adopted by 47.2% of listings. This highlights the market's preference for shorter, flexible bookings.
- A strong majority (88.7%) of the Velingrad Airbnb data shows acceptance of very short stays (1-2 nights), indicating a dynamic, high-turnover market.
Recommendations
- Align with the market by considering a 1 Night minimum stay, as 47.2% of Velingrad hosts use this setting.
- Explore offering discounts for stays of 30+ nights to attract the 9.4% of the market seeking extended stays.
- Adjust minimum nights based on seasonality – potentially shorter during low season and longer during peak demand periods in Velingrad.
Velingrad Airbnb Cancellation Policy Trends Analysis (2026)
Flexible
26 listings
49.1% of total
Moderate
16 listings
30.2% of total
Firm
9 listings
17% of total
Strict
2 listings
3.8% of total
Cancellation Policy Insights for Velingrad
- The prevailing Airbnb cancellation policy trend in Velingrad is Flexible, used by 49.1% of listings.
- The market strongly favors guest-friendly terms, with 79.3% of listings offering Flexible or Moderate policies. This suggests guests in Velingrad may expect booking flexibility.
- Strict cancellation policies are quite rare (3.8%), potentially making listings with this policy less competitive unless justified by high demand or property type.
Recommendations for Hosts
- Consider adopting a Flexible policy to align with the 49.1% market standard in Velingrad.
- Using a Strict policy might deter some guests, as only 3.8% of listings use it. Evaluate if potential revenue protection outweighs possible lower booking rates.
- Regularly review your cancellation policy against competitors and market demand shifts in Velingrad.
Velingrad STR Booking Lead Time Analysis (2026)
Average Booking Lead Time by Month
Booking Lead Time Insights for Velingrad
- The overall average booking lead time for vacation rentals in Velingrad is 34 days.
- Guests book furthest in advance for stays during April (average 49 days), likely coinciding with peak travel demand or local events.
- The shortest booking windows occur for stays in February (average 21 days), indicating more last-minute travel plans during this time.
- Seasonally, Spring (40 days avg.) sees the longest lead times, while Fall (33 days avg.) has the shortest, reflecting typical travel planning cycles.
Recommendations for Hosts
- Use the overall average lead time (34 days) as a baseline for your pricing and availability strategy in Velingrad.
- For April stays, consider implementing length-of-stay discounts or slightly higher rates for bookings made less than 49 days out to capitalize on advance planning.
- Target marketing efforts for the Spring season well in advance (at least 40 days) to capture early planners.
- Monitor your own booking lead times against these Velingrad averages to identify opportunities for dynamic pricing adjustments.
Popular & Essential Airbnb Amenities in Velingrad (2026)
Amenity Prevalence
Amenity Insights for Velingrad
- Essential amenities in Velingrad that guests expect include: Wifi, TV, Kitchen. Lacking these (any) could significantly impact bookings.
- Popular amenities like Free parking on premises, Air conditioning, Heating are common but not universal. Offering these can provide a competitive edge.
Recommendations for Hosts
- Ensure your listing includes all essential amenities for Velingrad: Wifi, TV, Kitchen.
- Prioritize adding missing essentials: Kitchen.
- Consider adding popular differentiators like Free parking on premises or Air conditioning to increase appeal.
- Highlight unique or less common amenities you offer (e.g., hot tub, dedicated workspace, EV charger) in your listing description and photos.
- Regularly check competitor amenities in Velingrad to stay competitive.
Velingrad Airbnb Guest Demographics & Profile Analysis (2026)
Guest Profile Summary for Velingrad
- The typical guest profile for Airbnb in Velingrad consists of a mix of domestic (56%) and international guests, often arriving from nearby Sofia, typically belonging to the Post-2000s (Gen Z/Alpha) group (50%), primarily speaking English or Bulgarian.
- Domestic travelers account for 56.1% of guests.
- Key international markets include Bulgaria (56.1%) and United States (7.3%).
- Top languages spoken are English (43.4%) followed by Bulgarian (17%).
- A significant demographic segment is the Post-2000s (Gen Z/Alpha) group, representing 50% of guests.
Recommendations for Hosts
- Balance marketing efforts between domestic and international channels based on the guest mix.
- Tailor amenities and listing descriptions to appeal to the dominant Post-2000s (Gen Z/Alpha) demographic (e.g., highlight fast WiFi, smart home features, local guides).
- Highlight unique local experiences or amenities relevant to the primary guest profile.
- Consider seasonal promotions aligned with peak travel times for key origin markets.
Nearby Short-Term Rental Market Comparison
How does the Velingrad Airbnb market stack up against its neighbors? Compare key performance metrics like average monthly revenue, ADR, and occupancy rates in surrounding areas to understand the broader regional STR landscape.
| Market | Active Properties | Monthly Revenue | Daily Rate | Avg. Occupancy |
|---|---|---|---|---|
| Apriltsi | 13 | $1,698 | $296.05 | 31% |
| Pancharevo | 10 | $1,582 | $242.67 | 17% |
| Govedartsi | 13 | $1,089 | $300.29 | 23% |
| Sredec | 201 | $1,061 | $91.64 | 46% |
| Triadica | 228 | $976 | $89.66 | 46% |
| Oborishte | 144 | $847 | $74.79 | 46% |
| Krasno selo | 54 | $762 | $65.54 | 45% |
| Razlog | 88 | $753 | $181.92 | 27% |
| Vazrajdane | 172 | $718 | $72.10 | 41% |
| Sofia | 1,601 | $713 | $68.93 | 43% |