Cardston County Airbnb Market Analysis 2026: Short Term Rental Data & Vacation Rental Statistics in Alberta, Canada
Is Airbnb profitable in Cardston County in 2026? Explore comprehensive Airbnb analytics for Cardston County, Alberta, Canada to uncover income potential. This 2026 STR market report for Cardston County, based on AirROI data from February 2025 to January 2026, reveals key trends in the niche market of 20 active listings.
Whether you're considering an Airbnb investment in Cardston County, optimizing your existing vacation rental, or exploring rental arbitrage opportunities, understanding the Cardston County Airbnb data is crucial. Leveraging the low regulation environment is key to maximizing your short term rental income potential. Let's dive into the specifics.
Key Cardston County Airbnb Performance Metrics Overview
Monthly Airbnb Revenue Variations & Income Potential in Cardston County (2026)
Understanding the monthly revenue variations for Airbnb listings in Cardston County is key to maximizing your short term rental income potential. Seasonality significantly impacts earnings. Our analysis, based on data from the past 12 months, shows that the peak revenue month for STRs in Cardston County is typically July, while February often presents the lowest earnings, highlighting opportunities for strategic pricing adjustments during shoulder and low seasons. Explore the typical Airbnb income in Cardston County across different performance tiers:
- Best-in-class properties (Top 10%) achieve $6,049+ monthly, often utilizing dynamic pricing and superior guest experiences.
- Strong performing properties (Top 25%) earn $4,019 or more, indicating effective management and desirable locations/amenities.
- Typical properties (Median) generate around $2,086 per month, representing the average market performance.
- Entry-level properties (Bottom 25%) see earnings around $870, often with potential for optimization.
Average Monthly Airbnb Earnings Trend in Cardston County
Cardston County Airbnb Occupancy Rate Trends (2026)
Maximize your bookings by understanding the Cardston County STR occupancy trends. Seasonal demand shifts significantly influence how often properties are booked. Typically, Augustsees the highest demand (peak season occupancy), while February experiences the lowest (low season). Effective strategies, like adjusting minimum stays or offering promotions, can boost occupancy during slower periods. Here's how different property tiers perform in Cardston County:
- Best-in-class properties (Top 10%) achieve 47%+ occupancy, indicating high desirability and potentially optimized availability.
- Strong performing properties (Top 25%) maintain 37% or higher occupancy, suggesting good market fit and guest satisfaction.
- Typical properties (Median) have an occupancy rate around 26%.
- Entry-level properties (Bottom 25%) average 16% occupancy, potentially facing higher vacancy.
Average Monthly Occupancy Rate Trend in Cardston County
Average Daily Rate (ADR) Airbnb Trends in Cardston County (2026)
Effective short term rental pricing strategy in Cardston County involves understanding monthly ADR fluctuations. The Average Daily Rate (ADR) for Airbnb in Cardston County typically peaks in September and dips lowest during February. Leveraging Airbnb dynamic pricing tools or strategies based on this seasonality can significantly boost revenue. Here's a look at the typical nightly rates achieved:
- Best-in-class properties (Top 10%) command rates of $415+ per night, often due to premium features or locations.
- Strong performing properties (Top 25%) achieve nightly rates of $295 or more.
- Typical properties (Median) charge around $188 per night.
- Entry-level properties (Bottom 25%) earn around $150 per night.
Average Daily Rate (ADR) Trend by Month in Cardston County
Get Live Cardston County Market Intelligence 👇
Explore Real-time Analytics
Airbnb Seasonality Analysis & Trends in Cardston County (2026)
Peak Season (July, August, June)
- Revenue averages $5,515 per month
- Occupancy rates average 57.1%
- Daily rates average $281
Shoulder Season
- Revenue averages $2,264 per month
- Occupancy maintains around 18.2%
- Daily rates hold near $270
Low Season (February, April, November)
- Revenue drops to average $1,191 per month
- Occupancy decreases to average 19.0%
- Daily rates adjust to average $255
Seasonality Insights for Cardston County
- The Airbnb seasonality in Cardston County shows highly seasonal trends requiring careful strategy. While the sections above show seasonal averages, it's also insightful to look at the extremes:
- During the high season, the absolute peak month showcases Cardston County's highest earning potential, with monthly revenues capable of climbing to $6,312, occupancy reaching a high of 66.4%, and ADRs peaking at $291.
- Conversely, the slowest single month of the year, typically falling within the low season, marks the market's lowest point. In this month, revenue might dip to $1,024, occupancy could drop to 12.8%, and ADRs may adjust down to $243.
- Understanding both the seasonal averages and these monthly peaks and troughs in revenue, occupancy, and ADR is crucial for maximizing your Airbnb profit potential in Cardston County.
Seasonal Strategies for Maximizing Profit
- Peak Season: Maximize revenue through premium pricing and potentially longer minimum stays. Ensure high availability.
- Low Season: Offer competitive pricing, special promotions (e.g., extended stay discounts), and flexible cancellation policies. Target off-season travelers like remote workers or budget-conscious guests.
- Shoulder Seasons: Implement dynamic pricing that balances peak and low rates. Target weekend travelers or specific events. Offer slightly more flexible terms than peak season.
- Regularly analyze your own performance against these Cardston County seasonality benchmarks and adjust your pricing and availability strategy accordingly.
Best Areas for Airbnb Investment in Cardston County (2026)
Exploring the top neighborhoods for short-term rentals in Cardston County? This section highlights key areas, outlining why they are attractive for hosts and guests, along with notable local attractions. Consider these locations based on your target guest profile and investment strategy.
| Neighborhood / Area | Why Host Here? (Target Guests & Appeal) | Key Attractions & Landmarks |
|---|---|---|
| Cardston | The largest town in Cardston County, Cardston is rich in history and offers a variety of cultural experiences. It attracts visitors interested in historical sites and local festivals, making it a great location for Airbnb hosting. | Cardston Alberta Temple, Remington Carriage Museum, Cardston Heritage Centre, Glenwood Park, St. John's Church |
| Glenwood | A small but picturesque hamlet in Cardston County, Glenwood offers a serene rural experience with beautiful landscapes, attracting visitors who want to escape the hustle and bustle of city life. | Glenwood Park, St. Mary River, Nature trails, Local farms and markets |
| Magrath | A vibrant small town known for its agricultural roots and local charm, Magrath is a great spot for Airbnb hosting, especially for those interested in experiencing Alberta's farming culture. | Magrath Historical Museum, Magrath Park, Nature exploration areas, Local farm tours |
| Hill Spring | Hill Spring offers a quaint and peaceful environment with stunning views of the nearby mountains. It's perfect for visitors looking for outdoor activities and tranquility. | Nearby hiking trails, Hill Spring Church, Natural landscapes, Scenic viewpoints |
| Sunnybank | A small rural community that offers access to nature and a peaceful retreat. It's an ideal spot for those looking to relax and enjoy outdoor activities. | Sunnybank Park, Fishing spots, Rural hiking trails |
| Westwater | Known for its scenic landscapes and outdoor recreation opportunities, Westwater attracts visitors who are interested in camping and exploration. | Camping areas, Nature trails, Riverside views, Wildlife watching |
| Brady | A quiet community great for travelers looking for a relaxing stay amidst nature. The rural charm and proximity to larger towns make it attractive for Airbnb hosting. | Brady Park, Fishing areas, Local community events, Access to nature |
| Lundbreck Falls | Not literally within Cardston County but very close, Lundbreck Falls is a top spot for tourists looking for stunning natural beauty and outdoor adventures, making it popular for short-term rentals. | Lundbreck Falls, Camping spots, Hiking and biking trails, Fishing areas |
Understanding Airbnb License Requirements & STR Laws in Cardston County (2026)
While Cardston County, Alberta, Canada currently shows low STR regulations, specific Airbnb license requirements might still exist or change. Always verify the latest short term rental regulations and Airbnb license requirements directly with local government authorities for Cardston County to ensure full compliance before hosting.
(Source: AirROI data, 2026, finding no licensed listings among those analyzed)
Top Performing Airbnb Properties in Cardston County (2026)
Benchmark your potential! Explore examples of top-performing Airbnb properties in Cardston Countybased on Trailing Twelve Month (TTM) revenue. Analyze their characteristics, revenue, occupancy rate, and ADR to understand what drives success in this market.
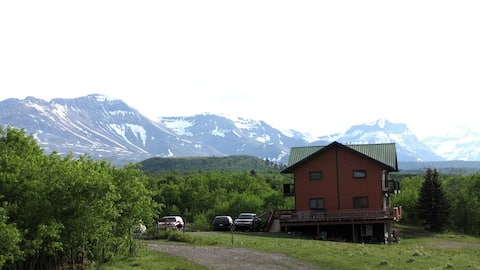
Payne Lake Lodge - 20 minutes from Waterton Park
Entire Place • 8 bedrooms
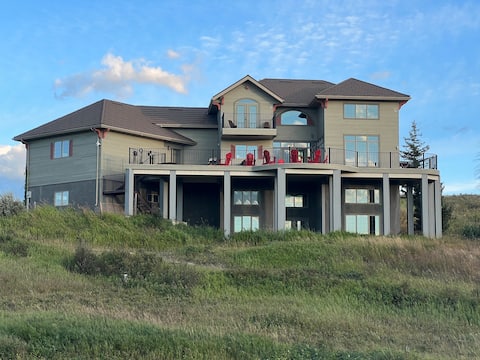
Riverside Acreage at Waterton National Parks
Entire Place • 7 bedrooms
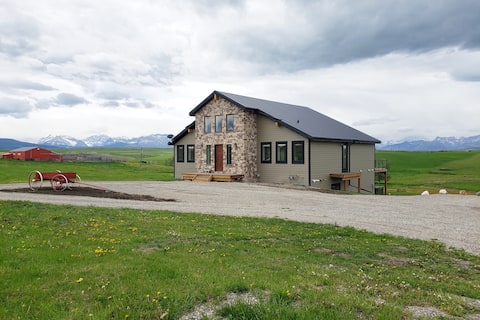
HILLTOP HAVEN, MOUNTAIN VIEWS, 15 MIN TO WATERTON!
Entire Place • 4 bedrooms
Pine View Retreat family home 15 mins to Waterton
Entire Place • 5 bedrooms
Payne Lake Wilderness Huts - Lakeview Suite
Entire Place • 2 bedrooms
Lakeview Lodge
Entire Place • 3 bedrooms
Note: Performance varies based on location, size, amenities, seasonality, and management quality. Data reflects the past 12 months.
Top Performing Airbnb Hosts in Cardston County (2026)
Learn from the best! This table showcases top-performing Airbnb hosts in Cardston County based on the number of properties managed and estimated total revenue over the past year. Analyze their scale and performance metrics.
| Host Name | Properties | Grossing Revenue | Stay Reviews | Avg Rating |
|---|---|---|---|---|
| Cheryl | 1 | $97,923 | 24 | 4.83/5.0 |
| Soonhui | 6 | $78,100 | 112 | 4.75/5.0 |
| Chelsey | 1 | $65,600 | 20 | 4.95/5.0 |
| Grant | 1 | $52,970 | 57 | 5.00/5.0 |
| Mountain - Haven | 2 | $41,426 | 95 | 4.67/5.0 |
| Hali | 1 | $32,773 | 76 | 4.93/5.0 |
| Angela | 1 | $28,953 | 19 | 5.00/5.0 |
| Marie-France | 2 | $24,584 | 38 | 4.86/5.0 |
| Royce | 1 | $20,037 | 68 | 4.71/5.0 |
| Sarah | 1 | $19,002 | 12 | 5.00/5.0 |
Analyzing the strategies of top hosts, such as their property selection, pricing, and guest communication, can offer valuable lessons for optimizing your own Airbnb operations in Cardston County.
Dive Deeper: Advanced Cardston County STR Market Data (2026)
Ready to unlock more insights? AirROI provides access to advanced metrics and comprehensive Airbnb data for Cardston County. Explore detailed analytics beyond this report to refine your investment strategy, optimize pricing, and maximize your vacation rental profits.
Explore Advanced MetricsCardston County Short-Term Rental Market Composition (2026): Property & Room Types
Room Type Distribution
Property Type Distribution
Market Composition Insights for Cardston County
- The Cardston County Airbnb market composition is heavily skewed towards Entire Home/Apt listings, which make up 95% of the 20 active rentals. This indicates strong guest preference for privacy and space.
- Looking at the property type distribution in Cardston County, House properties are the most common (45%), reflecting the local real estate landscape.
- Houses represent a significant 45% portion, catering likely to families or larger groups.
Cardston County Airbnb Room Capacity Analysis (2026): Bedroom Distribution
Distribution of Listings by Number of Bedrooms
Room Capacity Insights for Cardston County
- The dominant room capacity in Cardston County is 2 bedrooms listings, making up 45% of the market. This suggests a strong demand for properties suitable for couples or solo travelers.
- Together, 2 bedrooms and 1 bedroom properties represent 70.0% of the active Airbnb listings in Cardston County, indicating a high concentration in these sizes.
- A significant 30.0% of listings offer 3+ bedrooms, catering to larger groups and families seeking more space in Cardston County.
Cardston County Vacation Rental Guest Capacity Trends (2026)
Distribution of Listings by Guest Capacity
Guest Capacity Insights for Cardston County
- The most common guest capacity trend in Cardston County vacation rentals is listings accommodating 8+ guests (35%). This suggests the primary traveler segment is likely larger groups.
- Properties designed for 8+ guests and 6 guests dominate the Cardston County STR market, accounting for 60.0% of listings.
- 70.0% of properties accommodate 6+ guests, serving the market segment for larger families or group travel in Cardston County.
- On average, properties in Cardston County are equipped to host 6.1 guests.
Cardston County Airbnb Booking Patterns (2026): Available vs. Booked Days
Available Days Distribution
Booked Days Distribution
Booking Pattern Insights for Cardston County
- The most common availability pattern in Cardston County falls within the 271-366 days range, representing 70% of listings. This suggests many properties have significant open periods on their calendars.
- Approximately 100.0% of listings show high availability (181+ days open annually), indicating potential for increased bookings or specific owner usage patterns.
- For booked days, the 31-90 days range is most frequent in Cardston County (55%), reflecting common guest stay durations or potential owner blocking patterns.
Cardston County Airbnb Minimum Stay Requirements Analysis
Distribution of Listings by Minimum Night Requirement
1 Night
3 listings
15% of total
2 Nights
14 listings
70% of total
3 Nights
1 listings
5% of total
30+ Nights
2 listings
10% of total
Key Insights
- The most prevalent minimum stay requirement in Cardston County is 2 Nights, adopted by 70% of listings. This highlights the market's preference for shorter, flexible bookings.
- A strong majority (85.0%) of the Cardston County Airbnb data shows acceptance of very short stays (1-2 nights), indicating a dynamic, high-turnover market.
Recommendations
- Align with the market by considering a 2 Nights minimum stay, as 70% of Cardston County hosts use this setting.
- If feasible, allowing 1-night stays, especially midweek or during low season, could capture last-minute bookings, as only 15% currently do.
- A 2-night minimum appears standard (70%). Consider this for weekends or peak periods.
- Explore offering discounts for stays of 30+ nights to attract the 10% of the market seeking extended stays.
- Adjust minimum nights based on seasonality – potentially shorter during low season and longer during peak demand periods in Cardston County.
Cardston County Airbnb Cancellation Policy Trends Analysis (2026)
Flexible
1 listings
5% of total
Moderate
3 listings
15% of total
Firm
16 listings
80% of total
Cancellation Policy Insights for Cardston County
- The prevailing Airbnb cancellation policy trend in Cardston County is Firm, used by 80% of listings.
- A majority (80.0%) of hosts in Cardston County utilize Firm or Strict policies, indicating a market where hosts prioritize booking security.
Recommendations for Hosts
- Consider adopting a Firm policy to align with the 80% market standard in Cardston County.
- Regularly review your cancellation policy against competitors and market demand shifts in Cardston County.
Cardston County STR Booking Lead Time Analysis (2026)
Average Booking Lead Time by Month
Booking Lead Time Insights for Cardston County
- The overall average booking lead time for vacation rentals in Cardston County is 72 days.
- Guests book furthest in advance for stays during July (average 103 days), likely coinciding with peak travel demand or local events.
- The shortest booking windows occur for stays in November (average 23 days), indicating more last-minute travel plans during this time.
- Seasonally, Summer (93 days avg.) sees the longest lead times, while Winter (45 days avg.) has the shortest, reflecting typical travel planning cycles.
Recommendations for Hosts
- Use the overall average lead time (72 days) as a baseline for your pricing and availability strategy in Cardston County.
- For July stays, consider implementing length-of-stay discounts or slightly higher rates for bookings made less than 103 days out to capitalize on advance planning.
- Target marketing efforts for the Summer season well in advance (at least 93 days) to capture early planners.
- Monitor your own booking lead times against these Cardston County averages to identify opportunities for dynamic pricing adjustments.
Popular & Essential Airbnb Amenities in Cardston County (2026)
Amenity Prevalence
Amenity Insights for Cardston County
- Essential amenities in Cardston County that guests expect include: Free parking on premises, Smoke alarm. Lacking these (any) could significantly impact bookings.
- Popular amenities like Kitchen, Hot water, Dishes and silverware are common but not universal. Offering these can provide a competitive edge.
Recommendations for Hosts
- Ensure your listing includes all essential amenities for Cardston County: Free parking on premises, Smoke alarm.
- Prioritize adding missing essentials: Free parking on premises, Smoke alarm.
- Consider adding popular differentiators like Kitchen or Hot water to increase appeal.
- Highlight unique or less common amenities you offer (e.g., hot tub, dedicated workspace, EV charger) in your listing description and photos.
- Regularly check competitor amenities in Cardston County to stay competitive.
Cardston County Airbnb Guest Demographics & Profile Analysis (2026)
Guest Profile Summary for Cardston County
- The typical guest profile for Airbnb in Cardston County consists of a mix of domestic (56%) and international guests, often arriving from nearby Calgary, typically belonging to the Post-2000s (Gen Z/Alpha) group (50%), primarily speaking English or French.
- Domestic travelers account for 56.4% of guests.
- Key international markets include Canada (56.4%) and United States (35.9%).
- Top languages spoken are English (60.3%) followed by French (11%).
- A significant demographic segment is the Post-2000s (Gen Z/Alpha) group, representing 50% of guests.
Recommendations for Hosts
- Balance marketing efforts between domestic and international channels based on the guest mix.
- Tailor amenities and listing descriptions to appeal to the dominant Post-2000s (Gen Z/Alpha) demographic (e.g., highlight fast WiFi, smart home features, local guides).
- Highlight unique local experiences or amenities relevant to the primary guest profile.
- Consider seasonal promotions aligned with peak travel times for key origin markets.
Nearby Short-Term Rental Market Comparison
How does the Cardston County Airbnb market stack up against its neighbors? Compare key performance metrics like average monthly revenue, ADR, and occupancy rates in surrounding areas to understand the broader regional STR landscape.
| Market | Active Properties | Monthly Revenue | Daily Rate | Avg. Occupancy |
|---|---|---|---|---|
| West Glacier | 90 | $4,297 | $391.29 | 58% |
| Whitefish | 1,037 | $3,994 | $450.24 | 40% |
| Somers | 77 | $3,484 | $405.79 | 46% |
| Lakeside | 141 | $3,201 | $416.76 | 40% |
| Babb | 63 | $3,127 | $282.03 | 60% |
| Columbia Falls | 569 | $3,030 | $317.64 | 50% |
| Martin City | 51 | $3,021 | $256.01 | 56% |
| Bragg Creek | 48 | $2,889 | $204.57 | 54% |
| Kalispell | 537 | $2,806 | $289.46 | 47% |
| Glacier County | 17 | $2,765 | $317.94 | 49% |