Lake Louise Airbnb Market Analysis 2026: Short Term Rental Data & Vacation Rental Statistics in Alberta, Canada
Is Airbnb profitable in Lake Louise in 2026? Explore comprehensive Airbnb analytics for Lake Louise, Alberta, Canada to uncover income potential. This 2026 STR market report for Lake Louise, based on AirROI data from February 2025 to January 2026, reveals key trends in the niche market of 18 active listings.
Whether you're considering an Airbnb investment in Lake Louise, optimizing your existing vacation rental, or exploring rental arbitrage opportunities, understanding the Lake Louise Airbnb data is crucial. Leveraging the low regulation environment is key to maximizing your short term rental income potential. Let's dive into the specifics.
Key Lake Louise Airbnb Performance Metrics Overview
Monthly Airbnb Revenue Variations & Income Potential in Lake Louise (2026)
Understanding the monthly revenue variations for Airbnb listings in Lake Louise is key to maximizing your short term rental income potential. Seasonality significantly impacts earnings. Our analysis, based on data from the past 12 months, shows that the peak revenue month for STRs in Lake Louise is typically July, while November often presents the lowest earnings, highlighting opportunities for strategic pricing adjustments during shoulder and low seasons. Explore the typical Airbnb income in Lake Louise across different performance tiers:
- Best-in-class properties (Top 10%) achieve $10,271+ monthly, often utilizing dynamic pricing and superior guest experiences.
- Strong performing properties (Top 25%) earn $7,607 or more, indicating effective management and desirable locations/amenities.
- Typical properties (Median) generate around $4,798 per month, representing the average market performance.
- Entry-level properties (Bottom 25%) see earnings around $3,319, often with potential for optimization.
Average Monthly Airbnb Earnings Trend in Lake Louise
Lake Louise Airbnb Occupancy Rate Trends (2026)
Maximize your bookings by understanding the Lake Louise STR occupancy trends. Seasonal demand shifts significantly influence how often properties are booked. Typically, Julysees the highest demand (peak season occupancy), while November experiences the lowest (low season). Effective strategies, like adjusting minimum stays or offering promotions, can boost occupancy during slower periods. Here's how different property tiers perform in Lake Louise:
- Best-in-class properties (Top 10%) achieve 58%+ occupancy, indicating high desirability and potentially optimized availability.
- Strong performing properties (Top 25%) maintain 46% or higher occupancy, suggesting good market fit and guest satisfaction.
- Typical properties (Median) have an occupancy rate around 33%.
- Entry-level properties (Bottom 25%) average 24% occupancy, potentially facing higher vacancy.
Average Monthly Occupancy Rate Trend in Lake Louise
Average Daily Rate (ADR) Airbnb Trends in Lake Louise (2026)
Effective short term rental pricing strategy in Lake Louise involves understanding monthly ADR fluctuations. The Average Daily Rate (ADR) for Airbnb in Lake Louise typically peaks in July and dips lowest during April. Leveraging Airbnb dynamic pricing tools or strategies based on this seasonality can significantly boost revenue. Here's a look at the typical nightly rates achieved:
- Best-in-class properties (Top 10%) command rates of $676+ per night, often due to premium features or locations.
- Strong performing properties (Top 25%) achieve nightly rates of $542 or more.
- Typical properties (Median) charge around $421 per night.
- Entry-level properties (Bottom 25%) earn around $356 per night.
Average Daily Rate (ADR) Trend by Month in Lake Louise
Get Live Lake Louise Market Intelligence 👇

Explore Real-time Analytics
Airbnb Seasonality Analysis & Trends in Lake Louise (2026)
Peak Season (July, August, June)
- Revenue averages $10,872 per month
- Occupancy rates average 50.9%
- Daily rates average $652
Shoulder Season
- Revenue averages $4,984 per month
- Occupancy maintains around 35.0%
- Daily rates hold near $418
Low Season (January, April, November)
- Revenue drops to average $2,090 per month
- Occupancy decreases to average 19.9%
- Daily rates adjust to average $328
Seasonality Insights for Lake Louise
- The Airbnb seasonality in Lake Louise shows highly seasonal trends requiring careful strategy. While the sections above show seasonal averages, it's also insightful to look at the extremes:
- During the high season, the absolute peak month showcases Lake Louise's highest earning potential, with monthly revenues capable of climbing to $11,908, occupancy reaching a high of 54.0%, and ADRs peaking at $661.
- Conversely, the slowest single month of the year, typically falling within the low season, marks the market's lowest point. In this month, revenue might dip to $1,398, occupancy could drop to 14.4%, and ADRs may adjust down to $297.
- Understanding both the seasonal averages and these monthly peaks and troughs in revenue, occupancy, and ADR is crucial for maximizing your Airbnb profit potential in Lake Louise.
Seasonal Strategies for Maximizing Profit
- Peak Season: Maximize revenue through premium pricing and potentially longer minimum stays. Ensure high availability.
- Low Season: Offer competitive pricing, special promotions (e.g., extended stay discounts), and flexible cancellation policies. Target off-season travelers like remote workers or budget-conscious guests.
- Shoulder Seasons: Implement dynamic pricing that balances peak and low rates. Target weekend travelers or specific events. Offer slightly more flexible terms than peak season.
- Regularly analyze your own performance against these Lake Louise seasonality benchmarks and adjust your pricing and availability strategy accordingly.
Best Areas for Airbnb Investment in Lake Louise (2026)
Exploring the top neighborhoods for short-term rentals in Lake Louise? This section highlights key areas, outlining why they are attractive for hosts and guests, along with notable local attractions. Consider these locations based on your target guest profile and investment strategy.
| Neighborhood / Area | Why Host Here? (Target Guests & Appeal) | Key Attractions & Landmarks |
|---|---|---|
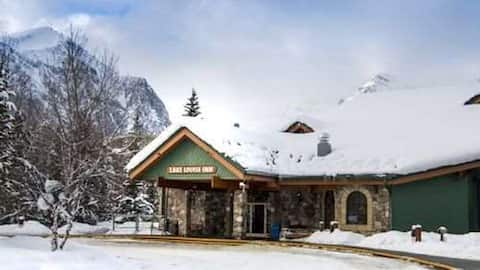
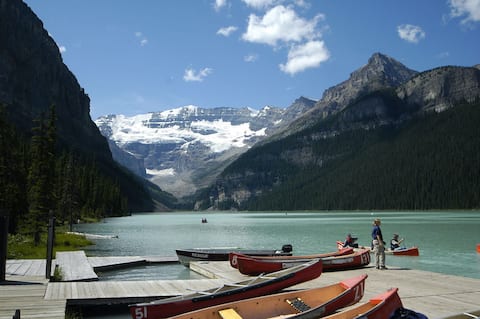
| Lake Louise Village | The central hub for visitors to Lake Louise, featuring restaurants, shops, and easy access to the lake and hiking trails. Ideal for tourists looking to explore the natural beauty of Banff National Park. | Lake Louise, Lake Louise Gondola, Fairmont Chateau Lake Louise, Moraine Lake, Bow Valley Parkway |
| Moraine Lake | One of the most picturesque locations in the Canadian Rockies, famous for its stunning turquoise waters and hiking trails. Attracts outdoor enthusiasts and photographers. | Moraine Lake, Moraine Lake Road, Consolation Lakes, Larch Valley, Rockpile Trail |
| Lake Agnes | A scenic hiking destination with a beautiful lake and teahouse at the end. Popular with hikers and families looking for a memorable outdoor experience. | Lake Agnes, Lake Agnes Teahouse, Plain of Six Glaciers, Big Beehive |
| Bow Lake | Known for its stunning views and photo opportunities, Bow Lake offers access to hiking trails and is a popular stop for travelers along the Icefields Parkway. | Bow Lake, Peyto Lake, Crown Mountain, The Bow Glacier |
| Johnston Canyon | A popular hiking spot known for its picturesque waterfalls and unique rock formations. Ideal for nature lovers and families. | Johnston Canyon, Lower Falls, Upper Falls, Ink Pots |
| Canmore | Just a short drive from Lake Louise, Canmore offers a charming downtown, arts scene, and access to outdoor activities. A great location for those wanting to explore the Bow Valley. | Canmore Nordic Centre, Grassi Lakes Trail, Downtown Canmore, Bow River |
| Banff Townsite | While slightly farther from Lake Louise, Banff offers a vibrant atmosphere with restaurants, shops, and nightlife, making it a good alternative for tourists exploring the region. | Banff National Park, Banff Avenue, Sulphur Mountain, Banff Gondola |
| Emerald Lake | Located near Field in Yoho National Park, it is famous for its deep green waters and stunning mountain scenery. An excellent site for visitors seeking tranquility and natural beauty. | Emerald Lake, Emerald Lake Lodge, Yoho National Park, Natural Bridge |
Understanding Airbnb License Requirements & STR Laws in Lake Louise (2026)
While Lake Louise, Alberta, Canada currently shows low STR regulations, specific Airbnb license requirements might still exist or change. Always verify the latest short term rental regulations and Airbnb license requirements directly with local government authorities for Lake Louise to ensure full compliance before hosting.
(Source: AirROI data, 2026, finding no licensed listings among those analyzed)
Top Performing Airbnb Properties in Lake Louise (2026)
Benchmark your potential! Explore examples of top-performing Airbnb properties in Lake Louisebased on Trailing Twelve Month (TTM) revenue. Analyze their characteristics, revenue, occupancy rate, and ADR to understand what drives success in this market.
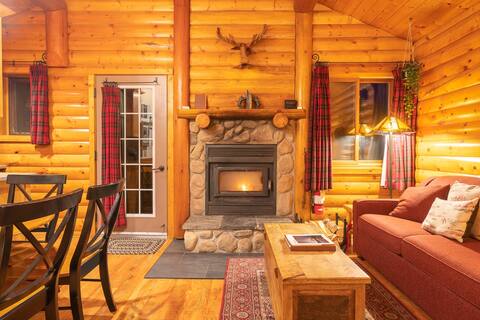
Cozy Lake Louise Retreat | Jacuzzi + Fireplace
Entire Place • 2 bedrooms
Great Location! Cozy Charming Lake Louise Getaway
Entire Place • 1 bedroom

Baker Creek - Superior Jacuzzi Suite
Private Room • 2 bedrooms

Baker Creek - Superior1Bedrm + Loft Cabin (Stairs)
Private Room • 2 bedrooms
Baker Creek - Family Superior Two Bedroom Cabin
Private Room • 2 bedrooms
Alpine Bliss | Premier Winter Getaway
Entire Place • N/A
Note: Performance varies based on location, size, amenities, seasonality, and management quality. Data reflects the past 12 months.
Top Performing Airbnb Hosts in Lake Louise (2026)
Learn from the best! This table showcases top-performing Airbnb hosts in Lake Louise based on the number of properties managed and estimated total revenue over the past year. Analyze their scale and performance metrics.
| Host Name | Properties | Grossing Revenue | Stay Reviews | Avg Rating |
|---|---|---|---|---|
| Leavetown Vacations | 9 | $578,939 | 185 | 4.54/5.0 |
| Basecamp | 8 | $455,110 | 144 | 4.75/5.0 |
| Jatin | 1 | $3,991 | 1 | Not Rated |
Analyzing the strategies of top hosts, such as their property selection, pricing, and guest communication, can offer valuable lessons for optimizing your own Airbnb operations in Lake Louise.
Dive Deeper: Advanced Lake Louise STR Market Data (2026)
Ready to unlock more insights? AirROI provides access to advanced metrics and comprehensive Airbnb data for Lake Louise. Explore detailed analytics beyond this report to refine your investment strategy, optimize pricing, and maximize your vacation rental profits.
Explore Advanced MetricsLake Louise Short-Term Rental Market Composition (2026): Property & Room Types
Room Type Distribution
Property Type Distribution
Market Composition Insights for Lake Louise
- The Lake Louise Airbnb market composition is heavily skewed towards Entire Home/Apt listings, which make up 55.6% of the 18 active rentals. This indicates strong guest preference for privacy and space.
- However, a notable 44.4% share for Private Rooms suggests opportunities for budget-conscious travelers or hosts renting out spare rooms.
- Looking at the property type distribution in Lake Louise, Apartment/Condo properties are the most common (50%), reflecting the local real estate landscape.
- The presence of 44.4% Hotel/Boutique listings indicates integration with traditional hospitality.
Lake Louise Airbnb Room Capacity Analysis (2026): Bedroom Distribution
Distribution of Listings by Number of Bedrooms
Room Capacity Insights for Lake Louise
- The dominant room capacity in Lake Louise is 1 bedroom listings, making up 44.4% of the market. This suggests a strong demand for properties suitable for couples or solo travelers.
- Together, 1 bedroom and 2 bedrooms properties represent 72.2% of the active Airbnb listings in Lake Louise, indicating a high concentration in these sizes.
Lake Louise Vacation Rental Guest Capacity Trends (2026)
Distribution of Listings by Guest Capacity
Guest Capacity Insights for Lake Louise
- The most common guest capacity trend in Lake Louise vacation rentals is listings accommodating 4 guests (38.9%). This suggests the primary traveler segment is likely small families or groups.
- Properties designed for 4 guests and 2 guests dominate the Lake Louise STR market, accounting for 55.6% of listings.
- 22.2% of properties accommodate 6+ guests, serving the market segment for larger families or group travel in Lake Louise.
- On average, properties in Lake Louise are equipped to host 4.3 guests.
Lake Louise Airbnb Booking Patterns (2026): Available vs. Booked Days
Available Days Distribution
Booked Days Distribution
Booking Pattern Insights for Lake Louise
- The most common availability pattern in Lake Louise falls within the 181-270 days range, representing 50% of listings. This suggests many properties have significant open periods on their calendars.
- Approximately 88.9% of listings show high availability (181+ days open annually), indicating potential for increased bookings or specific owner usage patterns.
- For booked days, the 91-180 days range is most frequent in Lake Louise (50%), reflecting common guest stay durations or potential owner blocking patterns.
- A notable 11.1% of properties secure long booking periods (181+ days booked per year), highlighting successful long-term rental strategies or significant owner usage.
Lake Louise Airbnb Minimum Stay Requirements Analysis
Distribution of Listings by Minimum Night Requirement
1 Night
12 listings
66.7% of total
30+ Nights
6 listings
33.3% of total
Key Insights
- The most prevalent minimum stay requirement in Lake Louise is 1 Night, adopted by 66.7% of listings. This highlights the market's preference for shorter, flexible bookings.
- A strong majority (66.7%) of the Lake Louise Airbnb data shows acceptance of very short stays (1-2 nights), indicating a dynamic, high-turnover market.
- A significant segment (33.3%) caters to monthly stays (30+ nights) in Lake Louise, pointing to opportunities in the extended-stay market.
Recommendations
- Align with the market by considering a 1 Night minimum stay, as 66.7% of Lake Louise hosts use this setting.
- Explore offering discounts for stays of 30+ nights to attract the 33.3% of the market seeking extended stays.
- Adjust minimum nights based on seasonality – potentially shorter during low season and longer during peak demand periods in Lake Louise.
Lake Louise Airbnb Cancellation Policy Trends Analysis (2026)
Super Strict 30 Days
9 listings
50% of total
Moderate
8 listings
44.4% of total
Firm
1 listings
5.6% of total
Cancellation Policy Insights for Lake Louise
- The prevailing Airbnb cancellation policy trend in Lake Louise is Super Strict 30 Days, used by 50% of listings.
- There's a relatively balanced mix between guest-friendly (44.4%) and stricter (5.6%) policies, offering choices for different guest needs.
Recommendations for Hosts
- Consider adopting a Super Strict 30 Days policy to align with the 50% market standard in Lake Louise.
- Regularly review your cancellation policy against competitors and market demand shifts in Lake Louise.
Lake Louise STR Booking Lead Time Analysis (2026)
Average Booking Lead Time by Month
Booking Lead Time Insights for Lake Louise
- The overall average booking lead time for vacation rentals in Lake Louise is 36 days.
- Guests book furthest in advance for stays during September (average 55 days), likely coinciding with peak travel demand or local events.
- The shortest booking windows occur for stays in November (average 7 days), indicating more last-minute travel plans during this time.
- Seasonally, Summer (39 days avg.) sees the longest lead times, while Spring (26 days avg.) has the shortest, reflecting typical travel planning cycles.
Recommendations for Hosts
- Use the overall average lead time (36 days) as a baseline for your pricing and availability strategy in Lake Louise.
- For September stays, consider implementing length-of-stay discounts or slightly higher rates for bookings made less than 55 days out to capitalize on advance planning.
- During November, focus on last-minute booking availability and promotions, as guests book with very short notice (7 days avg.).
- Target marketing efforts for the Summer season well in advance (at least 39 days) to capture early planners.
- Monitor your own booking lead times against these Lake Louise averages to identify opportunities for dynamic pricing adjustments.
Popular & Essential Airbnb Amenities in Lake Louise (2026)
Amenity Prevalence
Amenity Insights for Lake Louise
- Essential amenities in Lake Louise that guests expect include: Smoke alarm. Lacking these (this) could significantly impact bookings.
- Popular amenities like Free parking on premises, Wifi, Bed linens are common but not universal. Offering these can provide a competitive edge.
- Warning: Wifi is not universally provided but is considered essential globally. Ensure reliable Wifi is offered.
Recommendations for Hosts
- Ensure your listing includes all essential amenities for Lake Louise: Smoke alarm.
- Consider adding popular differentiators like Free parking on premises or Wifi to increase appeal.
- Highlight unique or less common amenities you offer (e.g., hot tub, dedicated workspace, EV charger) in your listing description and photos.
- Regularly check competitor amenities in Lake Louise to stay competitive.
Lake Louise Airbnb Guest Demographics & Profile Analysis (2026)
Guest Profile Summary for Lake Louise
- The typical guest profile for Airbnb in Lake Louise consists of predominantly international visitors (89%), with top international origins including Canada, typically belonging to the Post-2000s (Gen Z/Alpha) group (50%), primarily speaking English or German.
- Domestic travelers account for 11.3% of guests.
- Key international markets include United States (71.8%) and Canada (11.3%).
- Top languages spoken are English (62.5%) followed by German (10%).
- A significant demographic segment is the Post-2000s (Gen Z/Alpha) group, representing 50% of guests.
Recommendations for Hosts
- Focus marketing internationally, particularly towards travelers from Canada.
- Tailor amenities and listing descriptions to appeal to the dominant Post-2000s (Gen Z/Alpha) demographic (e.g., highlight fast WiFi, smart home features, local guides).
- Highlight unique local experiences or amenities relevant to the primary guest profile.
- Consider seasonal promotions aligned with peak travel times for key origin markets.
Nearby Short-Term Rental Market Comparison
How does the Lake Louise Airbnb market stack up against its neighbors? Compare key performance metrics like average monthly revenue, ADR, and occupancy rates in surrounding areas to understand the broader regional STR landscape.
| Market | Active Properties | Monthly Revenue | Daily Rate | Avg. Occupancy |
|---|---|---|---|---|
| Canmore | 1,763 | $5,784 | $319.27 | 61% |
| Harvie Heights | 209 | $5,319 | $305.53 | 63% |
| Banff | 137 | $4,939 | $420.71 | 44% |
| Dead Man's Flats | 203 | $4,909 | $260.53 | 59% |
| Nordegg | 43 | $3,690 | $261.54 | 50% |
| Area A (Kicking Horse/Kinbasket Lake) | 470 | $3,464 | $252.34 | 52% |
| Area F (Columbia Lake/Windermere Lake) | 384 | $2,819 | $262.48 | 42% |
| Bighorn No. 8 | 14 | $2,753 | $202.46 | 50% |
| Invermere | 198 | $2,497 | $219.30 | 46% |
| Panorama | 10 | $2,424 | $290.27 | 40% |