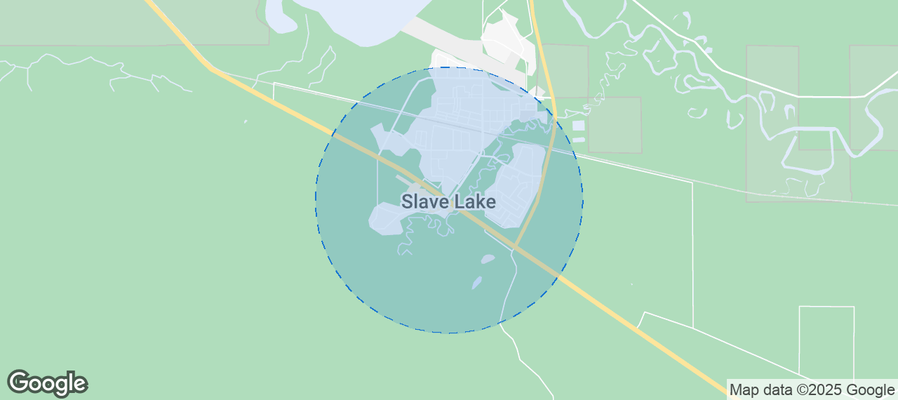
Town of Slave Lake Airbnb Market Analysis 2025: Short Term Rental Data & Vacation Rental Statistics in Alberta, Canada
Is Airbnb profitable in Town of Slave Lake in 2025? Explore comprehensive Airbnb analytics for Town of Slave Lake, Alberta, Canada to uncover income potential. This 2025 STR market report for Town of Slave Lake, based on AirROI data from October 2024 to September 2025, reveals key trends in the niche market of 17 active listings.
Whether you're considering an Airbnb investment in Town of Slave Lake, optimizing your existing vacation rental, or exploring rental arbitrage opportunities, understanding the Town of Slave Lake Airbnb data is crucial. Leveraging the low regulation environment is key to maximizing your short term rental income potential. Let's dive into the specifics.
Key Town of Slave Lake Airbnb Performance Metrics Overview
Monthly Airbnb Revenue Variations & Income Potential in Town of Slave Lake (2025)
Understanding the monthly revenue variations for Airbnb listings in Town of Slave Lake is key to maximizing your short term rental income potential. Seasonality significantly impacts earnings. Our analysis, based on data from the past 12 months, shows that the peak revenue month for STRs in Town of Slave Lake is typically January, while May often presents the lowest earnings, highlighting opportunities for strategic pricing adjustments during shoulder and low seasons. Explore the typical Airbnb income in Town of Slave Lake across different performance tiers:
- Best-in-class properties (Top 10%) achieve $3,632+ monthly, often utilizing dynamic pricing and superior guest experiences.
- Strong performing properties (Top 25%) earn $2,773 or more, indicating effective management and desirable locations/amenities.
- Typical properties (Median) generate around $1,968 per month, representing the average market performance.
- Entry-level properties (Bottom 25%) see earnings around $1,226, often with potential for optimization.
Average Monthly Airbnb Earnings Trend in Town of Slave Lake
Town of Slave Lake Airbnb Occupancy Rate Trends (2025)
Maximize your bookings by understanding the Town of Slave Lake STR occupancy trends. Seasonal demand shifts significantly influence how often properties are booked. Typically, Januarysees the highest demand (peak season occupancy), while May experiences the lowest (low season). Effective strategies, like adjusting minimum stays or offering promotions, can boost occupancy during slower periods. Here's how different property tiers perform in Town of Slave Lake:
- Best-in-class properties (Top 10%) achieve 82%+ occupancy, indicating high desirability and potentially optimized availability.
- Strong performing properties (Top 25%) maintain 72% or higher occupancy, suggesting good market fit and guest satisfaction.
- Typical properties (Median) have an occupancy rate around 51%.
- Entry-level properties (Bottom 25%) average 32% occupancy, potentially facing higher vacancy.
Average Monthly Occupancy Rate Trend in Town of Slave Lake
Average Daily Rate (ADR) Airbnb Trends in Town of Slave Lake (2025)
Effective short term rental pricing strategy in Town of Slave Lake involves understanding monthly ADR fluctuations. The Average Daily Rate (ADR) for Airbnb in Town of Slave Lake typically peaks in June and dips lowest during April. Leveraging Airbnb dynamic pricing tools or strategies based on this seasonality can significantly boost revenue. Here's a look at the typical nightly rates achieved:
- Best-in-class properties (Top 10%) command rates of $177+ per night, often due to premium features or locations.
- Strong performing properties (Top 25%) achieve nightly rates of $141 or more.
- Typical properties (Median) charge around $127 per night.
- Entry-level properties (Bottom 25%) earn around $109 per night.
Average Daily Rate (ADR) Trend by Month in Town of Slave Lake
Get Live Town of Slave Lake Market Intelligence 👇
Explore Real-time Analytics
Airbnb Seasonality Analysis & Trends in Town of Slave Lake (2025)
Peak Season (January, September, February)
- Revenue averages $2,711 per month
- Occupancy rates average 69.9%
- Daily rates average $124
Shoulder Season
- Revenue averages $2,205 per month
- Occupancy maintains around 51.9%
- Daily rates hold near $127
Low Season (April, May, November)
- Revenue drops to average $1,454 per month
- Occupancy decreases to average 39.4%
- Daily rates adjust to average $122
Seasonality Insights for Town of Slave Lake
- The Airbnb seasonality in Town of Slave Lake shows highly seasonal trends requiring careful strategy. While the sections above show seasonal averages, it's also insightful to look at the extremes:
- During the high season, the absolute peak month showcases Town of Slave Lake's highest earning potential, with monthly revenues capable of climbing to $2,976, occupancy reaching a high of 78.8%, and ADRs peaking at $135.
- Conversely, the slowest single month of the year, typically falling within the low season, marks the market's lowest point. In this month, revenue might dip to $1,220, occupancy could drop to 35.0%, and ADRs may adjust down to $115.
- Understanding both the seasonal averages and these monthly peaks and troughs in revenue, occupancy, and ADR is crucial for maximizing your Airbnb profit potential in Town of Slave Lake.
Seasonal Strategies for Maximizing Profit
- Peak Season: Maximize revenue through premium pricing and potentially longer minimum stays. Ensure high availability.
- Low Season: Offer competitive pricing, special promotions (e.g., extended stay discounts), and flexible cancellation policies. Target off-season travelers like remote workers or budget-conscious guests.
- Shoulder Seasons: Implement dynamic pricing that balances peak and low rates. Target weekend travelers or specific events. Offer slightly more flexible terms than peak season.
- Regularly analyze your own performance against these Town of Slave Lake seasonality benchmarks and adjust your pricing and availability strategy accordingly.
Best Areas for Airbnb Investment in Town of Slave Lake (2025)
Exploring the top neighborhoods for short-term rentals in Town of Slave Lake? This section highlights key areas, outlining why they are attractive for hosts and guests, along with notable local attractions. Consider these locations based on your target guest profile and investment strategy.
| Neighborhood / Area | Why Host Here? (Target Guests & Appeal) | Key Attractions & Landmarks |
|---|---|---|
| Downtown Slave Lake | The heart of the town, offering easy access to restaurants, shops, and essential services. Ideal for guests looking for convenience and a local experience. | Northern Lakes College, Slave Lake Waterfront, Local Boutique Shops, Restaurants, Museums |
| Slave Lake Provincial Park | A beautiful natural area perfect for outdoor enthusiasts. Ideal for tourists looking to explore the great outdoors with hiking, fishing, and camping opportunities. | Hiking Trails, Fishing Spots, Camping Areas, Beaches, Wildlife Viewing |
| Martineau Beach | A popular area for summer visitors looking for beach access and water activities. Great for families and groups looking to enjoy sunny days by the water. | Beach Access, Water Sports, Picnic Areas, Playgrounds |
| Fan View Park | A suburban area that provides a quiet and family-friendly environment. Attractive for longer stays and families traveling with children. | Parks, Playground, Quiet Neighborhood, Family-Friendly Amenities |
| Sawridge First Nation | A culturally rich area offering unique insights into local Indigenous culture. Ideal for those interested in cultural experiences and community events. | Cultural Events, Community Gatherings, Parks |
| Widewater | A scenic area located near the lake, popular for those looking for a peaceful retreat and natural beauty. Attracts nature lovers and those looking to relax away from the town center. | Lakeside Views, Nature Trails, Bird Watching, Fishing |
| Canyon Creek | A quiet area slightly outside of town, perfect for those wanting to escape the hustle and bustle. Great for nature retreats and outdoor adventures. | Tranquil Settings, Nature Trails, Outdoor Activities |
| Northern Lakes College Area | A location near the education center that attracts students and visiting faculty. Good for budget travelers and those looking for longer stays. | Local Events, Student Activities, Affordable Dining |
Understanding Airbnb License Requirements & STR Laws in Town of Slave Lake (2025)
While Town of Slave Lake, Alberta, Canada currently shows low STR regulations, specific Airbnb license requirements might still exist or change. Always verify the latest short term rental regulations and Airbnb license requirements directly with local government authorities for Town of Slave Lake to ensure full compliance before hosting.
(Source: AirROI data, 2025, finding no licensed listings among those analyzed)
Top Performing Airbnb Properties in Town of Slave Lake (2025)
Benchmark your potential! Explore examples of top-performing Airbnb properties in Town of Slave Lakebased on Trailing Twelve Month (TTM) revenue. Analyze their characteristics, revenue, occupancy rate, and ADR to understand what drives success in this market.
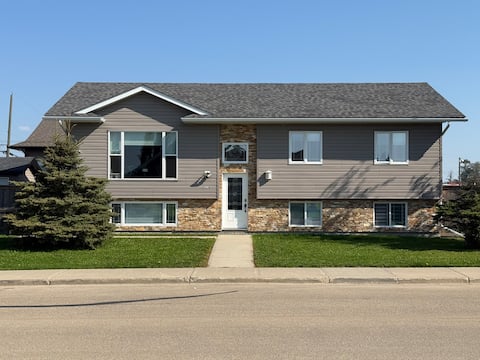
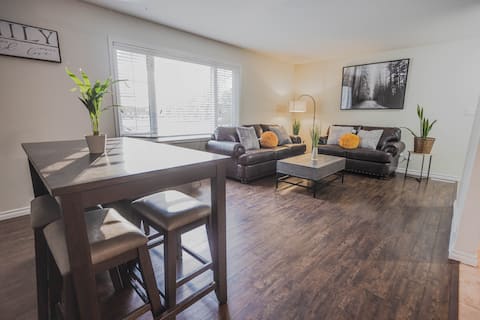
Slavelake Guesthouse 1 (upper level/3 bedrooms)
Entire Place • 3 bedrooms
337_Slavelake
Entire Place • 4 bedrooms
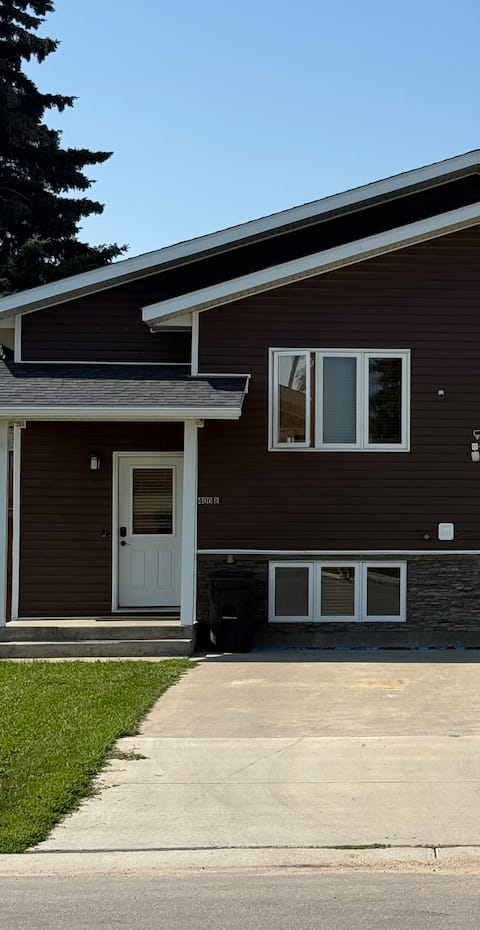
Slavelake Guesthouse 3 (upper level/2 bedrooms)
Entire Place • 2 bedrooms

Slavelake Guesthouse 2 (basement suite/3 bedrooms)
Entire Place • 3 bedrooms
Slavelake Guesthouse 5 (Rosario/3 bedrooms)
Entire Place • 3 bedrooms
Old Town Cabins #2
Entire Place • 2 bedrooms
Note: Performance varies based on location, size, amenities, seasonality, and management quality. Data reflects the past 12 months.
Top Performing Airbnb Hosts in Town of Slave Lake (2025)
Learn from the best! This table showcases top-performing Airbnb hosts in Town of Slave Lake based on the number of properties managed and estimated total revenue over the past year. Analyze their scale and performance metrics.
| Host Name | Properties | Grossing Revenue | Stay Reviews | Avg Rating |
|---|---|---|---|---|
| Molly Grace | 6 | $157,697 | 319 | 4.97/5.0 |
| Dioni | 1 | $31,333 | 27 | 4.85/5.0 |
| Gail | 1 | $25,538 | 47 | 4.87/5.0 |
| Tyler | 1 | $25,371 | 53 | 4.98/5.0 |
| Rhea Ann | 1 | $20,621 | 43 | 4.95/5.0 |
| Thomas | 1 | $15,233 | 22 | 4.82/5.0 |
| Merla | 1 | $14,662 | 28 | 4.82/5.0 |
| Juan | 1 | $9,638 | 21 | 4.57/5.0 |
| Sarah | 1 | $9,575 | 6 | 5.00/5.0 |
| Therese | 1 | $6,138 | 18 | 4.94/5.0 |
Analyzing the strategies of top hosts, such as their property selection, pricing, and guest communication, can offer valuable lessons for optimizing your own Airbnb operations in Town of Slave Lake.
Dive Deeper: Advanced Town of Slave Lake STR Market Data (2025)
Ready to unlock more insights? AirROI provides access to advanced metrics and comprehensive Airbnb data for Town of Slave Lake. Explore detailed analytics beyond this report to refine your investment strategy, optimize pricing, and maximize your vacation rental profits.
Explore Advanced MetricsTown of Slave Lake Short-Term Rental Market Composition (2025): Property & Room Types
Room Type Distribution
Property Type Distribution
Market Composition Insights for Town of Slave Lake
- The Town of Slave Lake Airbnb market composition is heavily skewed towards Entire Home/Apt listings, which make up 94.1% of the 17 active rentals. This indicates strong guest preference for privacy and space.
- Looking at the property type distribution in Town of Slave Lake, House properties are the most common (52.9%), reflecting the local real estate landscape.
- Houses represent a significant 52.9% portion, catering likely to families or larger groups.
- The presence of 11.8% Hotel/Boutique listings indicates integration with traditional hospitality.
Town of Slave Lake Airbnb Room Capacity Analysis (2025): Bedroom Distribution
Distribution of Listings by Number of Bedrooms
Room Capacity Insights for Town of Slave Lake
- The dominant room capacity in Town of Slave Lake is 3 bedrooms listings, making up 41.2% of the market. This suggests a strong demand for properties suitable for families or small groups.
- Together, 3 bedrooms and 2 bedrooms properties represent 70.6% of the active Airbnb listings in Town of Slave Lake, indicating a high concentration in these sizes.
- A significant 47.1% of listings offer 3+ bedrooms, catering to larger groups and families seeking more space in Town of Slave Lake.
Town of Slave Lake Vacation Rental Guest Capacity Trends (2025)
Distribution of Listings by Guest Capacity
Guest Capacity Insights for Town of Slave Lake
- The most common guest capacity trend in Town of Slave Lake vacation rentals is listings accommodating 6 guests (47.1%). This suggests the primary traveler segment is likely larger groups.
- Properties designed for 6 guests and 5 guests dominate the Town of Slave Lake STR market, accounting for 64.7% of listings.
- 53.0% of properties accommodate 6+ guests, serving the market segment for larger families or group travel in Town of Slave Lake.
- On average, properties in Town of Slave Lake are equipped to host 4.9 guests.
Town of Slave Lake Airbnb Booking Patterns (2025): Available vs. Booked Days
Available Days Distribution
Booked Days Distribution
Booking Pattern Insights for Town of Slave Lake
- The most common availability pattern in Town of Slave Lake falls within the 181-270 days range, representing 52.9% of listings. This suggests many properties have significant open periods on their calendars.
- Approximately 70.5% of listings show high availability (181+ days open annually), indicating potential for increased bookings or specific owner usage patterns.
- For booked days, the 91-180 days range is most frequent in Town of Slave Lake (52.9%), reflecting common guest stay durations or potential owner blocking patterns.
- A notable 29.4% of properties secure long booking periods (181+ days booked per year), highlighting successful long-term rental strategies or significant owner usage.
Town of Slave Lake Airbnb Minimum Stay Requirements Analysis
Distribution of Listings by Minimum Night Requirement
1 Night
2 listings
11.8% of total
2 Nights
8 listings
47.1% of total
3 Nights
2 listings
11.8% of total
30+ Nights
5 listings
29.4% of total
Key Insights
- The most prevalent minimum stay requirement in Town of Slave Lake is 2 Nights, adopted by 47.1% of listings. This highlights the market's preference for shorter, flexible bookings.
- A significant segment (29.4%) caters to monthly stays (30+ nights) in Town of Slave Lake, pointing to opportunities in the extended-stay market.
Recommendations
- Align with the market by considering a 2 Nights minimum stay, as 47.1% of Town of Slave Lake hosts use this setting.
- If feasible, allowing 1-night stays, especially midweek or during low season, could capture last-minute bookings, as only 11.8% currently do.
- A 2-night minimum appears standard (47.1%). Consider this for weekends or peak periods.
- Explore offering discounts for stays of 30+ nights to attract the 29.4% of the market seeking extended stays.
- Adjust minimum nights based on seasonality – potentially shorter during low season and longer during peak demand periods in Town of Slave Lake.
Town of Slave Lake Airbnb Cancellation Policy Trends Analysis (2025)
Flexible
5 listings
29.4% of total
Moderate
5 listings
29.4% of total
Firm
1 listings
5.9% of total
Strict
6 listings
35.3% of total
Cancellation Policy Insights for Town of Slave Lake
- The prevailing Airbnb cancellation policy trend in Town of Slave Lake is Strict, used by 35.3% of listings.
- There's a relatively balanced mix between guest-friendly (58.8%) and stricter (41.2%) policies, offering choices for different guest needs.
Recommendations for Hosts
- Consider adopting a Strict policy to align with the 35.3% market standard in Town of Slave Lake.
- With 35.3% using Strict terms, this is a viable option in Town of Slave Lake, particularly for high-value properties or during peak demand periods.
- Regularly review your cancellation policy against competitors and market demand shifts in Town of Slave Lake.
Town of Slave Lake STR Booking Lead Time Analysis (2025)
Average Booking Lead Time by Month
Booking Lead Time Insights for Town of Slave Lake
- The overall average booking lead time for vacation rentals in Town of Slave Lake is 16 days.
- Guests book furthest in advance for stays during July (average 30 days), likely coinciding with peak travel demand or local events.
- The shortest booking windows occur for stays in December (average 4 days), indicating more last-minute travel plans during this time.
- Seasonally, Summer (23 days avg.) sees the longest lead times, while Winter (7 days avg.) has the shortest, reflecting typical travel planning cycles.
Recommendations for Hosts
- Use the overall average lead time (16 days) as a baseline for your pricing and availability strategy in Town of Slave Lake.
- For July stays, consider implementing length-of-stay discounts or slightly higher rates for bookings made less than 30 days out to capitalize on advance planning.
- During December, focus on last-minute booking availability and promotions, as guests book with very short notice (4 days avg.).
- Target marketing efforts for the Summer season well in advance (at least 23 days) to capture early planners.
- Monitor your own booking lead times against these Town of Slave Lake averages to identify opportunities for dynamic pricing adjustments.
Popular & Essential Airbnb Amenities in Town of Slave Lake (2025)
Amenity Prevalence
Amenity Insights for Town of Slave Lake
- Essential amenities in Town of Slave Lake that guests expect include: Free parking on premises, Wifi, Dishes and silverware, Smoke alarm, TV, Heating. Lacking these (any) could significantly impact bookings.
- Popular amenities like Washer, Fire extinguisher, Refrigerator are common but not universal. Offering these can provide a competitive edge.
Recommendations for Hosts
- Ensure your listing includes all essential amenities for Town of Slave Lake: Free parking on premises, Wifi, Dishes and silverware, Smoke alarm, TV, Heating.
- Consider adding popular differentiators like Washer or Fire extinguisher to increase appeal.
- Highlight unique or less common amenities you offer (e.g., hot tub, dedicated workspace, EV charger) in your listing description and photos.
- Regularly check competitor amenities in Town of Slave Lake to stay competitive.
Town of Slave Lake Airbnb Guest Demographics & Profile Analysis (2025)
Guest Profile Summary for Town of Slave Lake
- The typical guest profile for Airbnb in Town of Slave Lake consists of primarily domestic travelers (100%), often arriving from nearby Edmonton, typically belonging to the Post-2000s (Gen Z/Alpha) group (50%), primarily speaking English or Spanish.
- Domestic travelers account for 100.0% of guests.
- Top languages spoken are English (73.9%) followed by Spanish (10.9%).
- A significant demographic segment is the Post-2000s (Gen Z/Alpha) group, representing 50% of guests.
Recommendations for Hosts
- Target domestic marketing efforts towards travelers from Edmonton and Calgary.
- Tailor amenities and listing descriptions to appeal to the dominant Post-2000s (Gen Z/Alpha) demographic (e.g., highlight fast WiFi, smart home features, local guides).
- Highlight unique local experiences or amenities relevant to the primary guest profile.
- Consider seasonal promotions aligned with peak travel times for key origin markets.
Nearby Short-Term Rental Market Comparison
How does the Town of Slave Lake Airbnb market stack up against its neighbors? Compare key performance metrics like average monthly revenue, ADR, and occupancy rates in surrounding areas to understand the broader regional STR landscape.
| Market | Active Properties | Monthly Revenue | Daily Rate | Avg. Occupancy |
|---|---|---|---|---|
| Barrhead | 10 | $761 | $168.11 | 32% |