Area D (Kiskatinaw Valley) Airbnb Market Analysis 2025: Short Term Rental Data & Vacation Rental Statistics in British Columbia, Canada
Is Airbnb profitable in Area D (Kiskatinaw Valley) in 2025? Explore comprehensive Airbnb analytics for Area D (Kiskatinaw Valley), British Columbia, Canada to uncover income potential. This 2025 STR market report for Area D (Kiskatinaw Valley), based on AirROI data from July 2024 to June 2025, reveals key trends in the niche market of 19 active listings.
Whether you're considering an Airbnb investment in Area D (Kiskatinaw Valley), optimizing your existing vacation rental, or exploring rental arbitrage opportunities, understanding the Area D (Kiskatinaw Valley) Airbnb data is crucial. Understanding the local regulations is key to maximizing your short term rental income potential. Let's dive into the specifics.
Key Area D (Kiskatinaw Valley) Airbnb Performance Metrics Overview
Monthly Airbnb Revenue Variations & Income Potential in Area D (Kiskatinaw Valley) (2025)
Understanding the monthly revenue variations for Airbnb listings in Area D (Kiskatinaw Valley) is key to maximizing your short term rental income potential. Seasonality significantly impacts earnings. Our analysis, based on data from the past 12 months, shows that the peak revenue month for STRs in Area D (Kiskatinaw Valley) is typically November, while October often presents the lowest earnings, highlighting opportunities for strategic pricing adjustments during shoulder and low seasons. Explore the typical Airbnb income in Area D (Kiskatinaw Valley) across different performance tiers:
- Best-in-class properties (Top 10%) achieve $2,876+ monthly, often utilizing dynamic pricing and superior guest experiences.
- Strong performing properties (Top 25%) earn $1,345 or more, indicating effective management and desirable locations/amenities.
- Typical properties (Median) generate around $967 per month, representing the average market performance.
- Entry-level properties (Bottom 25%) see earnings around $473, often with potential for optimization.
Average Monthly Airbnb Earnings Trend in Area D (Kiskatinaw Valley)
Area D (Kiskatinaw Valley) Airbnb Occupancy Rate Trends (2025)
Maximize your bookings by understanding the Area D (Kiskatinaw Valley) STR occupancy trends. Seasonal demand shifts significantly influence how often properties are booked. Typically, Februarysees the highest demand (peak season occupancy), while October experiences the lowest (low season). Effective strategies, like adjusting minimum stays or offering promotions, can boost occupancy during slower periods. Here's how different property tiers perform in Area D (Kiskatinaw Valley):
- Best-in-class properties (Top 10%) achieve 85%+ occupancy, indicating high desirability and potentially optimized availability.
- Strong performing properties (Top 25%) maintain 64% or higher occupancy, suggesting good market fit and guest satisfaction.
- Typical properties (Median) have an occupancy rate around 46%.
- Entry-level properties (Bottom 25%) average 28% occupancy, potentially facing higher vacancy.
Average Monthly Occupancy Rate Trend in Area D (Kiskatinaw Valley)
Average Daily Rate (ADR) Airbnb Trends in Area D (Kiskatinaw Valley) (2025)
Effective short term rental pricing strategy in Area D (Kiskatinaw Valley) involves understanding monthly ADR fluctuations. The Average Daily Rate (ADR) for Airbnb in Area D (Kiskatinaw Valley) typically peaks in September and dips lowest during February. Leveraging Airbnb dynamic pricing tools or strategies based on this seasonality can significantly boost revenue. Here's a look at the typical nightly rates achieved:
- Best-in-class properties (Top 10%) command rates of $134+ per night, often due to premium features or locations.
- Strong performing properties (Top 25%) achieve nightly rates of $87 or more.
- Typical properties (Median) charge around $66 per night.
- Entry-level properties (Bottom 25%) earn around $57 per night.
Average Daily Rate (ADR) Trend by Month in Area D (Kiskatinaw Valley)
Get Live Area D (Kiskatinaw Valley) Market Intelligence 👇
.png)
Explore Real-time Analytics
Airbnb Seasonality Analysis & Trends in Area D (Kiskatinaw Valley) (2025)
Peak Season (November, September, August)
- Revenue averages $1,767 per month
- Occupancy rates average 49.4%
- Daily rates average $91
Shoulder Season
- Revenue averages $1,172 per month
- Occupancy maintains around 56.9%
- Daily rates hold near $80
Low Season (January, October, December)
- Revenue drops to average $605 per month
- Occupancy decreases to average 30.9%
- Daily rates adjust to average $89
Seasonality Insights for Area D (Kiskatinaw Valley)
- The Airbnb seasonality in Area D (Kiskatinaw Valley) shows highly seasonal trends requiring careful strategy. While the sections above show seasonal averages, it's also insightful to look at the extremes:
- During the high season, the absolute peak month showcases Area D (Kiskatinaw Valley)'s highest earning potential, with monthly revenues capable of climbing to $2,216, occupancy reaching a high of 75.7%, and ADRs peaking at $93.
- Conversely, the slowest single month of the year, typically falling within the low season, marks the market's lowest point. In this month, revenue might dip to $487, occupancy could drop to 26.4%, and ADRs may adjust down to $76.
- Understanding both the seasonal averages and these monthly peaks and troughs in revenue, occupancy, and ADR is crucial for maximizing your Airbnb profit potential in Area D (Kiskatinaw Valley).
Seasonal Strategies for Maximizing Profit
- Peak Season: Maximize revenue through premium pricing and potentially longer minimum stays. Ensure high availability.
- Low Season: Offer competitive pricing, special promotions (e.g., extended stay discounts), and flexible cancellation policies. Target off-season travelers like remote workers or budget-conscious guests.
- Shoulder Seasons: Implement dynamic pricing that balances peak and low rates. Target weekend travelers or specific events. Offer slightly more flexible terms than peak season.
- Regularly analyze your own performance against these Area D (Kiskatinaw Valley) seasonality benchmarks and adjust your pricing and availability strategy accordingly.
Best Areas for Airbnb Investment in Area D (Kiskatinaw Valley) (2025)
Exploring the top neighborhoods for short-term rentals in Area D (Kiskatinaw Valley)? This section highlights key areas, outlining why they are attractive for hosts and guests, along with notable local attractions. Consider these locations based on your target guest profile and investment strategy.
| Neighborhood / Area | Why Host Here? (Target Guests & Appeal) | Key Attractions & Landmarks |
|---|---|---|
| Kiskatinaw Valley | Kiskatinaw Valley is known for its picturesque landscapes and close-knit community, making it an attractive getaway for nature lovers and those looking for tranquility. The location offers a unique blend of rural charm and outdoor adventure, appealing to guests looking to escape the city. | Kiskatinaw River Provincial Park, Kiskatinaw Valley hiking trails, Peace River Regional District recreation activities, local farms and artisanal markets, wildlife viewing opportunities |
| Taylor | Taylor is a small yet vibrant community located nearby, known for its scenic views of the Peace River Valley. It appeals to visitors seeking outdoor activities and a taste of local culture, with friendly hospitality and various local events. | Taylor Landing, Peace Island Park, local art galleries, annual community events, recreational trails |
| Fort St. John | As the largest city in the area, Fort St. John offers a range of amenities, shopping, and dining options, making it a convenient choice for short-term rentals. It serves as a hub for business travelers and vacationers alike, providing easy access to surrounding natural attractions. | Fort St. John North Peace Museum, Fish Creek Community Forest, local festivals and events, Canoe Reach, Tumbler Ridge UNESCO Global Geopark |
| Montney | A rural area known for its agriculture and natural beauty, Montney attracts guests interested in farming tourism and outdoor activities. It's perfect for those looking for a peaceful stay in the countryside, away from urban hustle. | Montney Park, agricultural tours, nature walks, local markets, outdoor adventure activities |
| North Peace | This area is rich in natural resources and offers opportunities for outdoor recreation, such as fishing and hiking. North Peace is ideal for travelers looking for adventure and a connection to nature. | Moberly Lake Provincial Park, recreational fishing spots, hiking and camping areas, wildlife experiences, local flora and fauna tours |
| Doe River | Known for its serene landscapes and recreational activities, Doe River is a hidden gem for those wanting a quieter retreat. It's perfect for nature enthusiasts looking to explore camping, fishing, and hiking options. | Doe River Recreation Site, outdoor camping spots, kayaking and fishing locations, nature observation, scenic drives through the valley |
| Baldonnel | A peaceful, residential area close to Fort St. John that offers a rural experience while still being near urban conveniences. It's a great spot for travelers seeking both relaxation and access to city amenities. | Baldonnel Park, local farm tours, community events, outdoor sports facilities, proximity to Fort St. John attractions |
| Charlie Lake | Famous for its beautiful lake and outdoor activities, Charlie Lake is perfect for summer vacations and recreational rentals. Visitors can enjoy swimming, boating, and fishing in a stunning natural setting. | Charlie Lake Provincial Park, swimming and beaches, boating spots, picnic areas, local wildlife |
Understanding Airbnb License Requirements & STR Laws in Area D (Kiskatinaw Valley) (2025)
With 11% of listings showing registration in 2025, understanding potential Airbnb license requirements is crucial in Area D (Kiskatinaw Valley). Always verify the latest short term rental regulations and Airbnb license requirements directly with local government authorities for Area D (Kiskatinaw Valley) to ensure full compliance before hosting.
(Source: AirROI data, 2025, based on 11% licensed listings)
Top Performing Airbnb Properties in Area D (Kiskatinaw Valley) (2025)
Benchmark your potential! Explore examples of top-performing Airbnb properties in Area D (Kiskatinaw Valley)based on Trailing Twelve Month (TTM) revenue. Analyze their characteristics, revenue, occupancy rate, and ADR to understand what drives success in this market.
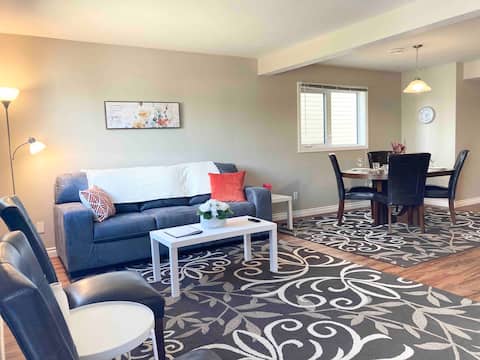
3 bed 2.5 bath: King Bed, Walk-in Closets, Modern
Entire Place • 3 bedrooms
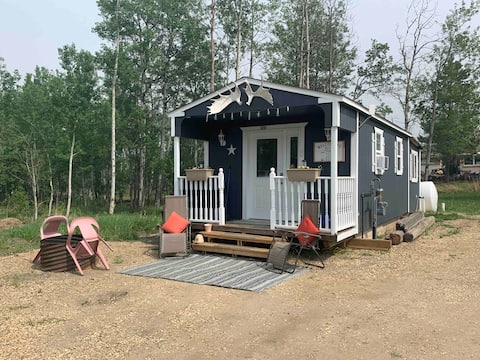
Moose On The Loose Lodge Dawson Creek BC
Entire Place • N/A

Unit 20 - 1800C - Quiet, clean 1 bedroom unit
Entire Place • 1 bedroom

Modern Studio Suite
Entire Place • N/A
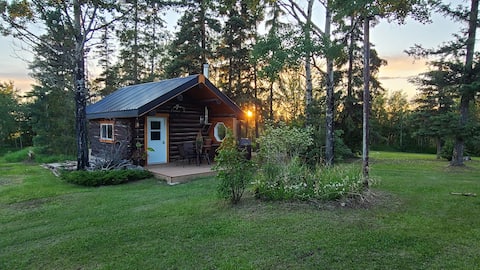
Historic rustic cabin with pond and garden views.
Entire Place • 1 bedroom

Spacious, Bright, Private Rental House
Entire Place • 1 bedroom
Note: Performance varies based on location, size, amenities, seasonality, and management quality. Data reflects the past 12 months.
Top Performing Airbnb Hosts in Area D (Kiskatinaw Valley) (2025)
Learn from the best! This table showcases top-performing Airbnb hosts in Area D (Kiskatinaw Valley) based on the number of properties managed and estimated total revenue over the past year. Analyze their scale and performance metrics.
| Host Name | Properties | Grossing Revenue | Stay Reviews | Avg Rating |
|---|---|---|---|---|
| Darryl | 13 | $41,322 | 129 | 4.87/5.0 |
| Reza | 1 | $16,814 | 18 | 4.94/5.0 |
| Denise | 1 | $10,356 | 51 | 4.88/5.0 |
| Elaina | 1 | $7,113 | 16 | 4.94/5.0 |
| Jonathan | 1 | $3,909 | 6 | 5.00/5.0 |
| Host #128914972 | 1 | $3,909 | 7 | 5.00/5.0 |
| Host #447648713 | 1 | $2,842 | 0 | Not Rated |
Analyzing the strategies of top hosts, such as their property selection, pricing, and guest communication, can offer valuable lessons for optimizing your own Airbnb operations in Area D (Kiskatinaw Valley).
Dive Deeper: Advanced Area D (Kiskatinaw Valley) STR Market Data (2025)
Ready to unlock more insights? AirROI provides access to advanced metrics and comprehensive Airbnb data for Area D (Kiskatinaw Valley). Explore detailed analytics beyond this report to refine your investment strategy, optimize pricing, and maximize your vacation rental profits.
Explore Advanced MetricsArea D (Kiskatinaw Valley) Short-Term Rental Market Composition (2025): Property & Room Types
Room Type Distribution
Property Type Distribution
Market Composition Insights for Area D (Kiskatinaw Valley)
- The Area D (Kiskatinaw Valley) Airbnb market composition is heavily skewed towards Entire Home/Apt listings, which make up 100% of the 19 active rentals. This indicates strong guest preference for privacy and space.
- Looking at the property type distribution in Area D (Kiskatinaw Valley), House properties are the most common (78.9%), reflecting the local real estate landscape.
- Houses represent a significant 78.9% portion, catering likely to families or larger groups.
- The presence of 5.3% Hotel/Boutique listings indicates integration with traditional hospitality.
Area D (Kiskatinaw Valley) Airbnb Room Capacity Analysis (2025): Bedroom Distribution
Distribution of Listings by Number of Bedrooms
Room Capacity Insights for Area D (Kiskatinaw Valley)
- The dominant room capacity in Area D (Kiskatinaw Valley) is 1 bedroom listings, making up 68.4% of the market. This suggests a strong demand for properties suitable for couples or solo travelers.
- Together, 1 bedroom and 2 bedrooms properties represent 84.2% of the active Airbnb listings in Area D (Kiskatinaw Valley), indicating a high concentration in these sizes.
- With over half the market (68.4%) consisting of studios or 1-bedroom units, Area D (Kiskatinaw Valley) is particularly well-suited for individuals or couples.
- Listings with 3+ bedrooms (5.3%) represent a smaller niche, potentially indicating an underserved market for larger group accommodations in Area D (Kiskatinaw Valley).
Area D (Kiskatinaw Valley) Vacation Rental Guest Capacity Trends (2025)
Distribution of Listings by Guest Capacity
Guest Capacity Insights for Area D (Kiskatinaw Valley)
- The most common guest capacity trend in Area D (Kiskatinaw Valley) vacation rentals is listings accommodating 1 guest (42.1%). This suggests the primary traveler segment is likely couples or solo travelers.
- Properties designed for 1 guest and 2 guests dominate the Area D (Kiskatinaw Valley) STR market, accounting for 68.4% of listings.
- A significant 68.4% of listings cater specifically to 1-2 guests, highlighting strong demand from couples and solo travelers in Area D (Kiskatinaw Valley).
- On average, properties in Area D (Kiskatinaw Valley) are equipped to host 2.2 guests.
Area D (Kiskatinaw Valley) Airbnb Booking Patterns (2025): Available vs. Booked Days
Available Days Distribution
Booked Days Distribution
Booking Pattern Insights for Area D (Kiskatinaw Valley)
- The most common availability pattern in Area D (Kiskatinaw Valley) falls within the 271-366 days range, representing 84.2% of listings. This suggests many properties have significant open periods on their calendars.
- Approximately 100.0% of listings show high availability (181+ days open annually), indicating potential for increased bookings or specific owner usage patterns.
- For booked days, the 31-90 days range is most frequent in Area D (Kiskatinaw Valley) (57.9%), reflecting common guest stay durations or potential owner blocking patterns.
Area D (Kiskatinaw Valley) Airbnb Minimum Stay Requirements Analysis
Distribution of Listings by Minimum Night Requirement
1 Night
2 listings
14.3% of total
2 Nights
1 listings
7.1% of total
3 Nights
1 listings
7.1% of total
4-6 Nights
3 listings
21.4% of total
7-29 Nights
6 listings
42.9% of total
30+ Nights
1 listings
7.1% of total
Key Insights
- The most prevalent minimum stay requirement in Area D (Kiskatinaw Valley) is 7-29 Nights, adopted by 42.9% of listings. This highlights the market's preference for shorter, flexible bookings.
Recommendations
- Align with the market by considering a 7-29 Nights minimum stay, as 42.9% of Area D (Kiskatinaw Valley) hosts use this setting.
- If feasible, allowing 1-night stays, especially midweek or during low season, could capture last-minute bookings, as only 14.3% currently do.
- Explore offering discounts for stays of 30+ nights to attract the 7.1% of the market seeking extended stays.
- Adjust minimum nights based on seasonality – potentially shorter during low season and longer during peak demand periods in Area D (Kiskatinaw Valley).
Area D (Kiskatinaw Valley) Airbnb Cancellation Policy Trends Analysis (2025)
Flexible
1 listings
5.6% of total
Moderate
7 listings
38.9% of total
Firm
8 listings
44.4% of total
Strict
2 listings
11.1% of total
Cancellation Policy Insights for Area D (Kiskatinaw Valley)
- The prevailing Airbnb cancellation policy trend in Area D (Kiskatinaw Valley) is Firm, used by 44.4% of listings.
- A majority (55.5%) of hosts in Area D (Kiskatinaw Valley) utilize Firm or Strict policies, indicating a market where hosts prioritize booking security.
Recommendations for Hosts
- Consider adopting a Firm policy to align with the 44.4% market standard in Area D (Kiskatinaw Valley).
- Using a Strict policy might deter some guests, as only 11.1% of listings use it. Evaluate if potential revenue protection outweighs possible lower booking rates.
- Regularly review your cancellation policy against competitors and market demand shifts in Area D (Kiskatinaw Valley).
Area D (Kiskatinaw Valley) STR Booking Lead Time Analysis (2025)
Average Booking Lead Time by Month
Booking Lead Time Insights for Area D (Kiskatinaw Valley)
- The overall average booking lead time for vacation rentals in Area D (Kiskatinaw Valley) is 14 days.
- Guests book furthest in advance for stays during March (average 54 days), likely coinciding with peak travel demand or local events.
- The shortest booking windows occur for stays in November (average 2 days), indicating more last-minute travel plans during this time.
- Seasonally, Spring (36 days avg.) sees the longest lead times, while Fall (8 days avg.) has the shortest, reflecting typical travel planning cycles.
Recommendations for Hosts
- Use the overall average lead time (14 days) as a baseline for your pricing and availability strategy in Area D (Kiskatinaw Valley).
- For March stays, consider implementing length-of-stay discounts or slightly higher rates for bookings made less than 54 days out to capitalize on advance planning.
- During November, focus on last-minute booking availability and promotions, as guests book with very short notice (2 days avg.).
- Target marketing efforts for the Spring season well in advance (at least 36 days) to capture early planners.
- Monitor your own booking lead times against these Area D (Kiskatinaw Valley) averages to identify opportunities for dynamic pricing adjustments.
Popular & Essential Airbnb Amenities in Area D (Kiskatinaw Valley) (2025)
Amenity data is currently unavailable for Area D (Kiskatinaw Valley).
Area D (Kiskatinaw Valley) Airbnb Guest Demographics & Profile Analysis (2025)
Guest Profile Summary for Area D (Kiskatinaw Valley)
- The typical guest profile for Airbnb in Area D (Kiskatinaw Valley) consists of primarily domestic travelers (96%), often arriving from nearby Calgary, typically belonging to the Post-2000s (Gen Z/Alpha) group (50%), primarily speaking English or French.
- Domestic travelers account for 95.8% of guests.
- Key international markets include Canada (95.8%) and United States (4.2%).
- Top languages spoken are English (68.4%) followed by French (10.5%).
- A significant demographic segment is the Post-2000s (Gen Z/Alpha) group, representing 50% of guests.
Recommendations for Hosts
- Target domestic marketing efforts towards travelers from Calgary and Kelowna.
- Tailor amenities and listing descriptions to appeal to the dominant Post-2000s (Gen Z/Alpha) demographic (e.g., highlight fast WiFi, smart home features, local guides).
- Highlight unique local experiences or amenities relevant to the primary guest profile.
- Consider seasonal promotions aligned with peak travel times for key origin markets.
Nearby Short-Term Rental Market Comparison
How does the Area D (Kiskatinaw Valley) Airbnb market stack up against its neighbors? Compare key performance metrics like average monthly revenue, ADR, and occupancy rates in surrounding areas to understand the broader regional STR landscape.
| Market | Active Properties | Monthly Revenue | Daily Rate | Avg. Occupancy |
|---|---|---|---|---|
| Dawson Creek | 28 | $1,172 | $87.56 | 54% |
| Fort St. John | 56 | $674 | $70.58 | 44% |
| Pouce Coupe | 11 | $412 | $67.69 | 38% |