Cache Creek, British Columbia Airbnb Market Data 2026: STR Report & Statistics
How much can you earn on Airbnb in Cache Creek, British Columbia? Based on AirROI's 2026 dataset (January 2025 – December 2025), the short answer is $4,678 per year — at a $96 nightly rate, 19.5% occupancy, and a N/A RevPAR.
With just 18 active listings, Cache Creek is a micro-market where selective demand that rewards strong listing quality and pricing strategy. Supply expanded 38.5% as revenue climbed even while nightly rates softened — occupancy gains are outrunning rate pressure. For hosts entering now, strengthening demand means there is still room to build a profitable listing.
Regulation is high and 78% of listings show active registration — compliance is the cost of entry. In a market this size, differentiated listings with strong reviews can capture outsized returns relative to the competition.

Table of Contents [hide] [show]
What Are the Key Airbnb Metrics in Cache Creek?
In Cache Creek, the headline Airbnb metrics are $4,678 in average annual revenue,19.5% occupancy, $96 ADR, and $0 in RevPAR, and guests book about 45 days in advance.
How Much Do Airbnb Hosts Earn Monthly in Cache Creek?
Understanding the monthly revenue variations for Airbnb listings in Cache Creek is key to maximizing your short term rental income potential. Seasonality significantly impacts earnings. Our analysis, based on data from the past 12 months, shows that the peak revenue month for STRs in Cache Creek is typically June, while February often presents the lowest earnings, highlighting opportunities for strategic pricing adjustments during shoulder and low seasons. Explore the typical Airbnb income in Cache Creek across different performance tiers:
- Best-in-class properties (Top 10%) achieve $1,433+ monthly, often utilizing dynamic pricing and superior guest experiences.
- Strong performing properties (Top 25%) earn $815 or more, indicating effective management and desirable locations/amenities.
- Typical properties (Median) generate around $448 per month, representing the average market performance.
- Entry-level properties (Bottom 25%) see earnings around $284, often with potential for optimization.
Average Monthly Airbnb Earnings Trend in Cache Creek
What Is the Monthly Airbnb Occupancy Rate in Cache Creek?
Maximize your bookings by understanding the Cache Creek STR occupancy trends. Seasonal demand shifts significantly influence how often properties are booked. Typically, Septembersees the highest demand (peak season occupancy), while December experiences the lowest (low season). Effective strategies, like adjusting minimum stays or offering promotions, can boost occupancy during slower periods. Here's how different property tiers perform in Cache Creek:
- Best-in-class properties (Top 10%) achieve 44%+ occupancy, indicating high desirability and potentially optimized availability.
- Strong performing properties (Top 25%) maintain 27% or higher occupancy, suggesting good market fit and guest satisfaction.
- Typical properties (Median) have an occupancy rate around 16%.
- Entry-level properties (Bottom 25%) average 10% occupancy, potentially facing higher vacancy.
Average Monthly Occupancy Rate Trend in Cache Creek
What Is the Average Airbnb Nightly Rate in Cache Creek?
Effective short term rental pricing strategy in Cache Creek involves understanding monthly ADR fluctuations. The Average Daily Rate (ADR) for Airbnb in Cache Creek typically peaks in June and dips lowest during December. Leveraging Airbnb dynamic pricing tools or strategies based on this seasonality can significantly boost revenue. Here's a look at the typical nightly rates achieved:
- Best-in-class properties (Top 10%) command rates of $117+ per night, often due to premium features or locations.
- Strong performing properties (Top 25%) achieve nightly rates of $103 or more.
- Typical properties (Median) charge around $94 per night.
- Entry-level properties (Bottom 25%) earn around $86 per night.
Average Daily Rate (ADR) Trend by Month in Cache Creek
What Is the RevPAR for Airbnb in Cache Creek?
RevPAR in Cache Creek is currently N/A. Because RevPAR combines nightly rates with realized occupancy, it is one of the cleanest ways to compare how efficiently listings turn demand into revenue across the market.
- Entry-level properties (Bottom 25%) see N/A RevPAR.
- Typical properties (Median) generate N/A RevPAR.
- Strong performers (Top 25%) earn N/A RevPAR.
- Best-in-class (Top 10%) achieve N/A RevPAR.
Average Monthly RevPAR Trend in Cache Creek
RevPAR Insights for Cache Creek
- RevPAR peaks in Jan and bottoms out in Jan, mirroring the broader seasonal demand pattern and suggesting opportunities for dynamic pricing.
Recommendations for Hosts
- Track your own RevPAR monthly against these Cache Creek benchmarks. If your RevPAR falls below the median of N/A, examine whether low occupancy or low ADR is the primary drag.
- Use RevPAR rather than revenue alone when comparing properties of different sizes — it normalizes for available nights and gives a more accurate picture of performance.
Get Live Cache Creek Market Intelligence 👇
Explore Real-time Analytics
When Is the Peak Season for Airbnb in Cache Creek?
Cache Creek's peak Airbnb season falls in June, September, July, while the softest stretch is February, March, December. Overall, the market shows highly seasonal trends requiring careful strategy, which should guide pricing, minimum stays, and cash-flow planning.
Peak Season (June, September, July)
- Revenue averages $862 per month
- Occupancy rates average 26.4%
- Daily rates average $101
Shoulder Season
- Revenue averages $622 per month
- Occupancy maintains around 20.7%
- Daily rates hold near $94
Low Season (February, March, December)
- Revenue drops to average $395 per month
- Occupancy decreases to average 14.6%
- Daily rates adjust to average $89
Seasonality Insights for Cache Creek
- Airbnb seasonality in Cache Creek is pronounced. Revenue swings sharply between peak and low months, which means pricing strategy, minimum-stay settings, and cash reserves all need to account for extended slower periods.
- During the high season, the absolute peak month showcases Cache Creek's highest earning potential, with monthly revenues climbing to $961, occupancy reaching 34.0%, and ADRs peaking at $106.
- Conversely, the slowest single month marks the market's lowest point — revenue may dip to $367, occupancy could drop to 14.0%, and ADRs may adjust to $87.
- Lower occupancy paired with meaningful seasonality means hosts in Cache Creek need to maximize every peak-season booking and seriously consider whether off-season pricing adjustments or minimum-stay changes can capture incremental revenue.
Seasonal Strategies for Maximizing Profit
- Peak Season: Maximize revenue through premium pricing. In a high-regulation market like Cache Creek, ensure your permit covers the number of nights you plan to book — some jurisdictions cap annual rental days.
- Low Season: Offer competitive pricing, extended-stay discounts, and flexible cancellation policies. Target off-season travelers like remote workers, budget-conscious guests, and travelers with flexible schedules.
- Shoulder Seasons: Implement dynamic pricing that bridges peak and low rates. Target weekend travelers, local events, and business visitors. Slightly more flexible terms than peak season can help maintain occupancy without deep discounting.
- In a highly seasonal market like Cache Creek, building a cash reserve during the top months is essential for covering fixed costs during the slow period. Automated pricing tools can help capture demand shifts in real time.
Do You Need a License for Airbnb in Cache Creek?
Yes, Cache Creek, British Columbia, Canada enforces high STR regulations and 78% of active listings show registration evidence — indicating that enforcement is active and compliance is a prerequisite for operating legally. Hosts entering this market should budget for permit fees, inspections, and potential occupancy tax obligations as part of their startup costs. Always verify the latest short-term rental regulations and Airbnb license requirements directly with local government authorities for Cache Creek to ensure full compliance before hosting.
(Source: AirROI data, 2026, based on 78% licensed listings)
What Are the Best Neighborhoods for Airbnb in Cache Creek?
With a compact short-term rental market, Cache Creek gives early-mover hosts an advantage in the right neighborhoods. The areas listed below are where guest demand and local attractions converge — a useful lens for investors evaluating whether to enter this market and where to position their listing.
| Neighborhood / Area | Why Host Here? (Target Guests & Appeal) | Key Attractions & Landmarks |
|---|---|---|
| Cache Creek Town Centre | The central area of Cache Creek with amenities, shops, and restaurants. A great location for travelers looking for convenience and access to local attractions. | Cache Creek Museum, Historic Cache Creek Cemetery, Thompson River, Cache Creek Golf Course, Visitor Information Centre |
| Bonaparte River | Offers beautiful natural scenery and outdoor activities. Perfect for those looking to enjoy fishing, camping, and hiking in a picturesque environment. | Bonaparte River, Fishing spots, Hiking trails, Bonaparte Provincial Park, Natural hot springs |
| Ashcroft | Nearby town that offers a historic charm and access to various outdoor recreational activities. Popular with travelers interested in nature and history. | Ashcroft Museum, Old Ashcroft Townsite, Thompson River Trails, Canyon View Park, Historical Sites |
| Scuitto Mountain | Ideal for outdoor enthusiasts, this area boasts excellent hiking and nature photography opportunities. Attracts adventure seekers and nature lovers. | Hiking Trails, Scenic Viewpoints, Wildlife Watching, Outdoor Camping, Nature Photography Spots |
| Goldpan Provincial Park | A natural paradise for campers and outdoor seekers. It attracts tourists looking for a serene getaway surrounded by nature. | Parks and Campgrounds, River Access, Scenic Trails, Wildlife Viewing, Picnic Areas |
| Highway 1 Scenic Drive | Attracts travelers for its stunning views and easy access to multiple attractions along the way. A great stop for road-trippers and tourists. | Scenic Stops, Viewpoints, Wildlife Observation, Photography Spots, Historical Markers |
| Tunkwa Provincial Park | A tranquil area that offers fishing, hiking, and camping opportunities. Ideal for those looking to escape into nature. | Lakes for Fishing, Hiking Trails, Wildlife Spotting, Picnic Areas, Camping Facilities |
| Thompson River | Known for its rafting and fishing opportunities, it draws adventure enthusiasts and those looking for water activities. | Rafting Adventures, Fishing spots, Scenic River Views, Wildlife |
Because Cache Creek has a high regulation profile, confirming that short-term rental permits are available in your target neighborhood is a critical first step before committing to a property purchase. Regulation can vary at the neighborhood or district level even within the same city.
What Types of Properties Are on Airbnb in Cache Creek?
Room Type Distribution
Property Type Distribution
Market Composition Insights for Cache Creek
- The Cache Creek Airbnb market composition is heavily skewed towards Private Room listings, which make up 100% of the 18 active rentals. This indicates strong guest preference for privacy and space.
- Looking at the property type distribution in Cache Creek, Hotel/Boutique properties are the most common (100%), reflecting the local real estate landscape.
- The presence of 100% Hotel/Boutique listings indicates integration with traditional hospitality.
Cache Creek Airbnb Room Capacity Analysis (2026): Bedroom Distribution
Distribution of Listings by Number of Bedrooms
Room Capacity Insights for Cache Creek
- The dominant room capacity in Cache Creek is 1 bedroom listings, making up 100% of the market. This suggests a strong demand for properties suitable for couples or solo travelers.
- With over half the market (100%) consisting of studios or 1-bedroom units, Cache Creek is particularly well-suited for individuals or couples.
Cache Creek Vacation Rental Guest Capacity Trends (2026)
Distribution of Listings by Guest Capacity
Guest Capacity Insights for Cache Creek
- The most common guest capacity trend in Cache Creek vacation rentals is listings accommodating 2 guests (77.8%). This suggests the primary traveler segment is likely couples or solo travelers.
- Properties designed for 2 guests and 4 guests dominate the Cache Creek STR market, accounting for 100.0% of listings.
- A significant 77.8% of listings cater specifically to 1-2 guests, highlighting strong demand from couples and solo travelers in Cache Creek.
- On average, properties in Cache Creek are equipped to host 2.4 guests.
What Amenities Do Airbnb Guests Expect in Cache Creek?
Amenity Prevalence
Amenity Insights for Cache Creek
- Essential amenities in Cache Creek that guests expect include: TV, Air conditioning, Fire extinguisher, Smoke alarm, Free parking on premises, Wifi. Lacking these (any) could significantly impact bookings.
- Popular amenities like Dedicated workspace, Carbon monoxide alarm, Heating are common but not universal. Offering these can provide a competitive edge.
Recommendations for Hosts
- Ensure your listing includes all essential amenities for Cache Creek: TV, Air conditioning, Fire extinguisher, Smoke alarm, Free parking on premises, Wifi.
- Consider adding popular differentiators like Dedicated workspace or Carbon monoxide alarm to increase appeal.
- Highlight unique or less common amenities you offer (e.g., hot tub, dedicated workspace, EV charger) in your listing description and photos.
- Regularly check competitor amenities in Cache Creek to stay competitive.
Dive Deeper: Advanced Cache Creek STR Market Data (2026)
Ready to unlock more insights? AirROI provides access to advanced metrics and comprehensive Airbnb data for Cache Creek. Explore detailed analytics beyond this report to refine your investment strategy, optimize pricing, and maximize your vacation rental profits.
Explore Advanced MetricsCache Creek Airbnb Guest Demographics & Profile Analysis (2026)
Guest Profile Summary for Cache Creek
- The typical guest profile for Airbnb in Cache Creek consists of primarily domestic travelers (70%), often arriving from nearby Prince George, typically belonging to the Post-2000s (Gen Z/Alpha) group (50%), primarily speaking English or French.
- Domestic travelers account for 70.0% of guests.
- Key international markets include Canada (70%) and United States (10%).
- Top languages spoken are English (64.9%) followed by French (7%).
- A significant demographic segment is the Post-2000s (Gen Z/Alpha) group, representing 50% of guests.
Recommendations for Hosts
- Target domestic marketing efforts towards travelers from Prince George and Vancouver.
- Tailor amenities and listing descriptions to appeal to the dominant Post-2000s (Gen Z/Alpha) demographic (e.g., highlight fast WiFi, smart home features, local guides).
- Highlight unique local experiences or amenities relevant to the primary guest profile.
- Consider seasonal promotions aligned with peak travel times for key origin markets.
Cache Creek Airbnb Booking Patterns (2026): Available vs. Booked Days
Available Days Distribution
Booked Days Distribution
Booking Pattern Insights for Cache Creek
- The most common availability pattern in Cache Creek falls within the 271-366 days range, representing 88.9% of listings. This suggests many properties have significant open periods on their calendars.
- Approximately 100.0% of listings show high availability (181+ days open annually), indicating potential for increased bookings or specific owner usage patterns.
- For booked days, the 31-90 days range is most frequent in Cache Creek (50%), reflecting common guest stay durations or potential owner blocking patterns.
How Far in Advance Do Guests Book Airbnb in Cache Creek?
Average Booking Lead Time by Month
Booking Lead Time Insights for Cache Creek
- The overall average booking lead time for vacation rentals in Cache Creek is 45 days.
- Guests book furthest in advance for stays during August (average 76 days), likely coinciding with peak travel demand or local events.
- The shortest booking windows occur for stays in December (average 3 days), indicating more last-minute travel plans during this time.
- Seasonally, Summer (65 days avg.) sees the longest lead times, while Winter (8 days avg.) has the shortest, reflecting typical travel planning cycles.
Recommendations for Hosts
- Use the overall average lead time (45 days) as a baseline for your pricing and availability strategy in Cache Creek.
- For August stays, consider implementing length-of-stay discounts or slightly higher rates for bookings made less than 76 days out to capitalize on advance planning.
- During December, focus on last-minute booking availability and promotions, as guests book with very short notice (3 days avg.).
- Target marketing efforts for the Summer season well in advance (at least 65 days) to capture early planners.
- Monitor your own booking lead times against these Cache Creek averages to identify opportunities for dynamic pricing adjustments.
Cache Creek Airbnb Minimum Stay Requirements Analysis
Distribution of Listings by Minimum Night Requirement
1 Night
16 listings
88.9% of total
7-29 Nights
1 listings
5.6% of total
30+ Nights
1 listings
5.6% of total
Key Insights
- The most prevalent minimum stay requirement in Cache Creek is 1 Night, adopted by 88.9% of listings. This highlights the market's preference for shorter, flexible bookings.
- A strong majority (88.9%) of the Cache Creek Airbnb data shows acceptance of very short stays (1-2 nights), indicating a dynamic, high-turnover market.
Recommendations
- Align with the market by considering a 1 Night minimum stay, as 88.9% of Cache Creek hosts use this setting.
- Explore offering discounts for stays of 30+ nights to attract the 5.6% of the market seeking extended stays.
- Adjust minimum nights based on seasonality – potentially shorter during low season and longer during peak demand periods in Cache Creek.
Cache Creek Airbnb Cancellation Policy Trends Analysis (2026)
Flexible
17 listings
100% of total
Cancellation Policy Insights for Cache Creek
- The prevailing Airbnb cancellation policy trend in Cache Creek is Flexible, used by 100% of listings.
- The market strongly favors guest-friendly terms, with 100.0% of listings offering Flexible or Moderate policies. This suggests guests in Cache Creek may expect booking flexibility.
Recommendations for Hosts
- Consider adopting a Flexible policy to align with the 100% market standard in Cache Creek.
- Given the high prevalence of Flexible policies (100%), offering this can enhance booking appeal, especially during shoulder seasons.
- Regularly review your cancellation policy against competitors and market demand shifts in Cache Creek.
What Do the Top Airbnb Listings in Cache Creek Look Like?
Benchmark your potential! Explore examples of top-performing Airbnb properties in Cache Creekbased on Trailing Twelve Month (TTM) revenue. Analyze their characteristics, revenue, occupancy rate, and ADR to understand what drives success in this market.
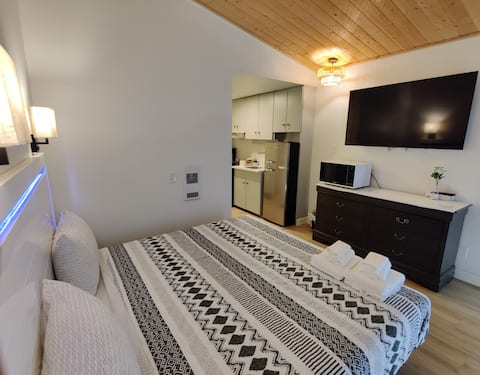
Deluxe Queen and King Suite
Private Room • 1 bedroom

Deluxe Queen Room
Private Room • 1 bedroom
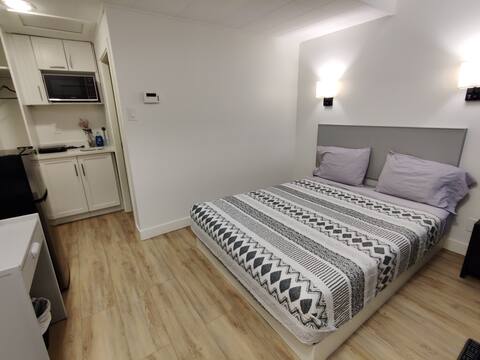
Standard Queen Suite
Private Room • 1 bedroom
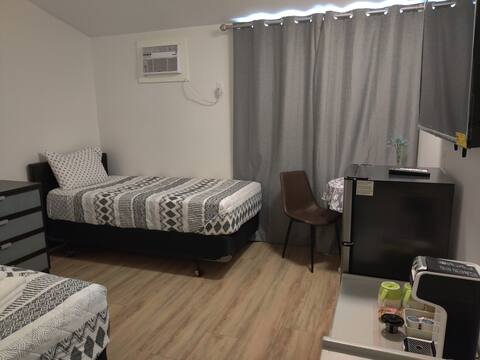
XL Twin Suite
Private Room • 1 bedroom

Standard Queen Room
Private Room • 1 bedroom

Kitchenette Queen Room
Private Room • 1 bedroom
Note: Performance varies based on location, size, amenities, seasonality, and management quality. Data reflects the past 12 months.
Who Are the Top Airbnb Hosts in Cache Creek?
Learn from the best! This table showcases top-performing Airbnb hosts in Cache Creek based on the number of properties managed and estimated total revenue over the past year. Analyze their scale and performance metrics.
| Host Name | Properties | Grossing Revenue | Stay Reviews | Avg Rating |
|---|---|---|---|---|
| Lance | 7 | $49,042 | 100 | 4.81/5.0 |
| Lance | 10 | $34,846 | 120 | 4.52/5.0 |
| Host #198112101 | 1 | $314 | 34 | 4.74/5.0 |
Analyzing the strategies of top hosts, such as their property selection, pricing, and guest communication, can offer valuable lessons for optimizing your own Airbnb operations in Cache Creek.
How Does Cache Creek's Airbnb Market Compare to Nearby Cities?
How does the Cache Creek Airbnb market stack up against its neighbors? Compare key performance metrics like average monthly revenue, ADR, and occupancy rates in surrounding areas to understand the broader regional STR landscape.
Compared with Langley Township, Cache Creek has 31 percentage points lower occupancy and about $246 lower ADR. That helps frame whether this market is winning more on demand, pricing, or both.
| Market | Active Properties | Monthly Revenue | Daily Rate | Avg. Occupancy |
|---|---|---|---|---|
| Whistler Resort Municipality | 2,199 | $4,302 | $382.97 | 45% |
| Whistler | 268 | $4,216 | $385.34 | 48% |
| Area C (Pemberton Valley/Mount Currie/D'Arcy) | 89 | $4,160 | $400.91 | 46% |
| Area C (Sasquatch Country) | 95 | $3,150 | $310.41 | 36% |
| Kent | 49 | $3,039 | $293.20 | 39% |
| Langley Township | 18 | $2,748 | $341.69 | 50% |
| Area B (South Fraser Canyon/Sunshine Valley) | 56 | $2,734 | $213.69 | 44% |
| Area M (Beautiful Nicola Valley - North) | 11 | $2,695 | $258.28 | 41% |
| Area H (Manning Park/Tulameen/Siwash) | 42 | $2,623 | $274.69 | 39% |
| Area P (Rivers and the Peaks) | 20 | $2,587 | $289.03 | 46% |
Frequently Asked Questions About Airbnb in Cache Creek
These quick answers summarize the most common investor and operator questions using AirROI's latest market data for Cache Creek.
How much do Airbnb hosts make in Cache Creek?
Cache Creek hosts earn about $4,678 per year on average, with an average nightly rate of $96 and RevPAR of N/A. Those figures describe the typical revenue environment for active listings in Cache Creek, British Columbia, not the ceiling for the best operators. Source: AirROI 2026 data, Cache Creek market, January 2025 to December 2025.
What is the average Airbnb occupancy rate in Cache Creek?
The average Airbnb occupancy rate in Cache Creek is 19.5%. June is the strongest month and February is the softest, so hosts should expect demand to move meaningfully throughout the year rather than stay flat.
What is the average Airbnb daily rate in Cache Creek?
Listings in Cache Creek average $96 per night. The broader pricing spread also matters: lower-performing listings cluster closer to the lower quartiles, while premium homes can price materially above the city average when demand spikes or listing quality stands out.
How many Airbnb listings are active in Cache Creek?
Cache Creek currently has about 18 active Airbnb listings in AirROI's market dataset. That supply count helps explain how competitive the market is, how much depth there is for benchmarking, and whether the market behaves like a niche destination or a scaled urban market.
How strict are short-term rental regulations in Cache Creek?
AirROI currently classifies the short-term rental regulation level in Cache Creek as High. The dataset also shows about 77.8% of listings with registration evidence. That is a market signal, not legal advice, so hosts should still confirm current licensing and compliance rules locally before listing.
What is the RevPAR for Airbnb in Cache Creek?
RevPAR in Cache Creek is about N/A. That metric combines pricing and occupancy into one efficiency number, so it is often a better quick benchmark than ADR alone when investors want to compare how well listings convert nightly rates into realized revenue.
Is Airbnb profitable in Cache Creek?
Occupancy of 19.5% means Cache Creek is a more selective market. Profitability is achievable but requires careful cost management, premium positioning, or targeting longer stays to reduce turnover. Average annual revenue is $4,678, but individual returns depend on property type, location within the city, and the host's operating efficiency.
How far in advance do guests book Airbnb in Cache Creek?
The average booking lead time in Cache Creek is about 45 days — a moderate lead time that gives hosts planning visibility while still benefiting from last-minute bookings. Hosts who understand their market's booking cadence can adjust minimum stays and pricing windows accordingly.
What are the best neighborhoods for Airbnb in Cache Creek?
Based on AirROI's analysis, some of the top neighborhoods for short-term rentals in Cache Creek include Cache Creek Town Centre, Bonaparte River, Ashcroft. Each area attracts different guest profiles — from business travelers to leisure visitors — so the best location depends on the property type and target audience a host is aiming for. See the full neighborhood breakdown above.
What type of property performs best on Airbnb in Cache Creek?
private_room listings make up 100.0% of the active supply in Cache Creek. The most common configuration does not always mean the most profitable — operators who identify underserved property types or bedroom counts can sometimes outperform the market average by filling a gap in local supply.
How does Cache Creek compare to nearby Airbnb markets?
Among neighboring markets, Whistler Resort Municipality posts $51,618 in average annual revenue with 44.6% occupancy, compared to Cache Creek's $4,678 and 19.5%. Comparing nearby markets helps investors understand whether a destination's performance reflects local demand or broader regional trends.
When is the peak season for Airbnb in Cache Creek?
June is the highest-revenue month in Cache Creek, while February is the softest. The revenue spread between them indicates a highly seasonal market — revenue in the peak month is more than double the low month, so cash-flow planning and pricing automation are critical.
About AirROI Market Data
AirROI tracks over 20 million properties across 190+ countries and maintains 15+ years of historical performance data, making it one of the deepest Airbnb and STR intelligence platforms available. The analytics pipeline aggregates listing-level data monthly — revenue, occupancy, nightly rates, RevPAR, guest demographics, booking patterns, and competitive supply — so investors and operators can benchmark any market against its own history and against neighboring destinations.
Real estate investors, property managers, financial institutions, hedge funds, tourism boards, hospitality consultants, tech platforms, and academic researchers rely on AirROI data to underwrite acquisitions, optimize pricing, model macro trends, and conduct peer-reviewed research. Data is available through in-depth market reports like this one and the Airbnb API with 22 endpoints and an Airbnb MCP Server for AI agents.
AirROI proprietary analytics as of 2025-12-31. Metrics reflect trailing twelve-month aggregates from active listings. Revenue figures are market averages, not projections. Neighborhood descriptions are AI-generated and reviewed for accuracy. For full methodology, see the data methodology page.