Richibucto Airbnb Market Analysis 2026: Short Term Rental Data & Vacation Rental Statistics in New Brunswick, Canada
Is Airbnb profitable in Richibucto in 2026? Explore comprehensive Airbnb analytics for Richibucto, New Brunswick, Canada to uncover income potential. This 2026 STR market report for Richibucto, based on AirROI data from February 2025 to January 2026, reveals key trends in the niche market of 20 active listings.
Whether you're considering an Airbnb investment in Richibucto, optimizing your existing vacation rental, or exploring rental arbitrage opportunities, understanding the Richibucto Airbnb data is crucial. Leveraging the low regulation environment is key to maximizing your short term rental income potential. Let's dive into the specifics.
Key Richibucto Airbnb Performance Metrics Overview
Monthly Airbnb Revenue Variations & Income Potential in Richibucto (2026)
Understanding the monthly revenue variations for Airbnb listings in Richibucto is key to maximizing your short term rental income potential. Seasonality significantly impacts earnings. Our analysis, based on data from the past 12 months, shows that the peak revenue month for STRs in Richibucto is typically August, while March often presents the lowest earnings, highlighting opportunities for strategic pricing adjustments during shoulder and low seasons. Explore the typical Airbnb income in Richibucto across different performance tiers:
- Best-in-class properties (Top 10%) achieve $6,119+ monthly, often utilizing dynamic pricing and superior guest experiences.
- Strong performing properties (Top 25%) earn $3,667 or more, indicating effective management and desirable locations/amenities.
- Typical properties (Median) generate around $2,511 per month, representing the average market performance.
- Entry-level properties (Bottom 25%) see earnings around $1,707, often with potential for optimization.
Average Monthly Airbnb Earnings Trend in Richibucto
Richibucto Airbnb Occupancy Rate Trends (2026)
Maximize your bookings by understanding the Richibucto STR occupancy trends. Seasonal demand shifts significantly influence how often properties are booked. Typically, Augustsees the highest demand (peak season occupancy), while November experiences the lowest (low season). Effective strategies, like adjusting minimum stays or offering promotions, can boost occupancy during slower periods. Here's how different property tiers perform in Richibucto:
- Best-in-class properties (Top 10%) achieve 62%+ occupancy, indicating high desirability and potentially optimized availability.
- Strong performing properties (Top 25%) maintain 54% or higher occupancy, suggesting good market fit and guest satisfaction.
- Typical properties (Median) have an occupancy rate around 44%.
- Entry-level properties (Bottom 25%) average 31% occupancy, potentially facing higher vacancy.
Average Monthly Occupancy Rate Trend in Richibucto
Average Daily Rate (ADR) Airbnb Trends in Richibucto (2026)
Effective short term rental pricing strategy in Richibucto involves understanding monthly ADR fluctuations. The Average Daily Rate (ADR) for Airbnb in Richibucto typically peaks in August and dips lowest during April. Leveraging Airbnb dynamic pricing tools or strategies based on this seasonality can significantly boost revenue. Here's a look at the typical nightly rates achieved:
- Best-in-class properties (Top 10%) command rates of $287+ per night, often due to premium features or locations.
- Strong performing properties (Top 25%) achieve nightly rates of $226 or more.
- Typical properties (Median) charge around $189 per night.
- Entry-level properties (Bottom 25%) earn around $171 per night.
Average Daily Rate (ADR) Trend by Month in Richibucto
Get Live Richibucto Market Intelligence 👇

Explore Real-time Analytics
Airbnb Seasonality Analysis & Trends in Richibucto (2026)
Peak Season (August, July, June)
- Revenue averages $5,184 per month
- Occupancy rates average 74.9%
- Daily rates average $216
Shoulder Season
- Revenue averages $2,557 per month
- Occupancy maintains around 36.7%
- Daily rates hold near $203
Low Season (March, April, November)
- Revenue drops to average $1,307 per month
- Occupancy decreases to average 23.3%
- Daily rates adjust to average $191
Seasonality Insights for Richibucto
- The Airbnb seasonality in Richibucto shows highly seasonal trends requiring careful strategy. While the sections above show seasonal averages, it's also insightful to look at the extremes:
- During the high season, the absolute peak month showcases Richibucto's highest earning potential, with monthly revenues capable of climbing to $6,025, occupancy reaching a high of 87.4%, and ADRs peaking at $222.
- Conversely, the slowest single month of the year, typically falling within the low season, marks the market's lowest point. In this month, revenue might dip to $1,088, occupancy could drop to 20.7%, and ADRs may adjust down to $183.
- Understanding both the seasonal averages and these monthly peaks and troughs in revenue, occupancy, and ADR is crucial for maximizing your Airbnb profit potential in Richibucto.
Seasonal Strategies for Maximizing Profit
- Peak Season: Maximize revenue through premium pricing and potentially longer minimum stays. Ensure high availability.
- Low Season: Offer competitive pricing, special promotions (e.g., extended stay discounts), and flexible cancellation policies. Target off-season travelers like remote workers or budget-conscious guests.
- Shoulder Seasons: Implement dynamic pricing that balances peak and low rates. Target weekend travelers or specific events. Offer slightly more flexible terms than peak season.
- Regularly analyze your own performance against these Richibucto seasonality benchmarks and adjust your pricing and availability strategy accordingly.
Best Areas for Airbnb Investment in Richibucto (2026)
Exploring the top neighborhoods for short-term rentals in Richibucto? This section highlights key areas, outlining why they are attractive for hosts and guests, along with notable local attractions. Consider these locations based on your target guest profile and investment strategy.
| Neighborhood / Area | Why Host Here? (Target Guests & Appeal) | Key Attractions & Landmarks |
|---|---|---|
| Richibucto River | A scenic area along the Richibucto River, popular for outdoor activities like kayaking and fishing. Ideal for nature lovers and families seeking tranquility and adventure. | Richibucto River, Rural views, Kayaking opportunities, Fishing spots |
| Kouchibouguac National Park | A stunning national park featuring diverse ecosystems, beaches, and hiking trails. Attracts eco-tourists and families looking for a natural escape. | Kouchibouguac National Park, Walking and biking trails, Beach access, Wildlife viewing, Interpretive center |
| Acadian Village | A culturally rich area celebrating Acadian heritage with historical sites and local events. Appeals to travelers interested in culture and history. | Acadian Museum, Heritage sites, Cultural festivals, Local cuisine |
| Cocagne | A small coastal community offering beautiful beaches and a relaxed atmosphere. Perfect for couples and families looking for seaside relaxation. | Cocagne Beach, Marina, Seaside dining, Local art galleries |
| Bouctouche | A picturesque coastal village known for its beautiful beaches and the famous Irving Eco-Centre. Great for families and nature enthusiasts. | Bouctouche Dunes, Irving Eco-Centre, Beaches, Boardwalks, Local shops |
| Memramcook | Rich in history and Acadian culture, this area offers charming landscapes and historic sites, appealing to those interested in heritage tourism. | Memramcook Valley, Historic sites, Cultural events, Nature trails |
| Shediac | Known as the Lobster Capital of the World, this vibrant town is famous for its beaches and seafood, drawing food lovers and beach-goers alike. | Parlee Beach, Giant Lobster, Shediac Bay, Local seafood restaurants |
| Cap-Pele | A lively coastal community celebrated for its seafood and beautiful beaches, popular among tourists seeking leisure and relaxation. | Cap-Pele Beach, Marine Parks, Local seafood markets, Cultural festivals |
Understanding Airbnb License Requirements & STR Laws in Richibucto (2026)
While Richibucto, New Brunswick, Canada currently shows low STR regulations, specific Airbnb license requirements might still exist or change. Always verify the latest short term rental regulations and Airbnb license requirements directly with local government authorities for Richibucto to ensure full compliance before hosting.
(Source: AirROI data, 2026, finding no licensed listings among those analyzed)
Top Performing Airbnb Properties in Richibucto (2026)
Benchmark your potential! Explore examples of top-performing Airbnb properties in Richibuctobased on Trailing Twelve Month (TTM) revenue. Analyze their characteristics, revenue, occupancy rate, and ADR to understand what drives success in this market.

Stillwater Villa - Richibucto River
Entire Place • 7 bedrooms
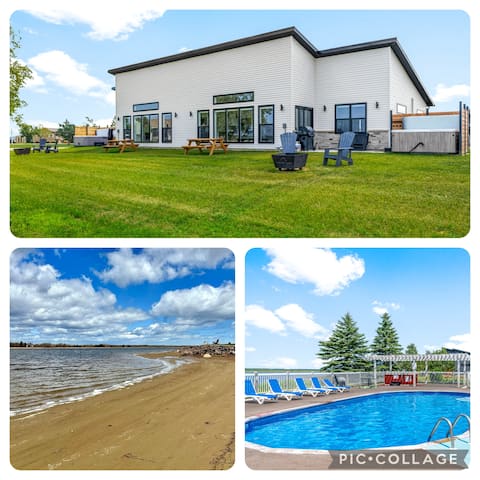
Beachfront Luxury Home with Pool & Hot Tub Tub 97
Entire Place • 2 bedrooms

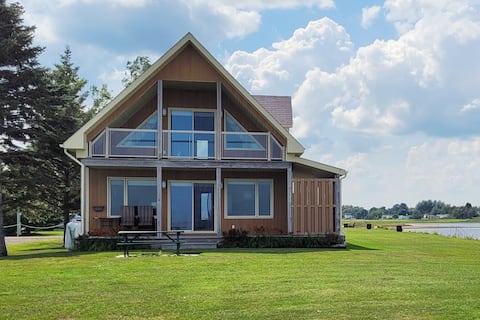
Cozy waterfront cottage
Entire Place • 3 bedrooms

Beachfront Luxury Home with Pool & Hot Tub 99
Entire Place • 2 bedrooms

Beachfront Luxury Home with Pool & Hot Tub 91
Entire Place • 2 bedrooms
Bird's Eye View Beachfront, Jacuzzi Tub, Natl Park
Entire Place • 3 bedrooms
Note: Performance varies based on location, size, amenities, seasonality, and management quality. Data reflects the past 12 months.
Top Performing Airbnb Hosts in Richibucto (2026)
Learn from the best! This table showcases top-performing Airbnb hosts in Richibucto based on the number of properties managed and estimated total revenue over the past year. Analyze their scale and performance metrics.
| Host Name | Properties | Grossing Revenue | Stay Reviews | Avg Rating |
|---|---|---|---|---|
| Étienne | 9 | $207,309 | 417 | 4.92/5.0 |
| Marissa | 4 | $149,689 | 302 | 4.93/5.0 |
| Jamie | 1 | $57,811 | 51 | 5.00/5.0 |
| Charline | 1 | $38,719 | 6 | 5.00/5.0 |
| Janick | 1 | $23,102 | 52 | 5.00/5.0 |
| Zackary | 1 | $21,527 | 30 | 4.80/5.0 |
| Sylvain | 1 | $18,163 | 264 | 4.93/5.0 |
| Emery | 2 | $14,428 | 33 | 4.95/5.0 |
Analyzing the strategies of top hosts, such as their property selection, pricing, and guest communication, can offer valuable lessons for optimizing your own Airbnb operations in Richibucto.
Dive Deeper: Advanced Richibucto STR Market Data (2026)
Ready to unlock more insights? AirROI provides access to advanced metrics and comprehensive Airbnb data for Richibucto. Explore detailed analytics beyond this report to refine your investment strategy, optimize pricing, and maximize your vacation rental profits.
Explore Advanced MetricsRichibucto Short-Term Rental Market Composition (2026): Property & Room Types
Room Type Distribution
Property Type Distribution
Market Composition Insights for Richibucto
- The Richibucto Airbnb market composition is heavily skewed towards Entire Home/Apt listings, which make up 100% of the 20 active rentals. This indicates strong guest preference for privacy and space.
- Looking at the property type distribution in Richibucto, House properties are the most common (90%), reflecting the local real estate landscape.
- Houses represent a significant 90% portion, catering likely to families or larger groups.
Richibucto Airbnb Room Capacity Analysis (2026): Bedroom Distribution
Distribution of Listings by Number of Bedrooms
Room Capacity Insights for Richibucto
- The dominant room capacity in Richibucto is 2 bedrooms listings, making up 70% of the market. This suggests a strong demand for properties suitable for couples or solo travelers.
- Together, 2 bedrooms and 3 bedrooms properties represent 85.0% of the active Airbnb listings in Richibucto, indicating a high concentration in these sizes.
Richibucto Vacation Rental Guest Capacity Trends (2026)
Distribution of Listings by Guest Capacity
Guest Capacity Insights for Richibucto
- The most common guest capacity trend in Richibucto vacation rentals is listings accommodating 6 guests (40%). This suggests the primary traveler segment is likely larger groups.
- Properties designed for 6 guests and 8+ guests dominate the Richibucto STR market, accounting for 65.0% of listings.
- 80.0% of properties accommodate 6+ guests, serving the market segment for larger families or group travel in Richibucto.
- On average, properties in Richibucto are equipped to host 6.4 guests.
Richibucto Airbnb Booking Patterns (2026): Available vs. Booked Days
Available Days Distribution
Booked Days Distribution
Booking Pattern Insights for Richibucto
- The most common availability pattern in Richibucto falls within the 181-270 days range, representing 80% of listings. This suggests many properties have significant open periods on their calendars.
- Approximately 100.0% of listings show high availability (181+ days open annually), indicating potential for increased bookings or specific owner usage patterns.
- For booked days, the 91-180 days range is most frequent in Richibucto (80%), reflecting common guest stay durations or potential owner blocking patterns.
Richibucto Airbnb Minimum Stay Requirements Analysis
Distribution of Listings by Minimum Night Requirement
2 Nights
2 listings
10% of total
3 Nights
2 listings
10% of total
4-6 Nights
1 listings
5% of total
30+ Nights
15 listings
75% of total
Key Insights
- The most prevalent minimum stay requirement in Richibucto is 30+ Nights, adopted by 75% of listings. This highlights the market's preference for longer commitments.
- Very short stays (1-2 nights) are less common (10.0%), suggesting hosts prefer slightly longer bookings to optimize turnover.
- A significant segment (75%) caters to monthly stays (30+ nights) in Richibucto, pointing to opportunities in the extended-stay market.
Recommendations
- Align with the market by considering a 30+ Nights minimum stay, as 75% of Richibucto hosts use this setting.
- Explore offering discounts for stays of 30+ nights to attract the 75% of the market seeking extended stays.
- Adjust minimum nights based on seasonality – potentially shorter during low season and longer during peak demand periods in Richibucto.
Richibucto Airbnb Cancellation Policy Trends Analysis (2026)
Super Strict 30 Days
6 listings
30% of total
Limited
2 listings
10% of total
Flexible
2 listings
10% of total
Moderate
2 listings
10% of total
Firm
8 listings
40% of total
Cancellation Policy Insights for Richibucto
- The prevailing Airbnb cancellation policy trend in Richibucto is Firm, used by 40% of listings.
- There's a relatively balanced mix between guest-friendly (20.0%) and stricter (40.0%) policies, offering choices for different guest needs.
Recommendations for Hosts
- Consider adopting a Firm policy to align with the 40% market standard in Richibucto.
- Regularly review your cancellation policy against competitors and market demand shifts in Richibucto.
Richibucto STR Booking Lead Time Analysis (2026)
Average Booking Lead Time by Month
Booking Lead Time Insights for Richibucto
- The overall average booking lead time for vacation rentals in Richibucto is 76 days.
- Guests book furthest in advance for stays during May (average 129 days), likely coinciding with peak travel demand or local events.
- The shortest booking windows occur for stays in October (average 8 days), indicating more last-minute travel plans during this time.
- Seasonally, Summer (98 days avg.) sees the longest lead times, while Fall (16 days avg.) has the shortest, reflecting typical travel planning cycles.
Recommendations for Hosts
- Use the overall average lead time (76 days) as a baseline for your pricing and availability strategy in Richibucto.
- For May stays, consider implementing length-of-stay discounts or slightly higher rates for bookings made less than 129 days out to capitalize on advance planning.
- During October, focus on last-minute booking availability and promotions, as guests book with very short notice (8 days avg.).
- Target marketing efforts for the Summer season well in advance (at least 98 days) to capture early planners.
- Monitor your own booking lead times against these Richibucto averages to identify opportunities for dynamic pricing adjustments.
Popular & Essential Airbnb Amenities in Richibucto (2026)
Amenity Prevalence
No amenities with partial availability (less than 100%) were found to display in the chart. All essential amenities might be present in all listings. Check insights below.
Amenity Insights for Richibucto
- Essential amenities in Richibucto that guests expect include: Essentials, Hot water, Stove, Fire pit, TV, Microwave, Oven, Wifi, Bed linens, Cooking basics. Lacking these (any) could significantly impact bookings.
Recommendations for Hosts
- Ensure your listing includes all essential amenities for Richibucto: Essentials, Hot water, Stove, Fire pit, TV, Microwave, Oven, Wifi, Bed linens, Cooking basics.
- Highlight unique or less common amenities you offer (e.g., hot tub, dedicated workspace, EV charger) in your listing description and photos.
- Regularly check competitor amenities in Richibucto to stay competitive.
Richibucto Airbnb Guest Demographics & Profile Analysis (2026)
Guest Profile Summary for Richibucto
- The typical guest profile for Airbnb in Richibucto consists of primarily domestic travelers (93%), often arriving from nearby Montreal, typically belonging to the Post-2000s (Gen Z/Alpha) group (50%), primarily speaking English or French.
- Domestic travelers account for 93.1% of guests.
- Key international markets include Canada (93.1%) and United States (2.3%).
- Top languages spoken are English (58%) followed by French (32.1%).
- A significant demographic segment is the Post-2000s (Gen Z/Alpha) group, representing 50% of guests.
Recommendations for Hosts
- Target domestic marketing efforts towards travelers from Montreal and Fredericton.
- Tailor amenities and listing descriptions to appeal to the dominant Post-2000s (Gen Z/Alpha) demographic (e.g., highlight fast WiFi, smart home features, local guides).
- Highlight unique local experiences or amenities relevant to the primary guest profile.
- Consider seasonal promotions aligned with peak travel times for key origin markets.
Nearby Short-Term Rental Market Comparison
How does the Richibucto Airbnb market stack up against its neighbors? Compare key performance metrics like average monthly revenue, ADR, and occupancy rates in surrounding areas to understand the broader regional STR landscape.
| Market | Active Properties | Monthly Revenue | Daily Rate | Avg. Occupancy |
|---|---|---|---|---|
| Granville | 14 | $2,725 | $318.37 | 52% |
| Augustine Cove | 24 | $2,684 | $239.39 | 55% |
| Halls Harbour | 15 | $2,559 | $211.80 | 52% |
| Wentworth | 20 | $2,494 | $255.19 | 40% |
| Hillsborough | 11 | $2,478 | $153.01 | 55% |
| Port Williams | 17 | $2,452 | $260.67 | 47% |
| Bayhead | 12 | $2,397 | $250.71 | 48% |
| Kings County | 10 | $2,374 | $180.79 | 56% |
| Oyster Bed Bridge | 12 | $2,302 | $187.23 | 60% |
| Cape Traverse | 22 | $2,288 | $298.91 | 42% |