Bay Roberts Airbnb Market Analysis 2026: Short Term Rental Data & Vacation Rental Statistics in Newfoundland and Labrador, Canada
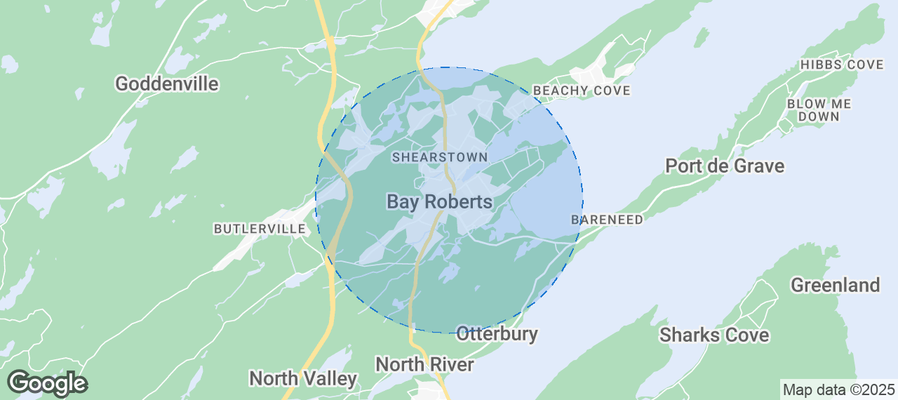
Is Airbnb profitable in Bay Roberts in 2026? Explore comprehensive Airbnb analytics for Bay Roberts, Newfoundland and Labrador, Canada to uncover income potential. This 2026 STR market report for Bay Roberts, based on AirROI data from February 2025 to January 2026, reveals key trends in the niche market of 18 active listings.
Whether you're considering an Airbnb investment in Bay Roberts, optimizing your existing vacation rental, or exploring rental arbitrage opportunities, understanding the Bay Roberts Airbnb data is crucial. Navigating the high regulation landscape is key to maximizing your short term rental income potential. Let's dive into the specifics.
Key Bay Roberts Airbnb Performance Metrics Overview
Monthly Airbnb Revenue Variations & Income Potential in Bay Roberts (2026)
Understanding the monthly revenue variations for Airbnb listings in Bay Roberts is key to maximizing your short term rental income potential. Seasonality significantly impacts earnings. Our analysis, based on data from the past 12 months, shows that the peak revenue month for STRs in Bay Roberts is typically August, while February often presents the lowest earnings, highlighting opportunities for strategic pricing adjustments during shoulder and low seasons. Explore the typical Airbnb income in Bay Roberts across different performance tiers:
- Best-in-class properties (Top 10%) achieve $3,589+ monthly, often utilizing dynamic pricing and superior guest experiences.
- Strong performing properties (Top 25%) earn $2,665 or more, indicating effective management and desirable locations/amenities.
- Typical properties (Median) generate around $1,650 per month, representing the average market performance.
- Entry-level properties (Bottom 25%) see earnings around $901, often with potential for optimization.
Average Monthly Airbnb Earnings Trend in Bay Roberts
Bay Roberts Airbnb Occupancy Rate Trends (2026)
Maximize your bookings by understanding the Bay Roberts STR occupancy trends. Seasonal demand shifts significantly influence how often properties are booked. Typically, Augustsees the highest demand (peak season occupancy), while February experiences the lowest (low season). Effective strategies, like adjusting minimum stays or offering promotions, can boost occupancy during slower periods. Here's how different property tiers perform in Bay Roberts:
- Best-in-class properties (Top 10%) achieve 71%+ occupancy, indicating high desirability and potentially optimized availability.
- Strong performing properties (Top 25%) maintain 57% or higher occupancy, suggesting good market fit and guest satisfaction.
- Typical properties (Median) have an occupancy rate around 38%.
- Entry-level properties (Bottom 25%) average 21% occupancy, potentially facing higher vacancy.
Average Monthly Occupancy Rate Trend in Bay Roberts
Average Daily Rate (ADR) Airbnb Trends in Bay Roberts (2026)
Effective short term rental pricing strategy in Bay Roberts involves understanding monthly ADR fluctuations. The Average Daily Rate (ADR) for Airbnb in Bay Roberts typically peaks in October and dips lowest during March. Leveraging Airbnb dynamic pricing tools or strategies based on this seasonality can significantly boost revenue. Here's a look at the typical nightly rates achieved:
- Best-in-class properties (Top 10%) command rates of $190+ per night, often due to premium features or locations.
- Strong performing properties (Top 25%) achieve nightly rates of $171 or more.
- Typical properties (Median) charge around $134 per night.
- Entry-level properties (Bottom 25%) earn around $112 per night.
Average Daily Rate (ADR) Trend by Month in Bay Roberts
Get Live Bay Roberts Market Intelligence 👇
Explore Real-time Analytics
Airbnb Seasonality Analysis & Trends in Bay Roberts (2026)
Peak Season (August, July, September)
- Revenue averages $2,881 per month
- Occupancy rates average 60.2%
- Daily rates average $146
Shoulder Season
- Revenue averages $1,796 per month
- Occupancy maintains around 38.5%
- Daily rates hold near $143
Low Season (January, February, March)
- Revenue drops to average $1,098 per month
- Occupancy decreases to average 26.4%
- Daily rates adjust to average $134
Seasonality Insights for Bay Roberts
- The Airbnb seasonality in Bay Roberts shows highly seasonal trends requiring careful strategy. While the sections above show seasonal averages, it's also insightful to look at the extremes:
- During the high season, the absolute peak month showcases Bay Roberts's highest earning potential, with monthly revenues capable of climbing to $3,266, occupancy reaching a high of 67.5%, and ADRs peaking at $157.
- Conversely, the slowest single month of the year, typically falling within the low season, marks the market's lowest point. In this month, revenue might dip to $809, occupancy could drop to 19.9%, and ADRs may adjust down to $125.
- Understanding both the seasonal averages and these monthly peaks and troughs in revenue, occupancy, and ADR is crucial for maximizing your Airbnb profit potential in Bay Roberts.
Seasonal Strategies for Maximizing Profit
- Peak Season: Maximize revenue through premium pricing and potentially longer minimum stays. Ensure high availability.
- Low Season: Offer competitive pricing, special promotions (e.g., extended stay discounts), and flexible cancellation policies. Target off-season travelers like remote workers or budget-conscious guests.
- Shoulder Seasons: Implement dynamic pricing that balances peak and low rates. Target weekend travelers or specific events. Offer slightly more flexible terms than peak season.
- Regularly analyze your own performance against these Bay Roberts seasonality benchmarks and adjust your pricing and availability strategy accordingly.
Best Areas for Airbnb Investment in Bay Roberts (2026)
Exploring the top neighborhoods for short-term rentals in Bay Roberts? This section highlights key areas, outlining why they are attractive for hosts and guests, along with notable local attractions. Consider these locations based on your target guest profile and investment strategy.
| Neighborhood / Area | Why Host Here? (Target Guests & Appeal) | Key Attractions & Landmarks |
|---|---|---|
| Bay Roberts Harbour | A picturesque harbour area that attracts visitors looking for scenic views and recreational activities. It's ideal for tourists interested in boating and fishing, making it a prime Airbnb location. | Bay Roberts Marina, The Kinsmen Centre, Historic Town of Cupids, Bowring Park, Silver Sands Beach |
| Manuels | Known for its historic charm and beautiful landscapes, Manuels is a growing community that attracts families and tourists seeking a quiet getaway. It's close to hiking trails and parks. | Manuels River Interpretation Centre, The Trails at Manuels River, Manuels River Ecological Reserve, Rugged coastal trails, Local dining options |
| Bishop's Cove | A small, serene cove that offers spectacular views of the ocean and nearby islands. It's perfect for travelers looking for a quiet retreat and nature experiences. | Bishop's Cove Beach, Scenic viewpoints, Walking trails by the coast, Wildlife viewing opportunities, Local nature parks |
| Cupids | Famous for its rich history as one of the oldest English settlements in Canada, Cupids attracts history buffs and those interested in cultural tourism. Unique heritage experiences available. | Cupids Legacy Centre, Historic sites and walking tours, Cupids beach, Local artisan shops, Cultural events |
| Goulds | Nestled near St. John's, Goulds provides a suburban feel with access to nature trails and parks. It's suitable for families and those wanting to explore nearby cities. | Pine Brook Park, Local shopping and dining, Access to hiking trails, Community events, Cultural festivals |
| Harbour Grace | A town rich in maritime history and beautiful waterfront views. It attracts those interested in history and local culture, making it an inviting spot for Airbnb guests. | Harbour Grace Archaeological Site, Historic buildings, The Railway Station Museum, Parks along the waterfront, Cultural landmarks |
| Clarke's Beach | A quaint beach community known for its summer activities and family-friendly atmosphere. Ideal for those looking to enjoy beachside vacations. | Clarke's Beach, Local seafood dining, Summer festivals, Beach activities, Scenic boardwalk |
| Victoria | A rural community with stunning landscapes, offering peace and tranquility. Perfect for guests wanting to escape the city and enjoy outdoor adventures. | Victoria Park, Hiking trails, Local farm markets, Scenic viewpoints, Wildlife watching |
Understanding Airbnb License Requirements & STR Laws in Bay Roberts (2026)
Yes, Bay Roberts, Newfoundland and Labrador, Canada enforces high STR regulations. Obtaining a license and ensuring compliance is almost certainly required according to current 2026 STR laws. Always verify the latest short term rental regulations and Airbnb license requirements directly with local government authorities for Bay Roberts to ensure full compliance before hosting.
(Source: AirROI data, 2026, based on 56% licensed listings)
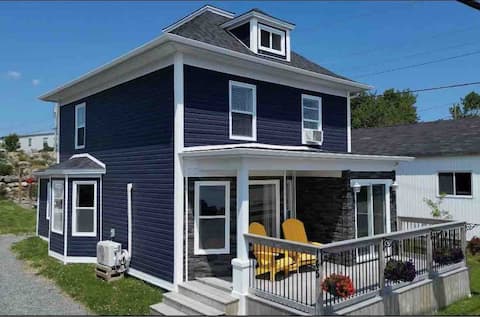
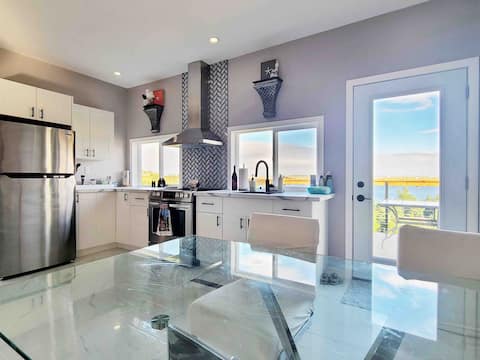
Top Performing Airbnb Properties in Bay Roberts (2026)
Benchmark your potential! Explore examples of top-performing Airbnb properties in Bay Robertsbased on Trailing Twelve Month (TTM) revenue. Analyze their characteristics, revenue, occupancy rate, and ADR to understand what drives success in this market.
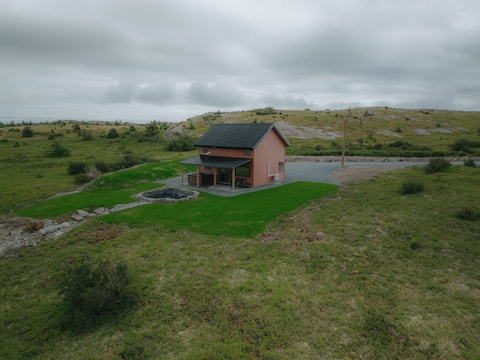
Unique Coastal Getaway
Entire Place • 2 bedrooms
The Salty Moose Retreat on Water
Entire Place • 3 bedrooms
Mad Rock Retreat
Entire Place • 2 bedrooms
1919 Fishermans Cottage Bay Roberts Lost Together
Entire Place • 3 bedrooms
Miss Rosie's Escape - entire house, self check-in
Entire Place • 3 bedrooms

Madrock Hideaway Haven /Hot Tub !
Entire Place • 2 bedrooms
Note: Performance varies based on location, size, amenities, seasonality, and management quality. Data reflects the past 12 months.
Top Performing Airbnb Hosts in Bay Roberts (2026)
Learn from the best! This table showcases top-performing Airbnb hosts in Bay Roberts based on the number of properties managed and estimated total revenue over the past year. Analyze their scale and performance metrics.
| Host Name | Properties | Grossing Revenue | Stay Reviews | Avg Rating |
|---|---|---|---|---|
| Brandon | 1 | $45,711 | 248 | 4.84/5.0 |
| Kerri Barker | 1 | $38,932 | 211 | 4.98/5.0 |
| Dorrie | 1 | $29,145 | 199 | 4.94/5.0 |
| Danielle | 1 | $28,068 | 68 | 4.82/5.0 |
| Harvey | 2 | $27,371 | 94 | 4.96/5.0 |
| Deb | 1 | $24,310 | 89 | 4.98/5.0 |
| Bernadette | 1 | $20,034 | 114 | 4.74/5.0 |
| Loretta | 1 | $17,194 | 48 | 4.83/5.0 |
| Krista | 1 | $16,666 | 44 | 4.95/5.0 |
| Suzanne | 1 | $14,879 | 37 | 4.89/5.0 |
Analyzing the strategies of top hosts, such as their property selection, pricing, and guest communication, can offer valuable lessons for optimizing your own Airbnb operations in Bay Roberts.
Dive Deeper: Advanced Bay Roberts STR Market Data (2026)
Ready to unlock more insights? AirROI provides access to advanced metrics and comprehensive Airbnb data for Bay Roberts. Explore detailed analytics beyond this report to refine your investment strategy, optimize pricing, and maximize your vacation rental profits.
Explore Advanced MetricsBay Roberts Short-Term Rental Market Composition (2026): Property & Room Types
Room Type Distribution
Property Type Distribution
Market Composition Insights for Bay Roberts
- The Bay Roberts Airbnb market composition is heavily skewed towards Entire Home/Apt listings, which make up 100% of the 18 active rentals. This indicates strong guest preference for privacy and space.
- Looking at the property type distribution in Bay Roberts, House properties are the most common (88.9%), reflecting the local real estate landscape.
- Houses represent a significant 88.9% portion, catering likely to families or larger groups.
Bay Roberts Airbnb Room Capacity Analysis (2026): Bedroom Distribution
Distribution of Listings by Number of Bedrooms
Room Capacity Insights for Bay Roberts
- The dominant room capacity in Bay Roberts is 3 bedrooms listings, making up 44.4% of the market. This suggests a strong demand for properties suitable for families or small groups.
- Together, 3 bedrooms and 2 bedrooms properties represent 83.3% of the active Airbnb listings in Bay Roberts, indicating a high concentration in these sizes.
- A significant 50.0% of listings offer 3+ bedrooms, catering to larger groups and families seeking more space in Bay Roberts.
Bay Roberts Vacation Rental Guest Capacity Trends (2026)
Distribution of Listings by Guest Capacity
Guest Capacity Insights for Bay Roberts
- The most common guest capacity trend in Bay Roberts vacation rentals is listings accommodating 6 guests (44.4%). This suggests the primary traveler segment is likely larger groups.
- Properties designed for 6 guests and 4 guests dominate the Bay Roberts STR market, accounting for 66.6% of listings.
- 55.5% of properties accommodate 6+ guests, serving the market segment for larger families or group travel in Bay Roberts.
- On average, properties in Bay Roberts are equipped to host 5.4 guests.
Bay Roberts Airbnb Booking Patterns (2026): Available vs. Booked Days
Available Days Distribution
Booked Days Distribution
Booking Pattern Insights for Bay Roberts
- The most common availability pattern in Bay Roberts falls within the 181-270 days range, representing 38.9% of listings. This suggests many properties have significant open periods on their calendars.
- Approximately 77.8% of listings show high availability (181+ days open annually), indicating potential for increased bookings or specific owner usage patterns.
- For booked days, the 91-180 days range is most frequent in Bay Roberts (55.6%), reflecting common guest stay durations or potential owner blocking patterns.
- A notable 22.2% of properties secure long booking periods (181+ days booked per year), highlighting successful long-term rental strategies or significant owner usage.
Bay Roberts Airbnb Minimum Stay Requirements Analysis
Distribution of Listings by Minimum Night Requirement
1 Night
9 listings
50% of total
2 Nights
2 listings
11.1% of total
3 Nights
1 listings
5.6% of total
30+ Nights
6 listings
33.3% of total
Key Insights
- The most prevalent minimum stay requirement in Bay Roberts is 1 Night, adopted by 50% of listings. This highlights the market's preference for shorter, flexible bookings.
- A strong majority (61.1%) of the Bay Roberts Airbnb data shows acceptance of very short stays (1-2 nights), indicating a dynamic, high-turnover market.
- A significant segment (33.3%) caters to monthly stays (30+ nights) in Bay Roberts, pointing to opportunities in the extended-stay market.
Recommendations
- Align with the market by considering a 1 Night minimum stay, as 50% of Bay Roberts hosts use this setting.
- Explore offering discounts for stays of 30+ nights to attract the 33.3% of the market seeking extended stays.
- Adjust minimum nights based on seasonality – potentially shorter during low season and longer during peak demand periods in Bay Roberts.
Bay Roberts Airbnb Cancellation Policy Trends Analysis (2026)
Limited
2 listings
11.1% of total
Flexible
10 listings
55.6% of total
Moderate
4 listings
22.2% of total
Firm
2 listings
11.1% of total
Cancellation Policy Insights for Bay Roberts
- The prevailing Airbnb cancellation policy trend in Bay Roberts is Flexible, used by 55.6% of listings.
- The market strongly favors guest-friendly terms, with 77.8% of listings offering Flexible or Moderate policies. This suggests guests in Bay Roberts may expect booking flexibility.
Recommendations for Hosts
- Consider adopting a Flexible policy to align with the 55.6% market standard in Bay Roberts.
- Given the high prevalence of Flexible policies (55.6%), offering this can enhance booking appeal, especially during shoulder seasons.
- Regularly review your cancellation policy against competitors and market demand shifts in Bay Roberts.
Bay Roberts STR Booking Lead Time Analysis (2026)
Average Booking Lead Time by Month
Booking Lead Time Insights for Bay Roberts
- The overall average booking lead time for vacation rentals in Bay Roberts is 54 days.
- Guests book furthest in advance for stays during June (average 94 days), likely coinciding with peak travel demand or local events.
- The shortest booking windows occur for stays in February (average 19 days), indicating more last-minute travel plans during this time.
- Seasonally, Summer (89 days avg.) sees the longest lead times, while Winter (27 days avg.) has the shortest, reflecting typical travel planning cycles.
Recommendations for Hosts
- Use the overall average lead time (54 days) as a baseline for your pricing and availability strategy in Bay Roberts.
- For June stays, consider implementing length-of-stay discounts or slightly higher rates for bookings made less than 94 days out to capitalize on advance planning.
- Target marketing efforts for the Summer season well in advance (at least 89 days) to capture early planners.
- Monitor your own booking lead times against these Bay Roberts averages to identify opportunities for dynamic pricing adjustments.
Popular & Essential Airbnb Amenities in Bay Roberts (2026)
Amenity Prevalence
Amenity Insights for Bay Roberts
- Essential amenities in Bay Roberts that guests expect include: Refrigerator, Coffee maker, Kitchen, TV, Heating, Free parking on premises, Smoke alarm. Lacking these (any) could significantly impact bookings.
- Popular amenities like Wifi, Dishes and silverware, Fire extinguisher are common but not universal. Offering these can provide a competitive edge.
- Warning: Wifi is not universally provided but is considered essential globally. Ensure reliable Wifi is offered.
Recommendations for Hosts
- Ensure your listing includes all essential amenities for Bay Roberts: Refrigerator, Coffee maker, Kitchen, TV, Heating, Free parking on premises, Smoke alarm.
- Consider adding popular differentiators like Wifi or Dishes and silverware to increase appeal.
- Highlight unique or less common amenities you offer (e.g., hot tub, dedicated workspace, EV charger) in your listing description and photos.
- Regularly check competitor amenities in Bay Roberts to stay competitive.
Bay Roberts Airbnb Guest Demographics & Profile Analysis (2026)
Guest Profile Summary for Bay Roberts
- The typical guest profile for Airbnb in Bay Roberts consists of primarily domestic travelers (92%), often arriving from nearby St. John's, typically belonging to the Post-2000s (Gen Z/Alpha) group (50%), primarily speaking English or French.
- Domestic travelers account for 92.1% of guests.
- Key international markets include Canada (92.1%) and United States (4.9%).
- Top languages spoken are English (72.4%) followed by French (8.6%).
- A significant demographic segment is the Post-2000s (Gen Z/Alpha) group, representing 50% of guests.
Recommendations for Hosts
- Target domestic marketing efforts towards travelers from St. John's and Mount Pearl.
- Tailor amenities and listing descriptions to appeal to the dominant Post-2000s (Gen Z/Alpha) demographic (e.g., highlight fast WiFi, smart home features, local guides).
- Highlight unique local experiences or amenities relevant to the primary guest profile.
- Consider seasonal promotions aligned with peak travel times for key origin markets.
Nearby Short-Term Rental Market Comparison
How does the Bay Roberts Airbnb market stack up against its neighbors? Compare key performance metrics like average monthly revenue, ADR, and occupancy rates in surrounding areas to understand the broader regional STR landscape.
| Market | Active Properties | Monthly Revenue | Daily Rate | Avg. Occupancy |
|---|---|---|---|---|
| Pouch Cove | 11 | $2,725 | $172.22 | 53% |
| Tors Cove | 17 | $2,610 | $219.59 | 45% |
| Portugal Cove - St. Philips | 15 | $2,391 | $176.72 | 55% |
| Port Rexton | 31 | $2,182 | $185.44 | 51% |
| Dildo | 26 | $2,130 | $187.56 | 43% |
| Port de Grave | 11 | $1,971 | $165.11 | 43% |
| Conception Bay South | 38 | $1,967 | $147.22 | 54% |
| Trinity Bay North | 18 | $1,957 | $147.69 | 53% |
| Bonavista | 98 | $1,919 | $151.65 | 54% |
| Saint John's | 553 | $1,913 | $154.64 | 54% |