Baddeck Bay Airbnb Market Analysis 2026: Short Term Rental Data & Vacation Rental Statistics in Nova Scotia, Canada
Is Airbnb profitable in Baddeck Bay in 2026? Explore comprehensive Airbnb analytics for Baddeck Bay, Nova Scotia, Canada to uncover income potential. This 2026 STR market report for Baddeck Bay, based on AirROI data from July 2024 to June 2025, reveals key trends in the niche market of 18 active listings.
Whether you're considering an Airbnb investment in Baddeck Bay, optimizing your existing vacation rental, or exploring rental arbitrage opportunities, understanding the Baddeck Bay Airbnb data is crucial. Leveraging the low regulation environment is key to maximizing your short term rental income potential. Let's dive into the specifics.
Key Baddeck Bay Airbnb Performance Metrics Overview
Monthly Airbnb Revenue Variations & Income Potential in Baddeck Bay (2026)
Understanding the monthly revenue variations for Airbnb listings in Baddeck Bay is key to maximizing your short term rental income potential. Seasonality significantly impacts earnings. Our analysis, based on data from the past 12 months, shows that the peak revenue month for STRs in Baddeck Bay is typically August, while December often presents the lowest earnings, highlighting opportunities for strategic pricing adjustments during shoulder and low seasons. Explore the typical Airbnb income in Baddeck Bay across different performance tiers:
- Best-in-class properties (Top 10%) achieve $5,056+ monthly, often utilizing dynamic pricing and superior guest experiences.
- Strong performing properties (Top 25%) earn $3,737 or more, indicating effective management and desirable locations/amenities.
- Typical properties (Median) generate around $2,109 per month, representing the average market performance.
- Entry-level properties (Bottom 25%) see earnings around $1,132, often with potential for optimization.
Average Monthly Airbnb Earnings Trend in Baddeck Bay
Baddeck Bay Airbnb Occupancy Rate Trends (2026)
Maximize your bookings by understanding the Baddeck Bay STR occupancy trends. Seasonal demand shifts significantly influence how often properties are booked. Typically, Augustsees the highest demand (peak season occupancy), while December experiences the lowest (low season). Effective strategies, like adjusting minimum stays or offering promotions, can boost occupancy during slower periods. Here's how different property tiers perform in Baddeck Bay:
- Best-in-class properties (Top 10%) achieve 68%+ occupancy, indicating high desirability and potentially optimized availability.
- Strong performing properties (Top 25%) maintain 55% or higher occupancy, suggesting good market fit and guest satisfaction.
- Typical properties (Median) have an occupancy rate around 37%.
- Entry-level properties (Bottom 25%) average 21% occupancy, potentially facing higher vacancy.
Average Monthly Occupancy Rate Trend in Baddeck Bay
Average Daily Rate (ADR) Airbnb Trends in Baddeck Bay (2026)
Effective short term rental pricing strategy in Baddeck Bay involves understanding monthly ADR fluctuations. The Average Daily Rate (ADR) for Airbnb in Baddeck Bay typically peaks in July and dips lowest during January. Leveraging Airbnb dynamic pricing tools or strategies based on this seasonality can significantly boost revenue. Here's a look at the typical nightly rates achieved:
- Best-in-class properties (Top 10%) command rates of $296+ per night, often due to premium features or locations.
- Strong performing properties (Top 25%) achieve nightly rates of $252 or more.
- Typical properties (Median) charge around $152 per night.
- Entry-level properties (Bottom 25%) earn around $107 per night.
Average Daily Rate (ADR) Trend by Month in Baddeck Bay
Get Live Baddeck Bay Market Intelligence 👇

Explore Real-time Analytics
Airbnb Seasonality Analysis & Trends in Baddeck Bay (2025)
Peak Season (August, November, July)
- Revenue averages $4,367 per month
- Occupancy rates average 63.6%
- Daily rates average $191
Shoulder Season
- Revenue averages $2,393 per month
- Occupancy maintains around 39.3%
- Daily rates hold near $189
Low Season (February, March, December)
- Revenue drops to average $1,290 per month
- Occupancy decreases to average 17.4%
- Daily rates adjust to average $186
Seasonality Insights for Baddeck Bay
- The Airbnb seasonality in Baddeck Bay shows highly seasonal trends requiring careful strategy. While the sections above show seasonal averages, it's also insightful to look at the extremes:
- During the high season, the absolute peak month showcases Baddeck Bay's highest earning potential, with monthly revenues capable of climbing to $4,542, occupancy reaching a high of 69.6%, and ADRs peaking at $195.
- Conversely, the slowest single month of the year, typically falling within the low season, marks the market's lowest point. In this month, revenue might dip to $478, occupancy could drop to 6.5%, and ADRs may adjust down to $180.
- Understanding both the seasonal averages and these monthly peaks and troughs in revenue, occupancy, and ADR is crucial for maximizing your Airbnb profit potential in Baddeck Bay.
Seasonal Strategies for Maximizing Profit
- Peak Season: Maximize revenue through premium pricing and potentially longer minimum stays. Ensure high availability.
- Low Season: Offer competitive pricing, special promotions (e.g., extended stay discounts), and flexible cancellation policies. Target off-season travelers like remote workers or budget-conscious guests.
- Shoulder Seasons: Implement dynamic pricing that balances peak and low rates. Target weekend travelers or specific events. Offer slightly more flexible terms than peak season.
- Regularly analyze your own performance against these Baddeck Bay seasonality benchmarks and adjust your pricing and availability strategy accordingly.
Best Areas for Airbnb Investment in Baddeck Bay (2026)
Exploring the top neighborhoods for short-term rentals in Baddeck Bay? This section highlights key areas, outlining why they are attractive for hosts and guests, along with notable local attractions. Consider these locations based on your target guest profile and investment strategy.
| Neighborhood / Area | Why Host Here? (Target Guests & Appeal) | Key Attractions & Landmarks |
|---|---|---|
| Baddeck Village | Charming village atmosphere with access to beautiful scenery and local culture. Perfect for tourists looking to experience the natural beauty of Cape Breton and local heritage. | Alexander Graham Bell National Historic Site, Baddeck Bay, Cape Breton Highlands National Park, local artisan shops, waterfront promenade, sailing tours |
| Sydney | The largest city on Cape Breton Island offering urban amenities, dining, and entertainment. A hub for visitors exploring the surrounding areas and national parks. | Sydney Waterfront, The Big Fiddle, Cape Breton Centre for Craft and Design, local festivals, cinemas and theatres |
| North Sydney | Gateway to the ferry service to Newfoundland and charming coastal views, attractive for traveling families and exploring the Cabot Trail. | North Sydney Historical Society, Lighthouse Beach, local parks, ferry terminal access, Scotia Square |
| Inverness | Known for its stunning beaches and golf courses, it attracts visitors looking for a relaxed beach experience and outdoor activities. | Inverness Beach, Highland Links Golf Course, local music events, Cabot Links, Cape Breton's Highlands |
| Margaree Forks | A scenic rural area perfect for nature lovers and those interested in fishing and outdoor sports. Attracts tourists seeking tranquility and nature. | Margaree River, local hiking trails, fishing spots, wildlife observation, Margaree Valley |
| Dingwall | A quiet coastal location ideal for relaxation and exploration of the nearby coastline and hiking trails. Great for visitors wanting to escape the city hustle. | Cape Breton Highlands National Park, local beaches, hiking trails, scenic drives, whale watching opportunities |
| Englishtown | A small community with rich fishing heritage and close-knit feel. Ideal for tourists interested in maritime history and coastal adventures. | Englishtown Ferry, local fishing culture, historical sites, beach access, natural reserves |
| Saint Ann's Bay | Beautiful scenery and attractions that cater to those interested in outdoor activities and cultural experiences. A tranquil spot close to nature. | Keltic Lodge Resort, Mabou River, local hiking paths, cultural events, beautiful vistas |
Understanding Airbnb License Requirements & STR Laws in Baddeck Bay (2026)
While Baddeck Bay, Nova Scotia, Canada currently shows low STR regulations, specific Airbnb license requirements might still exist or change. Always verify the latest short term rental regulations and Airbnb license requirements directly with local government authorities for Baddeck Bay to ensure full compliance before hosting.
(Source: AirROI data, 2026, finding no licensed listings among those analyzed)
Top Performing Airbnb Properties in Baddeck Bay (2026)
Benchmark your potential! Explore examples of top-performing Airbnb properties in Baddeck Baybased on Trailing Twelve Month (TTM) revenue. Analyze their characteristics, revenue, occupancy rate, and ADR to understand what drives success in this market.
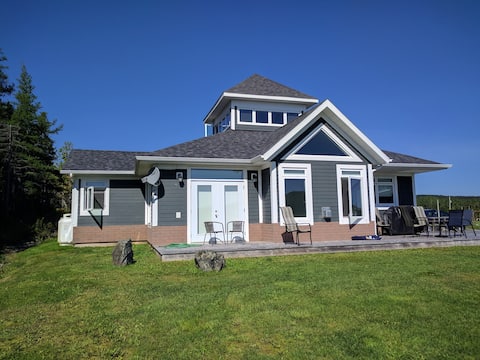
Baddeck cottage with a beautiful view
Entire Place • 3 bedrooms
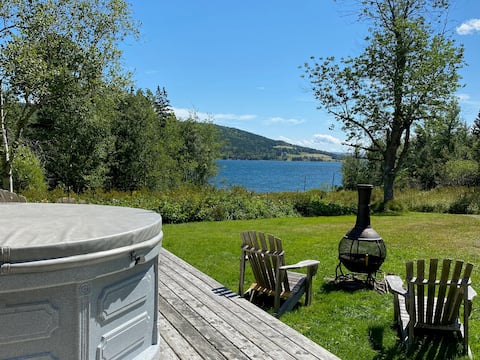
Coastal Cottage w/hot tub on Baddeck Bay
Entire Place • 2 bedrooms
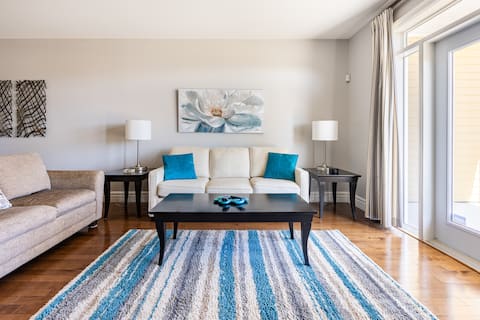
Baddeck 2 bedroom2 bath Condo-Incredible Lakeview
Entire Place • 2 bedrooms

The Hydrofoil Hanger on Baddeck Bay
Entire Place • 1 bedroom

Scottish Thistle
Entire Place • 3 bedrooms
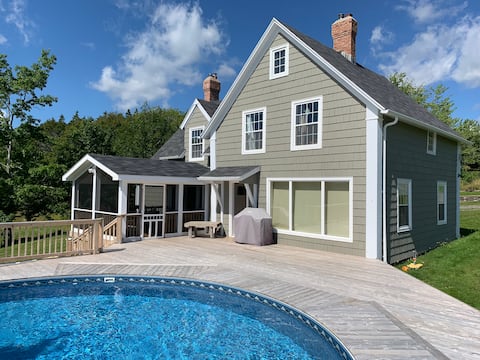
Macaulay’s Hill Farm
Entire Place • 3 bedrooms
Note: Performance varies based on location, size, amenities, seasonality, and management quality. Data reflects the past 12 months.
Top Performing Airbnb Hosts in Baddeck Bay (2026)
Learn from the best! This table showcases top-performing Airbnb hosts in Baddeck Bay based on the number of properties managed and estimated total revenue over the past year. Analyze their scale and performance metrics.
| Host Name | Properties | Grossing Revenue | Stay Reviews | Avg Rating |
|---|---|---|---|---|
| John | 8 | $122,954 | 233 | 4.81/5.0 |
| Aaron | 1 | $60,816 | 84 | 4.93/5.0 |
| Glen & Jan | 4 | $35,508 | 67 | 4.93/5.0 |
| Brad | 1 | $32,204 | 46 | 4.98/5.0 |
| Tyson | 1 | $27,751 | 13 | 4.62/5.0 |
| Tara | 1 | $16,543 | 27 | 4.85/5.0 |
| Fa Kwang | 1 | $12,617 | 44 | 4.77/5.0 |
| Shauna | 1 | $1,840 | 4 | 4.75/5.0 |
Analyzing the strategies of top hosts, such as their property selection, pricing, and guest communication, can offer valuable lessons for optimizing your own Airbnb operations in Baddeck Bay.
Dive Deeper: Advanced Baddeck Bay STR Market Data (2026)
Ready to unlock more insights? AirROI provides access to advanced metrics and comprehensive Airbnb data for Baddeck Bay. Explore detailed analytics beyond this report to refine your investment strategy, optimize pricing, and maximize your vacation rental profits.
Explore Advanced MetricsBaddeck Bay Short-Term Rental Market Composition (2026): Property & Room Types
Room Type Distribution
Property Type Distribution
Market Composition Insights for Baddeck Bay
- The Baddeck Bay Airbnb market composition is heavily skewed towards Entire Home/Apt listings, which make up 61.1% of the 18 active rentals. This indicates strong guest preference for privacy and space.
- However, a notable 38.9% share for Private Rooms suggests opportunities for budget-conscious travelers or hosts renting out spare rooms.
- Looking at the property type distribution in Baddeck Bay, House properties are the most common (50%), reflecting the local real estate landscape.
- Houses represent a significant 50% portion, catering likely to families or larger groups.
- The presence of 38.9% Hotel/Boutique listings indicates integration with traditional hospitality.
Baddeck Bay Airbnb Room Capacity Analysis (2026): Bedroom Distribution
Distribution of Listings by Number of Bedrooms
Room Capacity Insights for Baddeck Bay
- The dominant room capacity in Baddeck Bay is 3 bedrooms listings, making up 33.3% of the market. This suggests a strong demand for properties suitable for families or small groups.
- Together, 3 bedrooms and 1 bedroom properties represent 61.1% of the active Airbnb listings in Baddeck Bay, indicating a high concentration in these sizes.
- A significant 33.3% of listings offer 3+ bedrooms, catering to larger groups and families seeking more space in Baddeck Bay.
Baddeck Bay Vacation Rental Guest Capacity Trends (2026)
Distribution of Listings by Guest Capacity
Guest Capacity Insights for Baddeck Bay
- The most common guest capacity trend in Baddeck Bay vacation rentals is listings accommodating 2 guests (27.8%). This suggests the primary traveler segment is likely couples or solo travelers.
- Properties designed for 2 guests and 8+ guests dominate the Baddeck Bay STR market, accounting for 44.5% of listings.
- 33.4% of properties accommodate 6+ guests, serving the market segment for larger families or group travel in Baddeck Bay.
- On average, properties in Baddeck Bay are equipped to host 3.6 guests.
Baddeck Bay Airbnb Booking Patterns (2026): Available vs. Booked Days
Available Days Distribution
Booked Days Distribution
Booking Pattern Insights for Baddeck Bay
- The most common availability pattern in Baddeck Bay falls within the 271-366 days range, representing 72.2% of listings. This suggests many properties have significant open periods on their calendars.
- Approximately 94.4% of listings show high availability (181+ days open annually), indicating potential for increased bookings or specific owner usage patterns.
- For booked days, the 31-90 days range is most frequent in Baddeck Bay (61.1%), reflecting common guest stay durations or potential owner blocking patterns.
- A notable 5.6% of properties secure long booking periods (181+ days booked per year), highlighting successful long-term rental strategies or significant owner usage.
Baddeck Bay Airbnb Minimum Stay Requirements Analysis
Distribution of Listings by Minimum Night Requirement
1 Night
10 listings
55.6% of total
2 Nights
2 listings
11.1% of total
3 Nights
3 listings
16.7% of total
4-6 Nights
1 listings
5.6% of total
30+ Nights
2 listings
11.1% of total
Key Insights
- The most prevalent minimum stay requirement in Baddeck Bay is 1 Night, adopted by 55.6% of listings. This highlights the market's preference for shorter, flexible bookings.
- A strong majority (66.7%) of the Baddeck Bay Airbnb data shows acceptance of very short stays (1-2 nights), indicating a dynamic, high-turnover market.
- A significant segment (11.1%) caters to monthly stays (30+ nights) in Baddeck Bay, pointing to opportunities in the extended-stay market.
Recommendations
- Align with the market by considering a 1 Night minimum stay, as 55.6% of Baddeck Bay hosts use this setting.
- Explore offering discounts for stays of 30+ nights to attract the 11.1% of the market seeking extended stays.
- Adjust minimum nights based on seasonality – potentially shorter during low season and longer during peak demand periods in Baddeck Bay.
Baddeck Bay Airbnb Cancellation Policy Trends Analysis (2026)
Flexible
1 listings
5.6% of total
Moderate
7 listings
38.9% of total
Firm
10 listings
55.6% of total
Cancellation Policy Insights for Baddeck Bay
- The prevailing Airbnb cancellation policy trend in Baddeck Bay is Firm, used by 55.6% of listings.
- A majority (55.6%) of hosts in Baddeck Bay utilize Firm or Strict policies, indicating a market where hosts prioritize booking security.
Recommendations for Hosts
- Consider adopting a Firm policy to align with the 55.6% market standard in Baddeck Bay.
- Regularly review your cancellation policy against competitors and market demand shifts in Baddeck Bay.
Baddeck Bay STR Booking Lead Time Analysis (2026)
Average Booking Lead Time by Month
Booking Lead Time Insights for Baddeck Bay
- The overall average booking lead time for vacation rentals in Baddeck Bay is 73 days.
- Guests book furthest in advance for stays during November (average 151 days), likely coinciding with peak travel demand or local events.
- The shortest booking windows occur for stays in December (average 1 days), indicating more last-minute travel plans during this time.
- Seasonally, Fall (109 days avg.) sees the longest lead times, while Winter (47 days avg.) has the shortest, reflecting typical travel planning cycles.
Recommendations for Hosts
- Use the overall average lead time (73 days) as a baseline for your pricing and availability strategy in Baddeck Bay.
- For November stays, consider implementing length-of-stay discounts or slightly higher rates for bookings made less than 151 days out to capitalize on advance planning.
- During December, focus on last-minute booking availability and promotions, as guests book with very short notice (1 days avg.).
- Target marketing efforts for the Fall season well in advance (at least 109 days) to capture early planners.
- Monitor your own booking lead times against these Baddeck Bay averages to identify opportunities for dynamic pricing adjustments.
Popular & Essential Airbnb Amenities in Baddeck Bay (2026)
Amenity data is currently unavailable for Baddeck Bay.
Baddeck Bay Airbnb Guest Demographics & Profile Analysis (2026)
Guest Profile Summary for Baddeck Bay
- The typical guest profile for Airbnb in Baddeck Bay consists of a mix of domestic (49%) and international guests, with top international origins including United States, typically belonging to the Post-2000s (Gen Z/Alpha) group (50%), primarily speaking English or French.
- Domestic travelers account for 49.3% of guests.
- Key international markets include Canada (49.3%) and United States (39.7%).
- Top languages spoken are English (64.3%) followed by French (11.9%).
- A significant demographic segment is the Post-2000s (Gen Z/Alpha) group, representing 50% of guests.
Recommendations for Hosts
- Balance marketing efforts between domestic and international channels based on the guest mix.
- Tailor amenities and listing descriptions to appeal to the dominant Post-2000s (Gen Z/Alpha) demographic (e.g., highlight fast WiFi, smart home features, local guides).
- Highlight unique local experiences or amenities relevant to the primary guest profile.
- Consider seasonal promotions aligned with peak travel times for key origin markets.
Nearby Short-Term Rental Market Comparison
How does the Baddeck Bay Airbnb market stack up against its neighbors? Compare key performance metrics like average monthly revenue, ADR, and occupancy rates in surrounding areas to understand the broader regional STR landscape.
| Market | Active Properties | Monthly Revenue | Daily Rate | Avg. Occupancy |
|---|---|---|---|---|
| Margaree Harbour | 15 | $3,707 | $348.72 | 46% |
| Inverness | 45 | $2,207 | $257.36 | 47% |
| Grand Étang | 11 | $2,067 | $219.43 | 53% |
| Point Cross | 34 | $2,044 | $193.20 | 50% |
| Scotsville | 11 | $1,871 | $219.72 | 44% |
| St. Georges Channel | 11 | $1,779 | $188.09 | 35% |
| Antigonish | 18 | $1,664 | $135.22 | 52% |
| Baddeck | 34 | $1,616 | $149.99 | 52% |
| Petit Étang | 17 | $1,603 | $143.68 | 53% |
| Cheticamp | 69 | $1,562 | $161.64 | 43% |