Hubbards Airbnb Market Analysis 2026: Short Term Rental Data & Vacation Rental Statistics in Nova Scotia, Canada
Is Airbnb profitable in Hubbards in 2026? Explore comprehensive Airbnb analytics for Hubbards, Nova Scotia, Canada to uncover income potential. This 2026 STR market report for Hubbards, based on AirROI data from February 2025 to January 2026, reveals key trends in the niche market of 48 active listings.
Whether you're considering an Airbnb investment in Hubbards, optimizing your existing vacation rental, or exploring rental arbitrage opportunities, understanding the Hubbards Airbnb data is crucial. Navigating the high regulation landscape is key to maximizing your short term rental income potential. Let's dive into the specifics.
Key Hubbards Airbnb Performance Metrics Overview
Monthly Airbnb Revenue Variations & Income Potential in Hubbards (2026)
Understanding the monthly revenue variations for Airbnb listings in Hubbards is key to maximizing your short term rental income potential. Seasonality significantly impacts earnings. Our analysis, based on data from the past 12 months, shows that the peak revenue month for STRs in Hubbards is typically August, while March often presents the lowest earnings, highlighting opportunities for strategic pricing adjustments during shoulder and low seasons. Explore the typical Airbnb income in Hubbards across different performance tiers:
- Best-in-class properties (Top 10%) achieve $5,971+ monthly, often utilizing dynamic pricing and superior guest experiences.
- Strong performing properties (Top 25%) earn $3,424 or more, indicating effective management and desirable locations/amenities.
- Typical properties (Median) generate around $1,659 per month, representing the average market performance.
- Entry-level properties (Bottom 25%) see earnings around $660, often with potential for optimization.
Average Monthly Airbnb Earnings Trend in Hubbards
Hubbards Airbnb Occupancy Rate Trends (2026)
Maximize your bookings by understanding the Hubbards STR occupancy trends. Seasonal demand shifts significantly influence how often properties are booked. Typically, Augustsees the highest demand (peak season occupancy), while January experiences the lowest (low season). Effective strategies, like adjusting minimum stays or offering promotions, can boost occupancy during slower periods. Here's how different property tiers perform in Hubbards:
- Best-in-class properties (Top 10%) achieve 62%+ occupancy, indicating high desirability and potentially optimized availability.
- Strong performing properties (Top 25%) maintain 45% or higher occupancy, suggesting good market fit and guest satisfaction.
- Typical properties (Median) have an occupancy rate around 25%.
- Entry-level properties (Bottom 25%) average 15% occupancy, potentially facing higher vacancy.
Average Monthly Occupancy Rate Trend in Hubbards
Average Daily Rate (ADR) Airbnb Trends in Hubbards (2026)
Effective short term rental pricing strategy in Hubbards involves understanding monthly ADR fluctuations. The Average Daily Rate (ADR) for Airbnb in Hubbards typically peaks in August and dips lowest during December. Leveraging Airbnb dynamic pricing tools or strategies based on this seasonality can significantly boost revenue. Here's a look at the typical nightly rates achieved:
- Best-in-class properties (Top 10%) command rates of $317+ per night, often due to premium features or locations.
- Strong performing properties (Top 25%) achieve nightly rates of $247 or more.
- Typical properties (Median) charge around $172 per night.
- Entry-level properties (Bottom 25%) earn around $104 per night.
Average Daily Rate (ADR) Trend by Month in Hubbards
Get Live Hubbards Market Intelligence 👇

Explore Real-time Analytics
Airbnb Seasonality Analysis & Trends in Hubbards (2026)
Peak Season (August, July, December)
- Revenue averages $3,974 per month
- Occupancy rates average 45.5%
- Daily rates average $192
Shoulder Season
- Revenue averages $2,209 per month
- Occupancy maintains around 28.3%
- Daily rates hold near $194
Low Season (January, February, March)
- Revenue drops to average $1,548 per month
- Occupancy decreases to average 22.8%
- Daily rates adjust to average $184
Seasonality Insights for Hubbards
- The Airbnb seasonality in Hubbards shows highly seasonal trends requiring careful strategy. While the sections above show seasonal averages, it's also insightful to look at the extremes:
- During the high season, the absolute peak month showcases Hubbards's highest earning potential, with monthly revenues capable of climbing to $4,577, occupancy reaching a high of 60.1%, and ADRs peaking at $209.
- Conversely, the slowest single month of the year, typically falling within the low season, marks the market's lowest point. In this month, revenue might dip to $1,380, occupancy could drop to 17.8%, and ADRs may adjust down to $159.
- Understanding both the seasonal averages and these monthly peaks and troughs in revenue, occupancy, and ADR is crucial for maximizing your Airbnb profit potential in Hubbards.
Seasonal Strategies for Maximizing Profit
- Peak Season: Maximize revenue through premium pricing and potentially longer minimum stays. Ensure high availability.
- Low Season: Offer competitive pricing, special promotions (e.g., extended stay discounts), and flexible cancellation policies. Target off-season travelers like remote workers or budget-conscious guests.
- Shoulder Seasons: Implement dynamic pricing that balances peak and low rates. Target weekend travelers or specific events. Offer slightly more flexible terms than peak season.
- Regularly analyze your own performance against these Hubbards seasonality benchmarks and adjust your pricing and availability strategy accordingly.
Best Areas for Airbnb Investment in Hubbards (2026)
Exploring the top neighborhoods for short-term rentals in Hubbards? This section highlights key areas, outlining why they are attractive for hosts and guests, along with notable local attractions. Consider these locations based on your target guest profile and investment strategy.
| Neighborhood / Area | Why Host Here? (Target Guests & Appeal) | Key Attractions & Landmarks |
|---|---|---|
| Hubbards Beach | A beautiful sandy beach known for its stunning sunsets and family-friendly atmosphere. It's a popular spot for tourists looking to relax by the water and enjoy outdoor activities. | Hubbards Beach, Queensland Beach, The Shore Club, Hubley Creek, Hubbards Sailing Club |
| Hubbards Heritage Museum | A cultural hotspot that showcases the history of Hubbards and the surrounding area. It attracts history buffs and families looking to learn more about the local culture. | Hubbards Heritage Museum, The Old Train Station, Historic Lighthouses, Local Art Installations |
| Marina and Waterfront | A picturesque marina area where visitors can enjoy boating, fishing, and local seafood dining. It's ideal for tourists seeking outdoor adventures and water sports. | Hubbards Marina, Fishing Charters, Seafood Restaurants, Waterfront Cafes |
| St. Margaret's Bay | Nearby bay area known for natural beauty and outdoor activities. Offers a variety of hiking trails and scenic views, appealing to nature lovers. | St. Margaret's Bay Coastal Trail, Nature Parks, Local Beaches, Kayaking |
| The Shore Club | A famous venue for entertainment and local music, especially in the summer. It attracts visitors looking for local culture and events, making it perfect for short-term rentals. | The Shore Club Events, Dance Halls, Local Bands, Seafood and Lobster Dinners |
| Nearby Hiking Trails | Hubbards is surrounded by beautiful natural landscapes and trails. This area attracts hikers and outdoor enthusiasts, providing excellent opportunities for exploration. | The Bluff Trail, Hubbards Hiking Trails, Nature Reserves, Scenic Lookouts |
| Local Art and Crafts | A vibrant community of local artists and craftsmen. This area appeals to those interested in art, culture, and unique handmade products. | Local Art Galleries, Craft Shops, Art Workshops, Cultural Events |
| Ocean Encounter Tours | This area provides access to various marine tours and encounters, including whale watching and seal sightings. It's great for families and adventure seekers. | Whale Watching Tours, Seal Watching, Boat Rentals, Eco Tours |
Understanding Airbnb License Requirements & STR Laws in Hubbards (2026)
Yes, Hubbards, Nova Scotia, Canada enforces high STR regulations. Obtaining a license and ensuring compliance is almost certainly required according to current 2026 STR laws. Always verify the latest short term rental regulations and Airbnb license requirements directly with local government authorities for Hubbards to ensure full compliance before hosting.
(Source: AirROI data, 2026, based on 92% licensed listings)
Top Performing Airbnb Properties in Hubbards (2026)
Benchmark your potential! Explore examples of top-performing Airbnb properties in Hubbardsbased on Trailing Twelve Month (TTM) revenue. Analyze their characteristics, revenue, occupancy rate, and ADR to understand what drives success in this market.
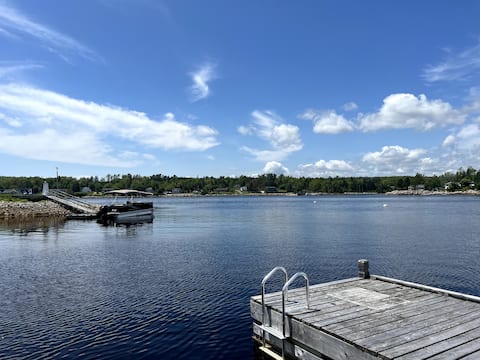
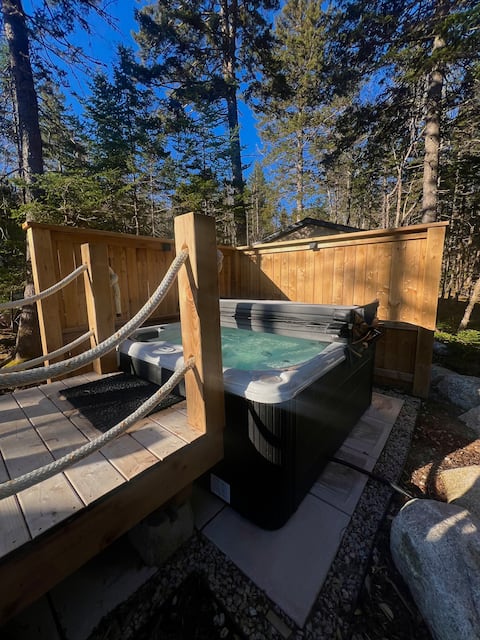
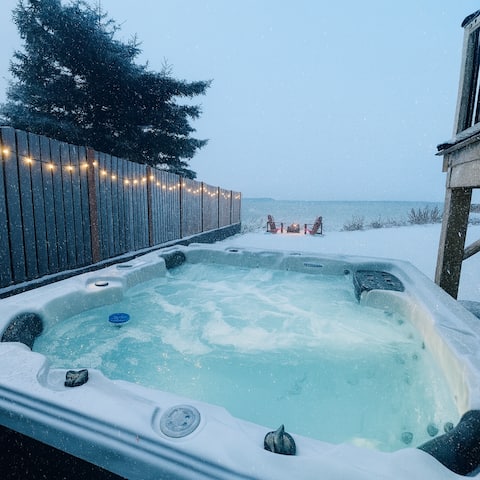
Oceanfront - Hot Tub - Dock - Shoreclub
Entire Place • 4 bedrooms

Anchorage House
Entire Place • 8 bedrooms
Mill Lake Retreat - Lyra Dome with Private Hot Tub
Entire Place • 1 bedroom
Private Oceanfront Escape
Entire Place • 3 bedrooms
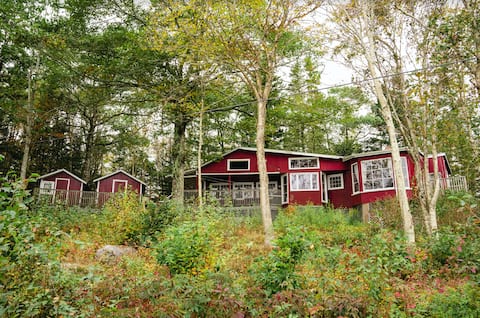
Beach Cottage - Oak Hollow
Entire Place • 2 bedrooms
Mill Lake Paradise Cottage
Entire Place • 3 bedrooms
Note: Performance varies based on location, size, amenities, seasonality, and management quality. Data reflects the past 12 months.
Top Performing Airbnb Hosts in Hubbards (2026)
Learn from the best! This table showcases top-performing Airbnb hosts in Hubbards based on the number of properties managed and estimated total revenue over the past year. Analyze their scale and performance metrics.
| Host Name | Properties | Grossing Revenue | Stay Reviews | Avg Rating |
|---|---|---|---|---|
| Jared | 27 | $339,052 | 72 | 4.89/5.0 |
| Katelyn Elizabeth | 6 | $119,379 | 133 | 4.92/5.0 |
| Lynn | 3 | $87,379 | 420 | 4.85/5.0 |
| Nicole | 1 | $43,902 | 34 | 5.00/5.0 |
| Chris | 1 | $34,350 | 42 | 4.95/5.0 |
| Melanie | 1 | $33,636 | 16 | 4.94/5.0 |
| Sid | 1 | $29,055 | 27 | 4.78/5.0 |
| Jeff | 1 | $21,202 | 7 | 5.00/5.0 |
| David | 1 | $17,716 | 40 | 4.98/5.0 |
| Jordan | 1 | $13,684 | 16 | 4.56/5.0 |
Analyzing the strategies of top hosts, such as their property selection, pricing, and guest communication, can offer valuable lessons for optimizing your own Airbnb operations in Hubbards.
Dive Deeper: Advanced Hubbards STR Market Data (2026)
Ready to unlock more insights? AirROI provides access to advanced metrics and comprehensive Airbnb data for Hubbards. Explore detailed analytics beyond this report to refine your investment strategy, optimize pricing, and maximize your vacation rental profits.
Explore Advanced MetricsHubbards Short-Term Rental Market Composition (2026): Property & Room Types
Room Type Distribution
Property Type Distribution
Market Composition Insights for Hubbards
- The Hubbards Airbnb market composition is heavily skewed towards Entire Home/Apt listings, which make up 100% of the 48 active rentals. This indicates strong guest preference for privacy and space.
- Looking at the property type distribution in Hubbards, Outdoor/Unique properties are the most common (54.2%), reflecting the local real estate landscape.
- Houses represent a significant 35.4% portion, catering likely to families or larger groups.
- Smaller segments like apartment/condo, others (combined 4.2%) offer potential for unique stay experiences.
Hubbards Airbnb Room Capacity Analysis (2026): Bedroom Distribution
Distribution of Listings by Number of Bedrooms
Room Capacity Insights for Hubbards
- The dominant room capacity in Hubbards is 3 bedrooms listings, making up 25% of the market. This suggests a strong demand for properties suitable for families or small groups.
- Together, 3 bedrooms and 2 bedrooms properties represent 47.9% of the active Airbnb listings in Hubbards, indicating a high concentration in these sizes.
- A significant 31.3% of listings offer 3+ bedrooms, catering to larger groups and families seeking more space in Hubbards.
Hubbards Vacation Rental Guest Capacity Trends (2026)
Distribution of Listings by Guest Capacity
Guest Capacity Insights for Hubbards
- The most common guest capacity trend in Hubbards vacation rentals is listings accommodating 4 guests (43.8%). This suggests the primary traveler segment is likely small families or groups.
- Properties designed for 4 guests and 6 guests dominate the Hubbards STR market, accounting for 70.9% of listings.
- 43.8% of properties accommodate 6+ guests, serving the market segment for larger families or group travel in Hubbards.
- On average, properties in Hubbards are equipped to host 5.1 guests.
Hubbards Airbnb Booking Patterns (2026): Available vs. Booked Days
Available Days Distribution
Booked Days Distribution
Booking Pattern Insights for Hubbards
- The most common availability pattern in Hubbards falls within the 271-366 days range, representing 77.1% of listings. This suggests many properties have significant open periods on their calendars.
- Approximately 97.9% of listings show high availability (181+ days open annually), indicating potential for increased bookings or specific owner usage patterns.
- For booked days, the 31-90 days range is most frequent in Hubbards (50%), reflecting common guest stay durations or potential owner blocking patterns.
- A notable 2.1% of properties secure long booking periods (181+ days booked per year), highlighting successful long-term rental strategies or significant owner usage.
Hubbards Airbnb Minimum Stay Requirements Analysis
Distribution of Listings by Minimum Night Requirement
1 Night
31 listings
64.6% of total
2 Nights
4 listings
8.3% of total
3 Nights
1 listings
2.1% of total
4-6 Nights
3 listings
6.3% of total
7-29 Nights
2 listings
4.2% of total
30+ Nights
7 listings
14.6% of total
Key Insights
- The most prevalent minimum stay requirement in Hubbards is 1 Night, adopted by 64.6% of listings. This highlights the market's preference for shorter, flexible bookings.
- A strong majority (72.9%) of the Hubbards Airbnb data shows acceptance of very short stays (1-2 nights), indicating a dynamic, high-turnover market.
- A significant segment (14.6%) caters to monthly stays (30+ nights) in Hubbards, pointing to opportunities in the extended-stay market.
Recommendations
- Align with the market by considering a 1 Night minimum stay, as 64.6% of Hubbards hosts use this setting.
- Explore offering discounts for stays of 30+ nights to attract the 14.6% of the market seeking extended stays.
- Adjust minimum nights based on seasonality – potentially shorter during low season and longer during peak demand periods in Hubbards.
Hubbards Airbnb Cancellation Policy Trends Analysis (2026)
Limited
5 listings
10.4% of total
Flexible
4 listings
8.3% of total
Moderate
4 listings
8.3% of total
Firm
35 listings
72.9% of total
Cancellation Policy Insights for Hubbards
- The prevailing Airbnb cancellation policy trend in Hubbards is Firm, used by 72.9% of listings.
- A majority (72.9%) of hosts in Hubbards utilize Firm or Strict policies, indicating a market where hosts prioritize booking security.
Recommendations for Hosts
- Consider adopting a Firm policy to align with the 72.9% market standard in Hubbards.
- Regularly review your cancellation policy against competitors and market demand shifts in Hubbards.
Hubbards STR Booking Lead Time Analysis (2026)
Average Booking Lead Time by Month
Booking Lead Time Insights for Hubbards
- The overall average booking lead time for vacation rentals in Hubbards is 82 days.
- Guests book furthest in advance for stays during August (average 123 days), likely coinciding with peak travel demand or local events.
- The shortest booking windows occur for stays in November (average 21 days), indicating more last-minute travel plans during this time.
- Seasonally, Summer (96 days avg.) sees the longest lead times, while Winter (26 days avg.) has the shortest, reflecting typical travel planning cycles.
Recommendations for Hosts
- Use the overall average lead time (82 days) as a baseline for your pricing and availability strategy in Hubbards.
- For August stays, consider implementing length-of-stay discounts or slightly higher rates for bookings made less than 123 days out to capitalize on advance planning.
- Target marketing efforts for the Summer season well in advance (at least 96 days) to capture early planners.
- Monitor your own booking lead times against these Hubbards averages to identify opportunities for dynamic pricing adjustments.
Popular & Essential Airbnb Amenities in Hubbards (2026)
Amenity Prevalence
Amenity Insights for Hubbards
- Essential amenities in Hubbards that guests expect include: Wifi. Lacking these (this) could significantly impact bookings.
- Popular amenities like Pets allowed, Heating, Essentials are common but not universal. Offering these can provide a competitive edge.
Recommendations for Hosts
- Ensure your listing includes all essential amenities for Hubbards: Wifi.
- Consider adding popular differentiators like Pets allowed or Heating to increase appeal.
- Highlight unique or less common amenities you offer (e.g., hot tub, dedicated workspace, EV charger) in your listing description and photos.
- Regularly check competitor amenities in Hubbards to stay competitive.
Hubbards Airbnb Guest Demographics & Profile Analysis (2026)
Guest Profile Summary for Hubbards
- The typical guest profile for Airbnb in Hubbards consists of primarily domestic travelers (88%), often arriving from nearby Halifax, typically belonging to the Post-2000s (Gen Z/Alpha) group (50%), primarily speaking English or French.
- Domestic travelers account for 88.1% of guests.
- Key international markets include Canada (88.1%) and United States (8.6%).
- Top languages spoken are English (68.9%) followed by French (17.6%).
- A significant demographic segment is the Post-2000s (Gen Z/Alpha) group, representing 50% of guests.
Recommendations for Hosts
- Target domestic marketing efforts towards travelers from Halifax and Nova Scotia.
- Tailor amenities and listing descriptions to appeal to the dominant Post-2000s (Gen Z/Alpha) demographic (e.g., highlight fast WiFi, smart home features, local guides).
- Highlight unique local experiences or amenities relevant to the primary guest profile.
- Consider seasonal promotions aligned with peak travel times for key origin markets.
Nearby Short-Term Rental Market Comparison
How does the Hubbards Airbnb market stack up against its neighbors? Compare key performance metrics like average monthly revenue, ADR, and occupancy rates in surrounding areas to understand the broader regional STR landscape.
| Market | Active Properties | Monthly Revenue | Daily Rate | Avg. Occupancy |
|---|---|---|---|---|
| Fox Point | 11 | $3,816 | $263.48 | 50% |
| Boutiliers Point | 13 | $3,759 | $268.06 | 56% |
| Hammonds Plains | 13 | $3,708 | $291.82 | 50% |
| Hunts Point | 17 | $3,609 | $299.73 | 45% |
| First South | 26 | $3,083 | $187.71 | 57% |
| Feltzen South | 21 | $2,893 | $218.72 | 41% |
| Queensland | 15 | $2,763 | $242.13 | 50% |
| Halls Harbour | 15 | $2,559 | $211.80 | 52% |
| Chester Basin | 11 | $2,545 | $283.86 | 48% |
| Vaughan | 34 | $2,497 | $199.75 | 47% |