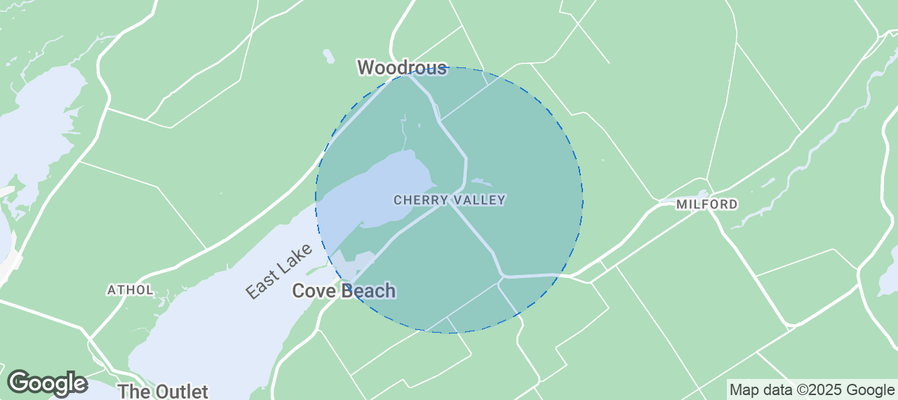
Cherry Valley Airbnb Market Analysis 2026: Short Term Rental Data & Vacation Rental Statistics in Ontario, Canada
Is Airbnb profitable in Cherry Valley in 2026? Explore comprehensive Airbnb analytics for Cherry Valley, Ontario, Canada to uncover income potential. This 2026 STR market report for Cherry Valley, based on AirROI data from February 2025 to January 2026, reveals key trends in the niche market of 20 active listings.
Whether you're considering an Airbnb investment in Cherry Valley, optimizing your existing vacation rental, or exploring rental arbitrage opportunities, understanding the Cherry Valley Airbnb data is crucial. Understanding the local regulations is key to maximizing your short term rental income potential. Let's dive into the specifics.
Key Cherry Valley Airbnb Performance Metrics Overview
Monthly Airbnb Revenue Variations & Income Potential in Cherry Valley (2026)
Understanding the monthly revenue variations for Airbnb listings in Cherry Valley is key to maximizing your short term rental income potential. Seasonality significantly impacts earnings. Our analysis, based on data from the past 12 months, shows that the peak revenue month for STRs in Cherry Valley is typically July, while January often presents the lowest earnings, highlighting opportunities for strategic pricing adjustments during shoulder and low seasons. Explore the typical Airbnb income in Cherry Valley across different performance tiers:
- Best-in-class properties (Top 10%) achieve $5,606+ monthly, often utilizing dynamic pricing and superior guest experiences.
- Strong performing properties (Top 25%) earn $4,048 or more, indicating effective management and desirable locations/amenities.
- Typical properties (Median) generate around $2,816 per month, representing the average market performance.
- Entry-level properties (Bottom 25%) see earnings around $1,828, often with potential for optimization.
Average Monthly Airbnb Earnings Trend in Cherry Valley
Cherry Valley Airbnb Occupancy Rate Trends (2026)
Maximize your bookings by understanding the Cherry Valley STR occupancy trends. Seasonal demand shifts significantly influence how often properties are booked. Typically, Julysees the highest demand (peak season occupancy), while January experiences the lowest (low season). Effective strategies, like adjusting minimum stays or offering promotions, can boost occupancy during slower periods. Here's how different property tiers perform in Cherry Valley:
- Best-in-class properties (Top 10%) achieve 78%+ occupancy, indicating high desirability and potentially optimized availability.
- Strong performing properties (Top 25%) maintain 64% or higher occupancy, suggesting good market fit and guest satisfaction.
- Typical properties (Median) have an occupancy rate around 48%.
- Entry-level properties (Bottom 25%) average 30% occupancy, potentially facing higher vacancy.
Average Monthly Occupancy Rate Trend in Cherry Valley
Average Daily Rate (ADR) Airbnb Trends in Cherry Valley (2026)
Effective short term rental pricing strategy in Cherry Valley involves understanding monthly ADR fluctuations. The Average Daily Rate (ADR) for Airbnb in Cherry Valley typically peaks in September and dips lowest during March. Leveraging Airbnb dynamic pricing tools or strategies based on this seasonality can significantly boost revenue. Here's a look at the typical nightly rates achieved:
- Best-in-class properties (Top 10%) command rates of $338+ per night, often due to premium features or locations.
- Strong performing properties (Top 25%) achieve nightly rates of $282 or more.
- Typical properties (Median) charge around $214 per night.
- Entry-level properties (Bottom 25%) earn around $177 per night.
Average Daily Rate (ADR) Trend by Month in Cherry Valley
Get Live Cherry Valley Market Intelligence 👇
Explore Real-time Analytics
Airbnb Seasonality Analysis & Trends in Cherry Valley (2026)
Peak Season (July, August, June)
- Revenue averages $5,941 per month
- Occupancy rates average 68.4%
- Daily rates average $261
Shoulder Season
- Revenue averages $2,814 per month
- Occupancy maintains around 48.6%
- Daily rates hold near $251
Low Season (January, February, December)
- Revenue drops to average $1,515 per month
- Occupancy decreases to average 32.8%
- Daily rates adjust to average $245
Seasonality Insights for Cherry Valley
- The Airbnb seasonality in Cherry Valley shows highly seasonal trends requiring careful strategy. While the sections above show seasonal averages, it's also insightful to look at the extremes:
- During the high season, the absolute peak month showcases Cherry Valley's highest earning potential, with monthly revenues capable of climbing to $6,996, occupancy reaching a high of 81.2%, and ADRs peaking at $264.
- Conversely, the slowest single month of the year, typically falling within the low season, marks the market's lowest point. In this month, revenue might dip to $853, occupancy could drop to 24.7%, and ADRs may adjust down to $241.
- Understanding both the seasonal averages and these monthly peaks and troughs in revenue, occupancy, and ADR is crucial for maximizing your Airbnb profit potential in Cherry Valley.
Seasonal Strategies for Maximizing Profit
- Peak Season: Maximize revenue through premium pricing and potentially longer minimum stays. Ensure high availability.
- Low Season: Offer competitive pricing, special promotions (e.g., extended stay discounts), and flexible cancellation policies. Target off-season travelers like remote workers or budget-conscious guests.
- Shoulder Seasons: Implement dynamic pricing that balances peak and low rates. Target weekend travelers or specific events. Offer slightly more flexible terms than peak season.
- Regularly analyze your own performance against these Cherry Valley seasonality benchmarks and adjust your pricing and availability strategy accordingly.
Best Areas for Airbnb Investment in Cherry Valley (2026)
Exploring the top neighborhoods for short-term rentals in Cherry Valley? This section highlights key areas, outlining why they are attractive for hosts and guests, along with notable local attractions. Consider these locations based on your target guest profile and investment strategy.
| Neighborhood / Area | Why Host Here? (Target Guests & Appeal) | Key Attractions & Landmarks |
|---|---|---|
| Cherry Valley Beach | A serene lakeside area known for its beautiful beach and recreational activities. Ideal for visitors looking to relax and enjoy water sports in a tranquil environment. | Cherry Valley Beach, Sandbanks Provincial Park, Lake Ontario, Kayaking and canoeing, Camping sites |
| Picton | A charming town nearby with boutique shops, restaurants, and a vibrant arts scene. Great for tourists seeking a local experience and access to wineries in the area. | Picton Main Street, The Regent Theatre, Wellington Heritage Museum, Local wineries, Picton Harbour |
| Sandbanks Provincial Park | Famous for its stunning sand dunes and beautiful beaches. Highly sought after in summer, perfect for outdoor activities and camping. | Sandbanks Beach, Dunes Trails, Wellington Beach, Windsurfing and swimming, Camping facilities |
| Wellington | A quaint village known for its thriving arts community and local wines. Appeals to tourists looking for a unique culinary and cultural experience. | Wellington Craft Brewery, Restaurants and cafes, Long Beach, Vineyards and wineries, Wellington Park |
| North Beach | A popular family-friendly beach area with shallow waters and sandy shores. Ideal for families and tourists seeking a relaxing beach vacation. | North Beach Provincial Park, Swimming and picnicking, Nature trails, Soft sandy beach, Bird watching opportunities |
| Ameliasburgh | A peaceful rural area with picturesque landscapes and a close-knit community. Perfect for visitors wanting to escape the hustle and bustle and enjoy local nature. | Ameliasburgh Historical Museum, Countryside Tours, Scenic hiking trails, Local farms, Biking paths |
| Merrill Road | A quiet residential area close to the water, offering a cozy atmosphere for guests looking for a home-like stay while exploring the region. | Tranquil environment, Access to nature trails, Close proximity to wineries, Friendly community, Nearby beaches |
| Sophiasburgh | A rural area rich in history and natural beauty. Great for those interested in outdoor adventures and exploring the countryside. | Historical sites, Biking and hiking trails, Scenic views, Art galleries, Local farms |
Understanding Airbnb License Requirements & STR Laws in Cherry Valley (2026)
With 30% of listings showing registration in 2026, understanding potential Airbnb license requirements is crucial in Cherry Valley. Always verify the latest short term rental regulations and Airbnb license requirements directly with local government authorities for Cherry Valley to ensure full compliance before hosting.
(Source: AirROI data, 2026, based on 30% licensed listings)
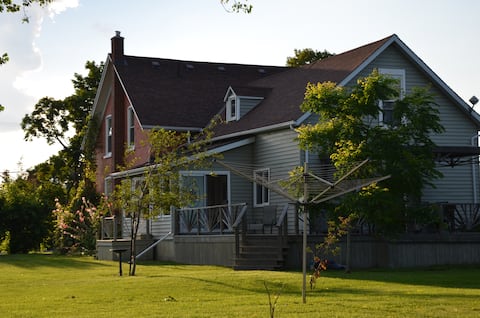
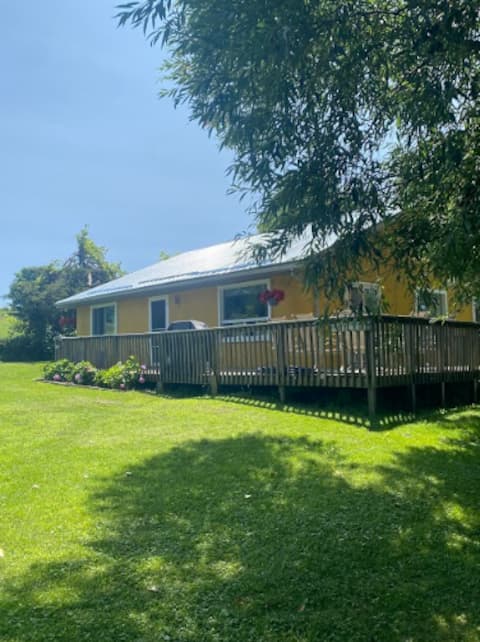
Top Performing Airbnb Properties in Cherry Valley (2026)
Benchmark your potential! Explore examples of top-performing Airbnb properties in Cherry Valleybased on Trailing Twelve Month (TTM) revenue. Analyze their characteristics, revenue, occupancy rate, and ADR to understand what drives success in this market.

Away in the County - As featured on HGTV
Entire Place • 4 bedrooms
Sandbanks at Trillium House - P.E.C. near Picton
Entire Place • 5 bedrooms
The Willow Cottage - 4 Bedroom
Entire Place • 4 bedrooms
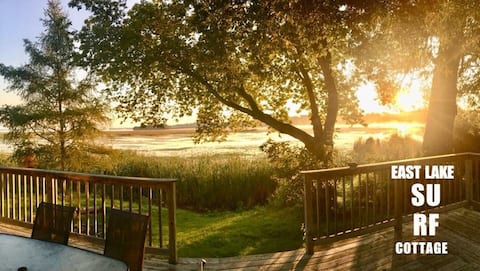
East Lake Surf Cottage - Walk to the Outlet Beach!
Entire Place • 3 bedrooms

Extended-Stay Cozy Retreat Near Sandbanks
Entire Place • 3 bedrooms
The Cherry Valley Estate
Entire Place • 3 bedrooms
Note: Performance varies based on location, size, amenities, seasonality, and management quality. Data reflects the past 12 months.
Top Performing Airbnb Hosts in Cherry Valley (2026)
Learn from the best! This table showcases top-performing Airbnb hosts in Cherry Valley based on the number of properties managed and estimated total revenue over the past year. Analyze their scale and performance metrics.
| Host Name | Properties | Grossing Revenue | Stay Reviews | Avg Rating |
|---|---|---|---|---|
| Jeff And Jenn | 2 | $72,753 | 480 | 4.84/5.0 |
| Sandbanks Tours And Experience | 1 | $61,198 | 11 | 4.91/5.0 |
| Sheila | 1 | $47,901 | 141 | 4.93/5.0 |
| Jonathan | 1 | $38,918 | 84 | 4.76/5.0 |
| Andrew | 1 | $38,510 | 185 | 4.88/5.0 |
| Ryan | 1 | $36,292 | 181 | 4.73/5.0 |
| Sally | 1 | $34,176 | 400 | 4.88/5.0 |
| Jennifer | 1 | $33,700 | 22 | 4.91/5.0 |
| Dianne And Don | 2 | $26,361 | 30 | 4.89/5.0 |
| Lesley | 1 | $23,745 | 250 | 4.94/5.0 |
Analyzing the strategies of top hosts, such as their property selection, pricing, and guest communication, can offer valuable lessons for optimizing your own Airbnb operations in Cherry Valley.
Dive Deeper: Advanced Cherry Valley STR Market Data (2026)
Ready to unlock more insights? AirROI provides access to advanced metrics and comprehensive Airbnb data for Cherry Valley. Explore detailed analytics beyond this report to refine your investment strategy, optimize pricing, and maximize your vacation rental profits.
Explore Advanced MetricsCherry Valley Short-Term Rental Market Composition (2026): Property & Room Types
Room Type Distribution
Property Type Distribution
Market Composition Insights for Cherry Valley
- The Cherry Valley Airbnb market composition is heavily skewed towards Entire Home/Apt listings, which make up 85% of the 20 active rentals. This indicates strong guest preference for privacy and space.
- Looking at the property type distribution in Cherry Valley, House properties are the most common (55%), reflecting the local real estate landscape.
- Houses represent a significant 55% portion, catering likely to families or larger groups.
- The presence of 15% Hotel/Boutique listings indicates integration with traditional hospitality.
Cherry Valley Airbnb Room Capacity Analysis (2026): Bedroom Distribution
Distribution of Listings by Number of Bedrooms
Room Capacity Insights for Cherry Valley
- The dominant room capacity in Cherry Valley is 2 bedrooms listings, making up 35% of the market. This suggests a strong demand for properties suitable for couples or solo travelers.
- Together, 2 bedrooms and 3 bedrooms properties represent 65.0% of the active Airbnb listings in Cherry Valley, indicating a high concentration in these sizes.
- A significant 45.0% of listings offer 3+ bedrooms, catering to larger groups and families seeking more space in Cherry Valley.
Cherry Valley Vacation Rental Guest Capacity Trends (2026)
Distribution of Listings by Guest Capacity
Guest Capacity Insights for Cherry Valley
- The most common guest capacity trend in Cherry Valley vacation rentals is listings accommodating 6 guests (35%). This suggests the primary traveler segment is likely larger groups.
- Properties designed for 6 guests and 4 guests dominate the Cherry Valley STR market, accounting for 60.0% of listings.
- 55.0% of properties accommodate 6+ guests, serving the market segment for larger families or group travel in Cherry Valley.
- On average, properties in Cherry Valley are equipped to host 4.8 guests.
Cherry Valley Airbnb Booking Patterns (2026): Available vs. Booked Days
Available Days Distribution
Booked Days Distribution
Booking Pattern Insights for Cherry Valley
- The most common availability pattern in Cherry Valley falls within the 271-366 days range, representing 50% of listings. This suggests many properties have significant open periods on their calendars.
- Approximately 90.0% of listings show high availability (181+ days open annually), indicating potential for increased bookings or specific owner usage patterns.
- For booked days, the 31-90 days range is most frequent in Cherry Valley (40%), reflecting common guest stay durations or potential owner blocking patterns.
- A notable 10.0% of properties secure long booking periods (181+ days booked per year), highlighting successful long-term rental strategies or significant owner usage.
Cherry Valley Airbnb Minimum Stay Requirements Analysis
Distribution of Listings by Minimum Night Requirement
2 Nights
6 listings
30% of total
3 Nights
2 listings
10% of total
4-6 Nights
3 listings
15% of total
7-29 Nights
2 listings
10% of total
30+ Nights
7 listings
35% of total
Key Insights
- The most prevalent minimum stay requirement in Cherry Valley is 30+ Nights, adopted by 35% of listings. This highlights the market's preference for longer commitments.
- A significant segment (35%) caters to monthly stays (30+ nights) in Cherry Valley, pointing to opportunities in the extended-stay market.
Recommendations
- Align with the market by considering a 30+ Nights minimum stay, as 35% of Cherry Valley hosts use this setting.
- Explore offering discounts for stays of 30+ nights to attract the 35% of the market seeking extended stays.
- Adjust minimum nights based on seasonality – potentially shorter during low season and longer during peak demand periods in Cherry Valley.
Cherry Valley Airbnb Cancellation Policy Trends Analysis (2026)
Limited
2 listings
10% of total
Flexible
2 listings
10% of total
Moderate
2 listings
10% of total
Firm
12 listings
60% of total
Strict
2 listings
10% of total
Cancellation Policy Insights for Cherry Valley
- The prevailing Airbnb cancellation policy trend in Cherry Valley is Firm, used by 60% of listings.
- A majority (70.0%) of hosts in Cherry Valley utilize Firm or Strict policies, indicating a market where hosts prioritize booking security.
Recommendations for Hosts
- Consider adopting a Firm policy to align with the 60% market standard in Cherry Valley.
- Using a Strict policy might deter some guests, as only 10% of listings use it. Evaluate if potential revenue protection outweighs possible lower booking rates.
- Regularly review your cancellation policy against competitors and market demand shifts in Cherry Valley.
Cherry Valley STR Booking Lead Time Analysis (2026)
Average Booking Lead Time by Month
Booking Lead Time Insights for Cherry Valley
- The overall average booking lead time for vacation rentals in Cherry Valley is 83 days.
- Guests book furthest in advance for stays during August (average 137 days), likely coinciding with peak travel demand or local events.
- The shortest booking windows occur for stays in March (average 29 days), indicating more last-minute travel plans during this time.
- Seasonally, Summer (112 days avg.) sees the longest lead times, while Winter (54 days avg.) has the shortest, reflecting typical travel planning cycles.
Recommendations for Hosts
- Use the overall average lead time (83 days) as a baseline for your pricing and availability strategy in Cherry Valley.
- For August stays, consider implementing length-of-stay discounts or slightly higher rates for bookings made less than 137 days out to capitalize on advance planning.
- Target marketing efforts for the Summer season well in advance (at least 112 days) to capture early planners.
- Monitor your own booking lead times against these Cherry Valley averages to identify opportunities for dynamic pricing adjustments.
Popular & Essential Airbnb Amenities in Cherry Valley (2026)
Amenity Prevalence
Amenity Insights for Cherry Valley
- Essential amenities in Cherry Valley that guests expect include: Smoke alarm, Backyard, Dishes and silverware, Coffee maker, Hot water, Refrigerator, Free parking on premises. Lacking these (any) could significantly impact bookings.
- Popular amenities like Fire extinguisher, Hangers, Patio or balcony are common but not universal. Offering these can provide a competitive edge.
Recommendations for Hosts
- Ensure your listing includes all essential amenities for Cherry Valley: Smoke alarm, Backyard, Dishes and silverware, Coffee maker, Hot water, Refrigerator, Free parking on premises.
- Prioritize adding missing essentials: Refrigerator, Free parking on premises.
- Consider adding popular differentiators like Fire extinguisher or Hangers to increase appeal.
- Highlight unique or less common amenities you offer (e.g., hot tub, dedicated workspace, EV charger) in your listing description and photos.
- Regularly check competitor amenities in Cherry Valley to stay competitive.
Cherry Valley Airbnb Guest Demographics & Profile Analysis (2026)
Guest Profile Summary for Cherry Valley
- The typical guest profile for Airbnb in Cherry Valley consists of primarily domestic travelers (92%), often arriving from nearby Toronto, typically belonging to the Post-2000s (Gen Z/Alpha) group (50%), primarily speaking English or French.
- Domestic travelers account for 92.1% of guests.
- Key international markets include Canada (92.1%) and United Kingdom (2.1%).
- Top languages spoken are English (53.5%) followed by French (29.1%).
- A significant demographic segment is the Post-2000s (Gen Z/Alpha) group, representing 50% of guests.
Recommendations for Hosts
- Target domestic marketing efforts towards travelers from Toronto and Montreal.
- Tailor amenities and listing descriptions to appeal to the dominant Post-2000s (Gen Z/Alpha) demographic (e.g., highlight fast WiFi, smart home features, local guides).
- Highlight unique local experiences or amenities relevant to the primary guest profile.
- Consider seasonal promotions aligned with peak travel times for key origin markets.
Nearby Short-Term Rental Market Comparison
How does the Cherry Valley Airbnb market stack up against its neighbors? Compare key performance metrics like average monthly revenue, ADR, and occupancy rates in surrounding areas to understand the broader regional STR landscape.
| Market | Active Properties | Monthly Revenue | Daily Rate | Avg. Occupancy |
|---|---|---|---|---|
| Town of Torrey | 34 | $5,535 | $437.35 | 50% |
| Rushville | 16 | $5,126 | $656.66 | 41% |
| Town of Mansfield | 61 | $4,782 | $517.31 | 32% |
| Town of Otisco | 22 | $4,749 | $417.83 | 43% |
| Town of Porter | 22 | $4,724 | $331.03 | 54% |
| Town of Canandaigua | 79 | $4,714 | $488.12 | 42% |
| Town of Fayette | 59 | $4,659 | $407.20 | 42% |
| Town of Skaneateles | 68 | $4,507 | $498.14 | 42% |
| Town of Varick | 34 | $4,385 | $447.56 | 43% |
| Town of Catharine | 12 | $4,308 | $488.11 | 40% |