District Municipality of Muskoka Airbnb Market Analysis 2026: Short Term Rental Data & Vacation Rental Statistics in Ontario, Canada
Is Airbnb profitable in District Municipality of Muskoka in 2026? Explore comprehensive Airbnb analytics for District Municipality of Muskoka, Ontario, Canada to uncover income potential. This 2026 STR market report for District Municipality of Muskoka, based on AirROI data from February 2025 to January 2026, reveals key trends in the niche market of 80 active listings.
Whether you're considering an Airbnb investment in District Municipality of Muskoka, optimizing your existing vacation rental, or exploring rental arbitrage opportunities, understanding the District Municipality of Muskoka Airbnb data is crucial. Leveraging the low regulation environment is key to maximizing your short term rental income potential. Let's dive into the specifics.
Key District Municipality of Muskoka Airbnb Performance Metrics Overview
Monthly Airbnb Revenue Variations & Income Potential in District Municipality of Muskoka (2026)
Understanding the monthly revenue variations for Airbnb listings in District Municipality of Muskoka is key to maximizing your short term rental income potential. Seasonality significantly impacts earnings. Our analysis, based on data from the past 12 months, shows that the peak revenue month for STRs in District Municipality of Muskoka is typically August, while January often presents the lowest earnings, highlighting opportunities for strategic pricing adjustments during shoulder and low seasons. Explore the typical Airbnb income in District Municipality of Muskoka across different performance tiers:
- Best-in-class properties (Top 10%) achieve $8,988+ monthly, often utilizing dynamic pricing and superior guest experiences.
- Strong performing properties (Top 25%) earn $6,257 or more, indicating effective management and desirable locations/amenities.
- Typical properties (Median) generate around $3,403 per month, representing the average market performance.
- Entry-level properties (Bottom 25%) see earnings around $1,281, often with potential for optimization.
Average Monthly Airbnb Earnings Trend in District Municipality of Muskoka
District Municipality of Muskoka Airbnb Occupancy Rate Trends (2026)
Maximize your bookings by understanding the District Municipality of Muskoka STR occupancy trends. Seasonal demand shifts significantly influence how often properties are booked. Typically, Augustsees the highest demand (peak season occupancy), while January experiences the lowest (low season). Effective strategies, like adjusting minimum stays or offering promotions, can boost occupancy during slower periods. Here's how different property tiers perform in District Municipality of Muskoka:
- Best-in-class properties (Top 10%) achieve 71%+ occupancy, indicating high desirability and potentially optimized availability.
- Strong performing properties (Top 25%) maintain 54% or higher occupancy, suggesting good market fit and guest satisfaction.
- Typical properties (Median) have an occupancy rate around 32%.
- Entry-level properties (Bottom 25%) average 15% occupancy, potentially facing higher vacancy.
Average Monthly Occupancy Rate Trend in District Municipality of Muskoka
Average Daily Rate (ADR) Airbnb Trends in District Municipality of Muskoka (2026)
Effective short term rental pricing strategy in District Municipality of Muskoka involves understanding monthly ADR fluctuations. The Average Daily Rate (ADR) for Airbnb in District Municipality of Muskoka typically peaks in July and dips lowest during April. Leveraging Airbnb dynamic pricing tools or strategies based on this seasonality can significantly boost revenue. Here's a look at the typical nightly rates achieved:
- Best-in-class properties (Top 10%) command rates of $574+ per night, often due to premium features or locations.
- Strong performing properties (Top 25%) achieve nightly rates of $440 or more.
- Typical properties (Median) charge around $321 per night.
- Entry-level properties (Bottom 25%) earn around $206 per night.
Average Daily Rate (ADR) Trend by Month in District Municipality of Muskoka
Get Live District Municipality of Muskoka Market Intelligence 👇

Explore Real-time Analytics
Airbnb Seasonality Analysis & Trends in District Municipality of Muskoka (2026)
Peak Season (August, July, October)
- Revenue averages $6,875 per month
- Occupancy rates average 51.4%
- Daily rates average $347
Shoulder Season
- Revenue averages $3,722 per month
- Occupancy maintains around 34.5%
- Daily rates hold near $330
Low Season (January, February, March)
- Revenue drops to average $2,611 per month
- Occupancy decreases to average 24.2%
- Daily rates adjust to average $316
Seasonality Insights for District Municipality of Muskoka
- The Airbnb seasonality in District Municipality of Muskoka shows highly seasonal trends requiring careful strategy. While the sections above show seasonal averages, it's also insightful to look at the extremes:
- During the high season, the absolute peak month showcases District Municipality of Muskoka's highest earning potential, with monthly revenues capable of climbing to $8,735, occupancy reaching a high of 61.4%, and ADRs peaking at $352.
- Conversely, the slowest single month of the year, typically falling within the low season, marks the market's lowest point. In this month, revenue might dip to $2,597, occupancy could drop to 22.2%, and ADRs may adjust down to $308.
- Understanding both the seasonal averages and these monthly peaks and troughs in revenue, occupancy, and ADR is crucial for maximizing your Airbnb profit potential in District Municipality of Muskoka.
Seasonal Strategies for Maximizing Profit
- Peak Season: Maximize revenue through premium pricing and potentially longer minimum stays. Ensure high availability.
- Low Season: Offer competitive pricing, special promotions (e.g., extended stay discounts), and flexible cancellation policies. Target off-season travelers like remote workers or budget-conscious guests.
- Shoulder Seasons: Implement dynamic pricing that balances peak and low rates. Target weekend travelers or specific events. Offer slightly more flexible terms than peak season.
- Regularly analyze your own performance against these District Municipality of Muskoka seasonality benchmarks and adjust your pricing and availability strategy accordingly.
Best Areas for Airbnb Investment in District Municipality of Muskoka (2026)
Exploring the top neighborhoods for short-term rentals in District Municipality of Muskoka? This section highlights key areas, outlining why they are attractive for hosts and guests, along with notable local attractions. Consider these locations based on your target guest profile and investment strategy.
| Neighborhood / Area | Why Host Here? (Target Guests & Appeal) | Key Attractions & Landmarks |
|---|---|---|
| Bracebridge | The largest town in Muskoka, Bracebridge offers a mix of outdoor activities and urban amenities. It is a popular tourist destination, especially in the summer, due to its proximity to lakes and parks. | Bracebridge Falls, Woodchester Villa, High Falls, Santa's Village, Birch Hollow |
| Gravenhurst | Known as the 'Gateway to Muskoka', Gravenhurst provides access to numerous lakes and is home to the historic steamships on Lake Muskoka. It attracts visitors interested in lakeside activities. | Muskoka Wharf, The Gravenhurst Opera House, Lake Muskoka, Gull Lake Park, The SS Bigwin |
| Huntsville | A vibrant town with access to Algonquin Provincial Park, Huntsville is popular among outdoor enthusiasts and offers winter sports, hiking, and beautiful fall colors. | Algonquin Park, Hidden Valley Resort, Huntsville Festival of the Arts, Muskoka Heritage Place, Mary Lake |
| Lake of Bays | A picturesque area known for its stunning lakes and outdoor recreational opportunities. It offers a tranquil setting for visitors looking for nature and relaxation. | Lake of Bays, Oxtongue River-Ragged Falls Provincial Park, Huckleberry Rock Lookout, Dorset Lookout Tower, The Bigwin Inn |
| Port Carling | Often called the 'Hub of the Lakes', Port Carling is known for its charming waterfront and several boat launches. It attracts boating enthusiasts and vacationers looking for a lakefront experience. | The Muskoka Lakes Museum, Public Boat Launch, Port Carling Locks, Muskoka Lake, Big Chief Island |
| Mactier | A small but charming town on the shores of Lake Joseph, Mactier is perfect for those looking for a quiet retreat while still being close to popular Muskoka attractions. | Lake Joseph, Mactier Marina, The Muskoka Lakes Golf Course, Local boutiques, Nearby hiking trails |
| Kawagama Lake | This is a more secluded area known for its natural beauty and outdoor activities. It draws visitors looking for peace and nature away from busier tourist spots. | Kawagama Lake, Local fishing spots, Scenic hiking trails, Quiet beaches, Canoeing |
| Rosseau | A quaint village known for its beautiful lakes and upscale cottages. It has a rich history and attracts visitors looking for a luxury cottage experience in Muskoka. | Lake Rosseau, Rosseau Village, The Rosseau Inn, Cottage country charm, Dining at local restaurants |
Understanding Airbnb License Requirements & STR Laws in District Municipality of Muskoka (2026)
While District Municipality of Muskoka, Ontario, Canada currently shows low STR regulations, specific Airbnb license requirements might still exist or change. Always verify the latest short term rental regulations and Airbnb license requirements directly with local government authorities for District Municipality of Muskoka to ensure full compliance before hosting.
(Source: AirROI data, 2026, based on 6% licensed listings)
Top Performing Airbnb Properties in District Municipality of Muskoka (2026)
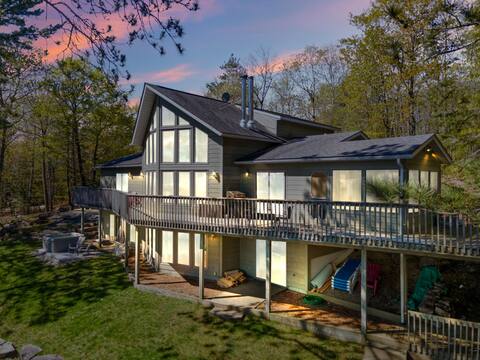
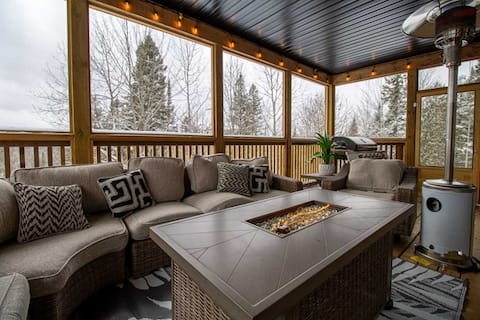
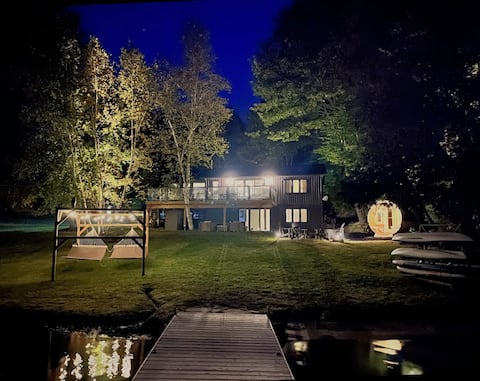
Benchmark your potential! Explore examples of top-performing Airbnb properties in District Municipality of Muskokabased on Trailing Twelve Month (TTM) revenue. Analyze their characteristics, revenue, occupancy rate, and ADR to understand what drives success in this market.
Getaway Cottage LAKE FRONT Muskoka Room Kayaks!
Entire Place • 6 bedrooms
Northern Lights-Musk Hills-4BR, AC, HotTub & Sauna
Entire Place • 4 bedrooms
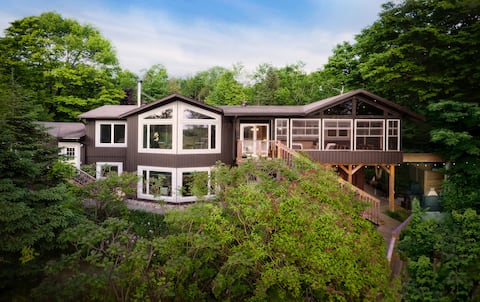
Luxury Lake House, Hot Tub, Sauna, Ski Hill
Entire Place • 5 bedrooms
Lakeside Muskoka Haven: Premium Cottage with Sauna
Entire Place • 4 bedrooms
Lily's Lake House - Luxury Muskoka Cottage
Entire Place • 3 bedrooms

Luxury Muskoka Lakefront Property & Sunset Views
Entire Place • 5 bedrooms
Note: Performance varies based on location, size, amenities, seasonality, and management quality. Data reflects the past 12 months.
Top Performing Airbnb Hosts in District Municipality of Muskoka (2026)
Learn from the best! This table showcases top-performing Airbnb hosts in District Municipality of Muskoka based on the number of properties managed and estimated total revenue over the past year. Analyze their scale and performance metrics.
| Host Name | Properties | Grossing Revenue | Stay Reviews | Avg Rating |
|---|---|---|---|---|
| CottageLINK Rental | 2 | $186,922 | 48 | 4.67/5.0 |
| Matthew | 1 | $159,340 | 118 | 4.74/5.0 |
| Laura | 1 | $120,122 | 50 | 4.96/5.0 |
| LakesideMuskokaHaven | 1 | $96,808 | 11 | 5.00/5.0 |
| Delia | 1 | $93,693 | 79 | 4.94/5.0 |
| Asif | 1 | $84,872 | 48 | 4.90/5.0 |
| Mike And Elaine | 1 | $78,682 | 145 | 4.99/5.0 |
| Joanne | 1 | $78,527 | 136 | 4.99/5.0 |
| Douglas Blair | 1 | $77,427 | 62 | 5.00/5.0 |
| Cottage Vacations | 2 | $73,376 | 4 | 4.67/5.0 |
Analyzing the strategies of top hosts, such as their property selection, pricing, and guest communication, can offer valuable lessons for optimizing your own Airbnb operations in District Municipality of Muskoka.
Dive Deeper: Advanced District Municipality of Muskoka STR Market Data (2026)
Ready to unlock more insights? AirROI provides access to advanced metrics and comprehensive Airbnb data for District Municipality of Muskoka. Explore detailed analytics beyond this report to refine your investment strategy, optimize pricing, and maximize your vacation rental profits.
Explore Advanced MetricsDistrict Municipality of Muskoka Short-Term Rental Market Composition (2026): Property & Room Types
Room Type Distribution
Property Type Distribution
Market Composition Insights for District Municipality of Muskoka
- The District Municipality of Muskoka Airbnb market composition is heavily skewed towards Entire Home/Apt listings, which make up 95% of the 80 active rentals. This indicates strong guest preference for privacy and space.
- Looking at the property type distribution in District Municipality of Muskoka, House properties are the most common (66.3%), reflecting the local real estate landscape.
- Houses represent a significant 66.3% portion, catering likely to families or larger groups.
- Smaller segments like hotel/boutique, unique stays (combined 5.1%) offer potential for unique stay experiences.
District Municipality of Muskoka Airbnb Room Capacity Analysis (2026): Bedroom Distribution
Distribution of Listings by Number of Bedrooms
Room Capacity Insights for District Municipality of Muskoka
- The dominant room capacity in District Municipality of Muskoka is 3 bedrooms listings, making up 31.3% of the market. This suggests a strong demand for properties suitable for families or small groups.
- Together, 3 bedrooms and 5+ bedrooms properties represent 51.3% of the active Airbnb listings in District Municipality of Muskoka, indicating a high concentration in these sizes.
- A significant 68.8% of listings offer 3+ bedrooms, catering to larger groups and families seeking more space in District Municipality of Muskoka.
District Municipality of Muskoka Vacation Rental Guest Capacity Trends (2026)
Distribution of Listings by Guest Capacity
Guest Capacity Insights for District Municipality of Muskoka
- The most common guest capacity trend in District Municipality of Muskoka vacation rentals is listings accommodating 8+ guests (43.8%). This suggests the primary traveler segment is likely larger groups.
- Properties designed for 8+ guests and 6 guests dominate the District Municipality of Muskoka STR market, accounting for 83.8% of listings.
- 83.8% of properties accommodate 6+ guests, serving the market segment for larger families or group travel in District Municipality of Muskoka.
- On average, properties in District Municipality of Muskoka are equipped to host 6.5 guests.
District Municipality of Muskoka Airbnb Booking Patterns (2026): Available vs. Booked Days
Available Days Distribution
Booked Days Distribution
Booking Pattern Insights for District Municipality of Muskoka
- The most common availability pattern in District Municipality of Muskoka falls within the 271-366 days range, representing 63.7% of listings. This suggests many properties have significant open periods on their calendars.
- Approximately 91.2% of listings show high availability (181+ days open annually), indicating potential for increased bookings or specific owner usage patterns.
- For booked days, the 31-90 days range is most frequent in District Municipality of Muskoka (35%), reflecting common guest stay durations or potential owner blocking patterns.
- A notable 10.1% of properties secure long booking periods (181+ days booked per year), highlighting successful long-term rental strategies or significant owner usage.
District Municipality of Muskoka Airbnb Minimum Stay Requirements Analysis
Distribution of Listings by Minimum Night Requirement
1 Night
5 listings
6.3% of total
2 Nights
6 listings
7.5% of total
3 Nights
5 listings
6.3% of total
4-6 Nights
7 listings
8.8% of total
7-29 Nights
2 listings
2.5% of total
30+ Nights
55 listings
68.8% of total
Key Insights
- The most prevalent minimum stay requirement in District Municipality of Muskoka is 30+ Nights, adopted by 68.8% of listings. This highlights the market's preference for longer commitments.
- Very short stays (1-2 nights) are less common (13.8%), suggesting hosts prefer slightly longer bookings to optimize turnover.
- A significant segment (68.8%) caters to monthly stays (30+ nights) in District Municipality of Muskoka, pointing to opportunities in the extended-stay market.
Recommendations
- Align with the market by considering a 30+ Nights minimum stay, as 68.8% of District Municipality of Muskoka hosts use this setting.
- If feasible, allowing 1-night stays, especially midweek or during low season, could capture last-minute bookings, as only 6.3% currently do.
- Explore offering discounts for stays of 30+ nights to attract the 68.8% of the market seeking extended stays.
- Adjust minimum nights based on seasonality – potentially shorter during low season and longer during peak demand periods in District Municipality of Muskoka.
District Municipality of Muskoka Airbnb Cancellation Policy Trends Analysis (2026)
Super Strict 60 Days
6 listings
7.6% of total
Super Strict 30 Days
4 listings
5.1% of total
Limited
2 listings
2.5% of total
Flexible
7 listings
8.9% of total
Moderate
10 listings
12.7% of total
Firm
47 listings
59.5% of total
Strict
3 listings
3.8% of total
Cancellation Policy Insights for District Municipality of Muskoka
- The prevailing Airbnb cancellation policy trend in District Municipality of Muskoka is Firm, used by 59.5% of listings.
- A majority (63.3%) of hosts in District Municipality of Muskoka utilize Firm or Strict policies, indicating a market where hosts prioritize booking security.
- Strict cancellation policies are quite rare (3.8%), potentially making listings with this policy less competitive unless justified by high demand or property type.
Recommendations for Hosts
- Consider adopting a Firm policy to align with the 59.5% market standard in District Municipality of Muskoka.
- Using a Strict policy might deter some guests, as only 3.8% of listings use it. Evaluate if potential revenue protection outweighs possible lower booking rates.
- Regularly review your cancellation policy against competitors and market demand shifts in District Municipality of Muskoka.
District Municipality of Muskoka STR Booking Lead Time Analysis (2026)
Average Booking Lead Time by Month
Booking Lead Time Insights for District Municipality of Muskoka
- The overall average booking lead time for vacation rentals in District Municipality of Muskoka is 63 days.
- Guests book furthest in advance for stays during August (average 95 days), likely coinciding with peak travel demand or local events.
- The shortest booking windows occur for stays in March (average 28 days), indicating more last-minute travel plans during this time.
- Seasonally, Summer (82 days avg.) sees the longest lead times, while Winter (44 days avg.) has the shortest, reflecting typical travel planning cycles.
Recommendations for Hosts
- Use the overall average lead time (63 days) as a baseline for your pricing and availability strategy in District Municipality of Muskoka.
- For August stays, consider implementing length-of-stay discounts or slightly higher rates for bookings made less than 95 days out to capitalize on advance planning.
- Target marketing efforts for the Summer season well in advance (at least 82 days) to capture early planners.
- Monitor your own booking lead times against these District Municipality of Muskoka averages to identify opportunities for dynamic pricing adjustments.
Popular & Essential Airbnb Amenities in District Municipality of Muskoka (2026)
Amenity Prevalence
Amenity Insights for District Municipality of Muskoka
- Popular amenities like Smoke alarm, Hot water, Kitchen are common but not universal. Offering these can provide a competitive edge.
- Warning: Wifi is not universally provided but is considered essential globally. Ensure reliable Wifi is offered.
Recommendations for Hosts
- Consider adding popular differentiators like Smoke alarm or Hot water to increase appeal.
- Highlight unique or less common amenities you offer (e.g., hot tub, dedicated workspace, EV charger) in your listing description and photos.
- Regularly check competitor amenities in District Municipality of Muskoka to stay competitive.
District Municipality of Muskoka Airbnb Guest Demographics & Profile Analysis (2026)
Guest Profile Summary for District Municipality of Muskoka
- The typical guest profile for Airbnb in District Municipality of Muskoka consists of primarily domestic travelers (85%), often arriving from nearby Toronto, typically belonging to the Post-2000s (Gen Z/Alpha) group (50%), primarily speaking English or French.
- Domestic travelers account for 85.0% of guests.
- Key international markets include Canada (85%) and United States (4.4%).
- Top languages spoken are English (62.1%) followed by French (9%).
- A significant demographic segment is the Post-2000s (Gen Z/Alpha) group, representing 50% of guests.
Recommendations for Hosts
- Target domestic marketing efforts towards travelers from Toronto and London.
- Tailor amenities and listing descriptions to appeal to the dominant Post-2000s (Gen Z/Alpha) demographic (e.g., highlight fast WiFi, smart home features, local guides).
- Highlight unique local experiences or amenities relevant to the primary guest profile.
- Consider seasonal promotions aligned with peak travel times for key origin markets.
Nearby Short-Term Rental Market Comparison
How does the District Municipality of Muskoka Airbnb market stack up against its neighbors? Compare key performance metrics like average monthly revenue, ADR, and occupancy rates in surrounding areas to understand the broader regional STR landscape.
| Market | Active Properties | Monthly Revenue | Daily Rate | Avg. Occupancy |
|---|---|---|---|---|
| McMurrich/Monteith Township | 26 | $4,491 | $414.28 | 39% |
| South River | 10 | $3,616 | $500.07 | 44% |
| Trent Lakes | 167 | $3,466 | $371.96 | 41% |
| Lake of Bays | 21 | $3,363 | $355.57 | 42% |
| McKellar Township | 45 | $3,237 | $385.77 | 40% |
| Dysart et al | 225 | $3,193 | $317.28 | 40% |
| Huntsville | 313 | $3,121 | $293.06 | 43% |
| The Blue Mountains | 654 | $3,046 | $308.26 | 37% |
| Muskoka Lakes Township | 337 | $2,968 | $438.98 | 37% |
| Severn | 158 | $2,936 | $343.99 | 39% |