Augustine Cove Airbnb Market Analysis 2026: Short Term Rental Data & Vacation Rental Statistics in Prince Edward Island, Canada
Is Airbnb profitable in Augustine Cove in 2026? Explore comprehensive Airbnb analytics for Augustine Cove, Prince Edward Island, Canada to uncover income potential. This 2026 STR market report for Augustine Cove, based on AirROI data from February 2025 to January 2026, reveals key trends in the niche market of 24 active listings.
Whether you're considering an Airbnb investment in Augustine Cove, optimizing your existing vacation rental, or exploring rental arbitrage opportunities, understanding the Augustine Cove Airbnb data is crucial. Navigating the high regulation landscape is key to maximizing your short term rental income potential. Let's dive into the specifics.
Key Augustine Cove Airbnb Performance Metrics Overview
Monthly Airbnb Revenue Variations & Income Potential in Augustine Cove (2026)
Understanding the monthly revenue variations for Airbnb listings in Augustine Cove is key to maximizing your short term rental income potential. Seasonality significantly impacts earnings. Our analysis, based on data from the past 12 months, shows that the peak revenue month for STRs in Augustine Cove is typically July, while January often presents the lowest earnings, highlighting opportunities for strategic pricing adjustments during shoulder and low seasons. Explore the typical Airbnb income in Augustine Cove across different performance tiers:
- Best-in-class properties (Top 10%) achieve $9,183+ monthly, often utilizing dynamic pricing and superior guest experiences.
- Strong performing properties (Top 25%) earn $4,529 or more, indicating effective management and desirable locations/amenities.
- Typical properties (Median) generate around $2,740 per month, representing the average market performance.
- Entry-level properties (Bottom 25%) see earnings around $1,699, often with potential for optimization.
Average Monthly Airbnb Earnings Trend in Augustine Cove
Augustine Cove Airbnb Occupancy Rate Trends (2026)
Maximize your bookings by understanding the Augustine Cove STR occupancy trends. Seasonal demand shifts significantly influence how often properties are booked. Typically, Julysees the highest demand (peak season occupancy), while December experiences the lowest (low season). Effective strategies, like adjusting minimum stays or offering promotions, can boost occupancy during slower periods. Here's how different property tiers perform in Augustine Cove:
- Best-in-class properties (Top 10%) achieve 80%+ occupancy, indicating high desirability and potentially optimized availability.
- Strong performing properties (Top 25%) maintain 59% or higher occupancy, suggesting good market fit and guest satisfaction.
- Typical properties (Median) have an occupancy rate around 41%.
- Entry-level properties (Bottom 25%) average 29% occupancy, potentially facing higher vacancy.
Average Monthly Occupancy Rate Trend in Augustine Cove
Average Daily Rate (ADR) Airbnb Trends in Augustine Cove (2026)
Effective short term rental pricing strategy in Augustine Cove involves understanding monthly ADR fluctuations. The Average Daily Rate (ADR) for Airbnb in Augustine Cove typically peaks in October and dips lowest during February. Leveraging Airbnb dynamic pricing tools or strategies based on this seasonality can significantly boost revenue. Here's a look at the typical nightly rates achieved:
- Best-in-class properties (Top 10%) command rates of $390+ per night, often due to premium features or locations.
- Strong performing properties (Top 25%) achieve nightly rates of $278 or more.
- Typical properties (Median) charge around $208 per night.
- Entry-level properties (Bottom 25%) earn around $158 per night.
Average Daily Rate (ADR) Trend by Month in Augustine Cove
Get Live Augustine Cove Market Intelligence 👇

Explore Real-time Analytics
Airbnb Seasonality Analysis & Trends in Augustine Cove (2026)
Peak Season (July, August, September)
- Revenue averages $6,139 per month
- Occupancy rates average 75.3%
- Daily rates average $239
Shoulder Season
- Revenue averages $3,662 per month
- Occupancy maintains around 39.1%
- Daily rates hold near $232
Low Season (January, March, May)
- Revenue drops to average $2,688 per month
- Occupancy decreases to average 31.7%
- Daily rates adjust to average $225
Seasonality Insights for Augustine Cove
- The Airbnb seasonality in Augustine Cove shows highly seasonal trends requiring careful strategy. While the sections above show seasonal averages, it's also insightful to look at the extremes:
- During the high season, the absolute peak month showcases Augustine Cove's highest earning potential, with monthly revenues capable of climbing to $6,907, occupancy reaching a high of 84.0%, and ADRs peaking at $255.
- Conversely, the slowest single month of the year, typically falling within the low season, marks the market's lowest point. In this month, revenue might dip to $1,885, occupancy could drop to 25.8%, and ADRs may adjust down to $209.
- Understanding both the seasonal averages and these monthly peaks and troughs in revenue, occupancy, and ADR is crucial for maximizing your Airbnb profit potential in Augustine Cove.
Seasonal Strategies for Maximizing Profit
- Peak Season: Maximize revenue through premium pricing and potentially longer minimum stays. Ensure high availability.
- Low Season: Offer competitive pricing, special promotions (e.g., extended stay discounts), and flexible cancellation policies. Target off-season travelers like remote workers or budget-conscious guests.
- Shoulder Seasons: Implement dynamic pricing that balances peak and low rates. Target weekend travelers or specific events. Offer slightly more flexible terms than peak season.
- Regularly analyze your own performance against these Augustine Cove seasonality benchmarks and adjust your pricing and availability strategy accordingly.
Best Areas for Airbnb Investment in Augustine Cove (2026)
Exploring the top neighborhoods for short-term rentals in Augustine Cove? This section highlights key areas, outlining why they are attractive for hosts and guests, along with notable local attractions. Consider these locations based on your target guest profile and investment strategy.
| Neighborhood / Area | Why Host Here? (Target Guests & Appeal) | Key Attractions & Landmarks |
|---|---|---|
| Brackley Beach | A stunning stretch of sandy beach known for its picturesque views and access to the National Park. Brackley Beach attracts tourists looking for relaxation and outdoor activities. | Brackley Beach National Park, Brackley Beach Boardwalk, Rugged coastlines, Water sports, Picnic areas |
| Cavendish | Famous for its association with Anne of Green Gables, this area draws family tourists and offers numerous attractions, making it a prime location for vacation rentals. | Green Gables House, Cavendish Beach, Cavendish Boardwalk, Avonlea Village, Golf courses |
| Charlottetown | The capital city of Prince Edward Island with a rich history and cultural scene. Popular among travelers for its theatres, restaurants, and proximity to ferry services. | Confederation Centre of the Arts, Victoria Row, Charlottetown Farmers' Market, Beaconsfield Historic House, Peake's Wharf |
| Stanley Bridge | A charming area known for its scenic views and access to both beaches and hiking trails. Ideal for guests looking for a peaceful retreat close to attractions. | Stanley Bridge Marine Facility, Lighthouses, Coastal hiking trails, Boat tours, Fishing opportunities |
| North Rustico | A picturesque fishing village with a beautiful harbor. Great for tourists wanting to experience local cuisine and ocean activities. | North Rustico Beach, Fisherman's Wharf, Local seafood restaurants, Coastal trails, Boating excursions |
| Souris | A small coastal town known for its warm community and laid-back atmosphere. A wonderful spot for island life and a gateway to various outdoor adventures. | Souris Lobster Trap, Souris Beach, King's Castle Provincial Park, Local craft shops, Fishing docks |
| Greenwich | Part of the national park with stunning landscapes and walking paths. Attracts nature enthusiasts and those seeking scenic beauty. | Greenwich Dunes Trail, National Park beaches, Sand dunes, Bird watching, Wildlife photography |
| Morell | This quaint town is ideal for guests interested in rural and seaside experiences. Close to beaches and offers a homely atmosphere for visitors. | Morell River, Local farms, Scenic countryside, Fishing spots, Community events |
Understanding Airbnb License Requirements & STR Laws in Augustine Cove (2026)
Yes, Augustine Cove, Prince Edward Island, Canada enforces high STR regulations. Obtaining a license and ensuring compliance is almost certainly required according to current 2026 STR laws. Always verify the latest short term rental regulations and Airbnb license requirements directly with local government authorities for Augustine Cove to ensure full compliance before hosting.
(Source: AirROI data, 2026, based on 83% licensed listings)
Top Performing Airbnb Properties in Augustine Cove (2026)
Benchmark your potential! Explore examples of top-performing Airbnb properties in Augustine Covebased on Trailing Twelve Month (TTM) revenue. Analyze their characteristics, revenue, occupancy rate, and ADR to understand what drives success in this market.
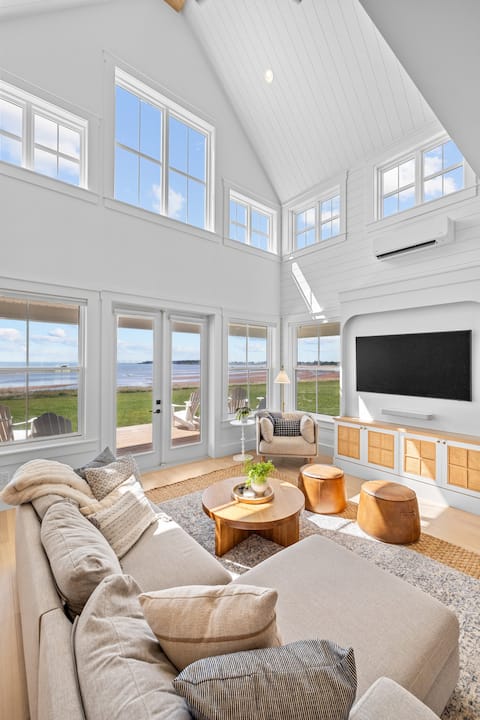
Oceanfront Sunset Beach House
Entire Place • 5 bedrooms
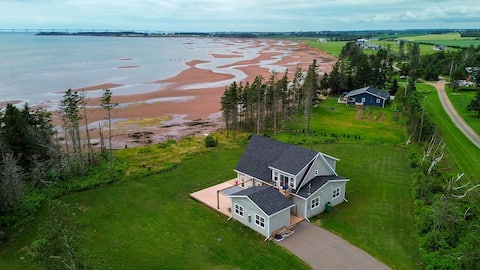
Beach House PEI
Entire Place • 5 bedrooms
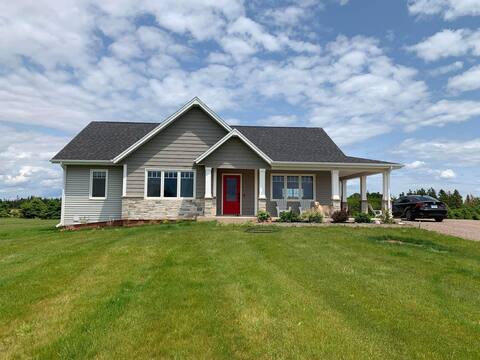
Ocean Paradise Beach House
Entire Place • 5 bedrooms

Brand-new Beachfront Getaway
Entire Place • 3 bedrooms

Sauna | Confederation Bridge Views - Sunset Point
Entire Place • 5 bedrooms

Ocean Front ,Three Bedroom Cottage
Entire Place • 3 bedrooms
Note: Performance varies based on location, size, amenities, seasonality, and management quality. Data reflects the past 12 months.
Top Performing Airbnb Hosts in Augustine Cove (2026)
Learn from the best! This table showcases top-performing Airbnb hosts in Augustine Cove based on the number of properties managed and estimated total revenue over the past year. Analyze their scale and performance metrics.
| Host Name | Properties | Grossing Revenue | Stay Reviews | Avg Rating |
|---|---|---|---|---|
| Ashley | 1 | $163,474 | 44 | 5.00/5.0 |
| Bailey | 2 | $69,866 | 49 | 4.92/5.0 |
| Michael | 1 | $53,207 | 17 | 5.00/5.0 |
| Stacey | 1 | $49,824 | 9 | 5.00/5.0 |
| Alex | 1 | $40,983 | 7 | 4.71/5.0 |
| Patricia | 1 | $37,566 | 103 | 4.95/5.0 |
| Russ | 1 | $36,697 | 31 | 5.00/5.0 |
| Katharine | 1 | $35,572 | 56 | 4.96/5.0 |
| Matt | 1 | $29,843 | 36 | 4.92/5.0 |
| Jennifer | 1 | $28,608 | 21 | 4.95/5.0 |
Analyzing the strategies of top hosts, such as their property selection, pricing, and guest communication, can offer valuable lessons for optimizing your own Airbnb operations in Augustine Cove.
Dive Deeper: Advanced Augustine Cove STR Market Data (2026)
Ready to unlock more insights? AirROI provides access to advanced metrics and comprehensive Airbnb data for Augustine Cove. Explore detailed analytics beyond this report to refine your investment strategy, optimize pricing, and maximize your vacation rental profits.
Explore Advanced MetricsAugustine Cove Short-Term Rental Market Composition (2026): Property & Room Types
Room Type Distribution
Property Type Distribution
Market Composition Insights for Augustine Cove
- The Augustine Cove Airbnb market composition is heavily skewed towards Entire Home/Apt listings, which make up 100% of the 24 active rentals. This indicates strong guest preference for privacy and space.
- Looking at the property type distribution in Augustine Cove, House properties are the most common (79.2%), reflecting the local real estate landscape.
- Houses represent a significant 79.2% portion, catering likely to families or larger groups.
Augustine Cove Airbnb Room Capacity Analysis (2026): Bedroom Distribution
Distribution of Listings by Number of Bedrooms
Room Capacity Insights for Augustine Cove
- The dominant room capacity in Augustine Cove is 2 bedrooms listings, making up 41.7% of the market. This suggests a strong demand for properties suitable for couples or solo travelers.
- Together, 2 bedrooms and 3 bedrooms properties represent 70.9% of the active Airbnb listings in Augustine Cove, indicating a high concentration in these sizes.
- A significant 54.2% of listings offer 3+ bedrooms, catering to larger groups and families seeking more space in Augustine Cove.
Augustine Cove Vacation Rental Guest Capacity Trends (2026)
Distribution of Listings by Guest Capacity
Guest Capacity Insights for Augustine Cove
- The most common guest capacity trend in Augustine Cove vacation rentals is listings accommodating 8+ guests (37.5%). This suggests the primary traveler segment is likely larger groups.
- Properties designed for 8+ guests and 4 guests dominate the Augustine Cove STR market, accounting for 62.5% of listings.
- 58.4% of properties accommodate 6+ guests, serving the market segment for larger families or group travel in Augustine Cove.
- On average, properties in Augustine Cove are equipped to host 6.0 guests.
Augustine Cove Airbnb Booking Patterns (2026): Available vs. Booked Days
Available Days Distribution
Booked Days Distribution
Booking Pattern Insights for Augustine Cove
- The most common availability pattern in Augustine Cove falls within the 181-270 days range, representing 58.3% of listings. This suggests many properties have significant open periods on their calendars.
- Approximately 91.6% of listings show high availability (181+ days open annually), indicating potential for increased bookings or specific owner usage patterns.
- For booked days, the 91-180 days range is most frequent in Augustine Cove (58.3%), reflecting common guest stay durations or potential owner blocking patterns.
- A notable 8.4% of properties secure long booking periods (181+ days booked per year), highlighting successful long-term rental strategies or significant owner usage.
Augustine Cove Airbnb Minimum Stay Requirements Analysis
Distribution of Listings by Minimum Night Requirement
3 Nights
2 listings
8.3% of total
4-6 Nights
6 listings
25% of total
7-29 Nights
2 listings
8.3% of total
30+ Nights
14 listings
58.3% of total
Key Insights
- The most prevalent minimum stay requirement in Augustine Cove is 30+ Nights, adopted by 58.3% of listings. This highlights the market's preference for longer commitments.
- A significant segment (58.3%) caters to monthly stays (30+ nights) in Augustine Cove, pointing to opportunities in the extended-stay market.
Recommendations
- Align with the market by considering a 30+ Nights minimum stay, as 58.3% of Augustine Cove hosts use this setting.
- Explore offering discounts for stays of 30+ nights to attract the 58.3% of the market seeking extended stays.
- Adjust minimum nights based on seasonality – potentially shorter during low season and longer during peak demand periods in Augustine Cove.
Augustine Cove Airbnb Cancellation Policy Trends Analysis (2026)
Flexible
1 listings
4.2% of total
Moderate
7 listings
29.2% of total
Firm
16 listings
66.7% of total
Cancellation Policy Insights for Augustine Cove
- The prevailing Airbnb cancellation policy trend in Augustine Cove is Firm, used by 66.7% of listings.
- A majority (66.7%) of hosts in Augustine Cove utilize Firm or Strict policies, indicating a market where hosts prioritize booking security.
Recommendations for Hosts
- Consider adopting a Firm policy to align with the 66.7% market standard in Augustine Cove.
- Regularly review your cancellation policy against competitors and market demand shifts in Augustine Cove.
Augustine Cove STR Booking Lead Time Analysis (2026)
Average Booking Lead Time by Month
Booking Lead Time Insights for Augustine Cove
- The overall average booking lead time for vacation rentals in Augustine Cove is 102 days.
- Guests book furthest in advance for stays during July (average 148 days), likely coinciding with peak travel demand or local events.
- The shortest booking windows occur for stays in February (average 13 days), indicating more last-minute travel plans during this time.
- Seasonally, Summer (123 days avg.) sees the longest lead times, while Winter (41 days avg.) has the shortest, reflecting typical travel planning cycles.
Recommendations for Hosts
- Use the overall average lead time (102 days) as a baseline for your pricing and availability strategy in Augustine Cove.
- For July stays, consider implementing length-of-stay discounts or slightly higher rates for bookings made less than 148 days out to capitalize on advance planning.
- During February, focus on last-minute booking availability and promotions, as guests book with very short notice (13 days avg.).
- Target marketing efforts for the Summer season well in advance (at least 123 days) to capture early planners.
- Monitor your own booking lead times against these Augustine Cove averages to identify opportunities for dynamic pricing adjustments.
Popular & Essential Airbnb Amenities in Augustine Cove (2026)
Amenity Prevalence
Amenity Insights for Augustine Cove
- Essential amenities in Augustine Cove that guests expect include: Wifi, Smoke alarm, Kitchen, Free parking on premises, Washer, TV, Fire extinguisher, Heating. Lacking these (any) could significantly impact bookings.
- Popular amenities like Hot water, Coffee maker are common but not universal. Offering these can provide a competitive edge.
Recommendations for Hosts
- Ensure your listing includes all essential amenities for Augustine Cove: Wifi, Smoke alarm, Kitchen, Free parking on premises, Washer, TV, Fire extinguisher, Heating.
- Prioritize adding missing essentials: Washer, TV, Fire extinguisher, Heating.
- Consider adding popular differentiators like Hot water or Coffee maker to increase appeal.
- Highlight unique or less common amenities you offer (e.g., hot tub, dedicated workspace, EV charger) in your listing description and photos.
- Regularly check competitor amenities in Augustine Cove to stay competitive.
Augustine Cove Airbnb Guest Demographics & Profile Analysis (2026)
Guest Profile Summary for Augustine Cove
- The typical guest profile for Airbnb in Augustine Cove consists of primarily domestic travelers (82%), often arriving from nearby Ottawa, typically belonging to the Post-2000s (Gen Z/Alpha) group (50%), primarily speaking English or French.
- Domestic travelers account for 82.2% of guests.
- Key international markets include Canada (82.2%) and United States (15.1%).
- Top languages spoken are English (64.3%) followed by French (27.4%).
- A significant demographic segment is the Post-2000s (Gen Z/Alpha) group, representing 50% of guests.
Recommendations for Hosts
- Target domestic marketing efforts towards travelers from Ottawa and Toronto.
- Tailor amenities and listing descriptions to appeal to the dominant Post-2000s (Gen Z/Alpha) demographic (e.g., highlight fast WiFi, smart home features, local guides).
- Highlight unique local experiences or amenities relevant to the primary guest profile.
- Consider seasonal promotions aligned with peak travel times for key origin markets.
Nearby Short-Term Rental Market Comparison
How does the Augustine Cove Airbnb market stack up against its neighbors? Compare key performance metrics like average monthly revenue, ADR, and occupancy rates in surrounding areas to understand the broader regional STR landscape.
| Market | Active Properties | Monthly Revenue | Daily Rate | Avg. Occupancy |
|---|---|---|---|---|
| Granville | 14 | $2,725 | $318.37 | 52% |
| Halls Harbour | 15 | $2,559 | $211.80 | 52% |
| Wentworth | 20 | $2,494 | $255.19 | 40% |
| Hillsborough | 11 | $2,478 | $153.01 | 55% |
| Port Williams | 17 | $2,452 | $260.67 | 47% |
| Bayhead | 12 | $2,397 | $250.71 | 48% |
| Oyster Bed Bridge | 12 | $2,302 | $187.23 | 60% |
| Cape Traverse | 22 | $2,288 | $298.91 | 42% |
| Rustico | 30 | $2,264 | $260.02 | 49% |
| Richibucto | 20 | $2,211 | $202.56 | 52% |