Beaconsfield Airbnb Market Analysis 2025: Short Term Rental Data & Vacation Rental Statistics in Quebec, Canada
Is Airbnb profitable in Beaconsfield in 2025? Explore comprehensive Airbnb analytics for Beaconsfield, Quebec, Canada to uncover income potential. This 2025 STR market report for Beaconsfield, based on AirROI data from July 2024 to June 2025, reveals key trends in the niche market of 19 active listings.
Whether you're considering an Airbnb investment in Beaconsfield, optimizing your existing vacation rental, or exploring rental arbitrage opportunities, understanding the Beaconsfield Airbnb data is crucial. Leveraging the low regulation environment is key to maximizing your short term rental income potential. Let's dive into the specifics.
Key Beaconsfield Airbnb Performance Metrics Overview
Monthly Airbnb Revenue Variations & Income Potential in Beaconsfield (2025)
Understanding the monthly revenue variations for Airbnb listings in Beaconsfield is key to maximizing your short term rental income potential. Seasonality significantly impacts earnings. Our analysis, based on data from the past 12 months, shows that the peak revenue month for STRs in Beaconsfield is typically December, while November often presents the lowest earnings, highlighting opportunities for strategic pricing adjustments during shoulder and low seasons. Explore the typical Airbnb income in Beaconsfield across different performance tiers:
- Best-in-class properties (Top 10%) achieve $1,606+ monthly, often utilizing dynamic pricing and superior guest experiences.
- Strong performing properties (Top 25%) earn $1,162 or more, indicating effective management and desirable locations/amenities.
- Typical properties (Median) generate around $728 per month, representing the average market performance.
- Entry-level properties (Bottom 25%) see earnings around $446, often with potential for optimization.
Average Monthly Airbnb Earnings Trend in Beaconsfield
Beaconsfield Airbnb Occupancy Rate Trends (2025)
Maximize your bookings by understanding the Beaconsfield STR occupancy trends. Seasonal demand shifts significantly influence how often properties are booked. Typically, Januarysees the highest demand (peak season occupancy), while August experiences the lowest (low season). Effective strategies, like adjusting minimum stays or offering promotions, can boost occupancy during slower periods. Here's how different property tiers perform in Beaconsfield:
- Best-in-class properties (Top 10%) achieve 76%+ occupancy, indicating high desirability and potentially optimized availability.
- Strong performing properties (Top 25%) maintain 66% or higher occupancy, suggesting good market fit and guest satisfaction.
- Typical properties (Median) have an occupancy rate around 37%.
- Entry-level properties (Bottom 25%) average 26% occupancy, potentially facing higher vacancy.
Average Monthly Occupancy Rate Trend in Beaconsfield
Average Daily Rate (ADR) Airbnb Trends in Beaconsfield (2025)
Effective short term rental pricing strategy in Beaconsfield involves understanding monthly ADR fluctuations. The Average Daily Rate (ADR) for Airbnb in Beaconsfield typically peaks in October and dips lowest during February. Leveraging Airbnb dynamic pricing tools or strategies based on this seasonality can significantly boost revenue. Here's a look at the typical nightly rates achieved:
- Best-in-class properties (Top 10%) command rates of $139+ per night, often due to premium features or locations.
- Strong performing properties (Top 25%) achieve nightly rates of $103 or more.
- Typical properties (Median) charge around $50 per night.
- Entry-level properties (Bottom 25%) earn around $32 per night.
Average Daily Rate (ADR) Trend by Month in Beaconsfield
Get Live Beaconsfield Market Intelligence 👇
Explore Real-time Analytics
Airbnb Seasonality Analysis & Trends in Beaconsfield (2025)
Peak Season (December, March, May)
- Revenue averages $1,362 per month
- Occupancy rates average 52.2%
- Daily rates average $68
Shoulder Season
- Revenue averages $882 per month
- Occupancy maintains around 44.8%
- Daily rates hold near $70
Low Season (July, August, November)
- Revenue drops to average $403 per month
- Occupancy decreases to average 26.4%
- Daily rates adjust to average $74
Seasonality Insights for Beaconsfield
- The Airbnb seasonality in Beaconsfield shows highly seasonal trends requiring careful strategy. While the sections above show seasonal averages, it's also insightful to look at the extremes:
- During the high season, the absolute peak month showcases Beaconsfield's highest earning potential, with monthly revenues capable of climbing to $1,511, occupancy reaching a high of 60.5%, and ADRs peaking at $75.
- Conversely, the slowest single month of the year, typically falling within the low season, marks the market's lowest point. In this month, revenue might dip to $376, occupancy could drop to 0.0%, and ADRs may adjust down to $59.
- Understanding both the seasonal averages and these monthly peaks and troughs in revenue, occupancy, and ADR is crucial for maximizing your Airbnb profit potential in Beaconsfield.
Seasonal Strategies for Maximizing Profit
- Peak Season: Maximize revenue through premium pricing and potentially longer minimum stays. Ensure high availability.
- Low Season: Offer competitive pricing, special promotions (e.g., extended stay discounts), and flexible cancellation policies. Target off-season travelers like remote workers or budget-conscious guests.
- Shoulder Seasons: Implement dynamic pricing that balances peak and low rates. Target weekend travelers or specific events. Offer slightly more flexible terms than peak season.
- Regularly analyze your own performance against these Beaconsfield seasonality benchmarks and adjust your pricing and availability strategy accordingly.
Best Areas for Airbnb Investment in Beaconsfield (2025)
Exploring the top neighborhoods for short-term rentals in Beaconsfield? This section highlights key areas, outlining why they are attractive for hosts and guests, along with notable local attractions. Consider these locations based on your target guest profile and investment strategy.
| Neighborhood / Area | Why Host Here? (Target Guests & Appeal) | Key Attractions & Landmarks |
|---|---|---|
| Village Centre | The heart of Beaconsfield, featuring charming shops, cafes, and community events. It's a popular spot for families and visitors who enjoy a quaint neighborhood feel. | Beaconsfield Golf Club, Centennial Park, Beaconsfield's historic buildings, local boutiques, community festivals |
| L'Île-Perrot | A scenic area just a short drive from Beaconsfield, ideal for those looking for waterfront views and outdoor activities. Great for vacationers seeking a relaxing getaway. | Île-Perrot Beaches, Nature parks, Hiking trails, Water sports, Restaurants with terrace views |
| Beaconsfield Park | A neighborhood known for its large green spaces and family-friendly atmosphere. Attracts families looking for spacious accommodations near parks and recreational facilities. | Beaconsfield Park, Brynhurst Park, Outdoor sports facilities, Playground areas, Community events |
| Pointe-Claire | Close to Beaconsfield, this area offers shopping, dining, and lakeside attractions. A perfect blend of suburban tranquility and urban conveniences. | Fairview Pointe-Claire Shopping Centre, Lakeside attractions, Pointe-Claire Village, Parks and waterfront paths, Festivals and events |
| Montreal West | A neighboring area with excellent transport links to downtown Montreal. Appeals to travelers who want quick access to urban amenities without staying in the city center. | Montreal West Train Station, Local shops and cafes, Community parks, Cultural events, Historical architecture |
| Valois Lake | A peaceful lakefront area that offers stunning views and outdoor activities. Ideal for nature lovers and those looking to relax while enjoying the beauty of nature. | Lake Valois, Walking and biking trails, Picnic areas, Fishing spots, Nature observation |
| Lachine Canal | While not directly in Beaconsfield, the Lachine Canal area is very popular and accessible, attracting tourists drawn to its activities and historical significance. | Lachine Canal bike paths, Parks along the canal, Boat rentals, Art installations, Dining along the waterfront |
| Châteauguay | Another nearby neighborhood with affordable accommodations and local charm. Offers a mix of urban and suburban experiences, appealing to budget-conscious travelers. | Châteauguay River, Local markets, Parks and historical sites, Dining options, Cultural events |
Understanding Airbnb License Requirements & STR Laws in Beaconsfield (2025)
While Beaconsfield, Quebec, Canada currently shows low STR regulations, specific Airbnb license requirements might still exist or change. Always verify the latest short term rental regulations and Airbnb license requirements directly with local government authorities for Beaconsfield to ensure full compliance before hosting.
(Source: AirROI data, 2025, finding no licensed listings among those analyzed)
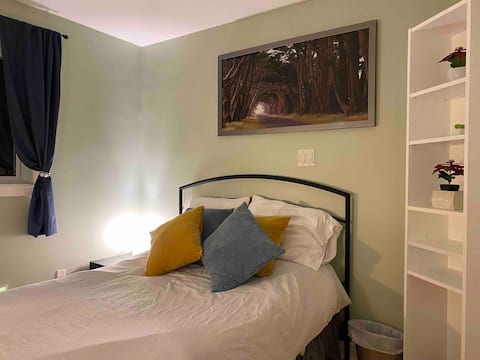
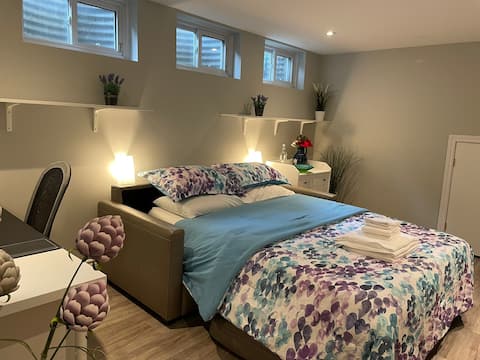
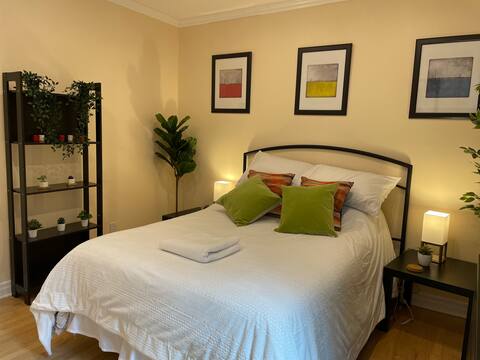
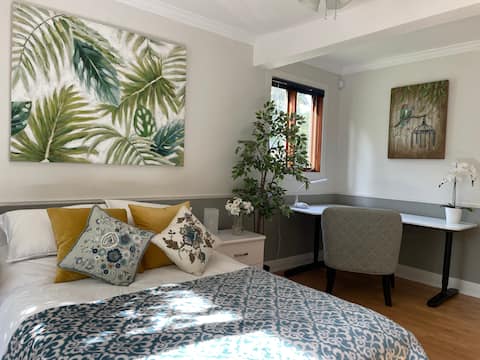
Top Performing Airbnb Properties in Beaconsfield (2025)
Benchmark your potential! Explore examples of top-performing Airbnb properties in Beaconsfieldbased on Trailing Twelve Month (TTM) revenue. Analyze their characteristics, revenue, occupancy rate, and ADR to understand what drives success in this market.

Full Moon Sanctuary - Style & Convenience Montreal
Entire Place • 1 bedroom
Cozy private bedroom with shared bathroom
Private Room • N/A

Comfy and cosy
Entire Place • 4 bedrooms
Cozy & spacious private bedroom
Private Room • N/A
Warm and welcoming private bedroom
Private Room • N/A
Stylish private bedroom full of sunshine
Private Room • N/A
Note: Performance varies based on location, size, amenities, seasonality, and management quality. Data reflects the past 12 months.
Top Performing Airbnb Hosts in Beaconsfield (2025)
Learn from the best! This table showcases top-performing Airbnb hosts in Beaconsfield based on the number of properties managed and estimated total revenue over the past year. Analyze their scale and performance metrics.
| Host Name | Properties | Grossing Revenue | Stay Reviews | Avg Rating |
|---|---|---|---|---|
| Stacy | 1 | $17,456 | 30 | 4.70/5.0 |
| Peter | 4 | $13,012 | 53 | 4.91/5.0 |
| Na | 3 | $7,856 | 21 | 4.97/5.0 |
| Jean | 1 | $5,138 | 11 | 4.55/5.0 |
| Host #206157337 | 1 | $2,226 | 1 | Not Rated |
| Host #234176235 | 1 | $2,152 | 1 | Not Rated |
| 十娘 | 4 | $1,591 | 20 | 4.12/5.0 |
| Jose | 1 | $1,174 | 3 | 5.00/5.0 |
| Jacques-Yves | 1 | $479 | 4 | 5.00/5.0 |
| Yan | 1 | $425 | 6 | 5.00/5.0 |
Analyzing the strategies of top hosts, such as their property selection, pricing, and guest communication, can offer valuable lessons for optimizing your own Airbnb operations in Beaconsfield.
Dive Deeper: Advanced Beaconsfield STR Market Data (2025)
Ready to unlock more insights? AirROI provides access to advanced metrics and comprehensive Airbnb data for Beaconsfield. Explore detailed analytics beyond this report to refine your investment strategy, optimize pricing, and maximize your vacation rental profits.
Explore Advanced MetricsBeaconsfield Short-Term Rental Market Composition (2025): Property & Room Types
Room Type Distribution
Property Type Distribution
Market Composition Insights for Beaconsfield
- The Beaconsfield Airbnb market composition is heavily skewed towards Private Room listings, which make up 63.2% of the 19 active rentals. This indicates strong guest preference for privacy and space.
- Looking at the property type distribution in Beaconsfield, House properties are the most common (84.2%), reflecting the local real estate landscape.
- Houses represent a significant 84.2% portion, catering likely to families or larger groups.
Beaconsfield Airbnb Room Capacity Analysis (2025): Bedroom Distribution
Distribution of Listings by Number of Bedrooms
Room Capacity Insights for Beaconsfield
- The dominant room capacity in Beaconsfield is 2 bedrooms listings, making up 21.1% of the market. This suggests a strong demand for properties suitable for couples or solo travelers.
- Together, 2 bedrooms and 4 bedrooms properties represent 31.6% of the active Airbnb listings in Beaconsfield, indicating a high concentration in these sizes.
Beaconsfield Vacation Rental Guest Capacity Trends (2025)
Distribution of Listings by Guest Capacity
Guest Capacity Insights for Beaconsfield
- The most common guest capacity trend in Beaconsfield vacation rentals is listings accommodating 4 guests (21.1%). This suggests the primary traveler segment is likely small families or groups.
- Properties designed for 4 guests and 8+ guests dominate the Beaconsfield STR market, accounting for 31.6% of listings.
- 10.5% of properties accommodate 6+ guests, serving the market segment for larger families or group travel in Beaconsfield.
- On average, properties in Beaconsfield are equipped to host 1.8 guests.
Beaconsfield Airbnb Booking Patterns (2025): Available vs. Booked Days
Available Days Distribution
Booked Days Distribution
Booking Pattern Insights for Beaconsfield
- The most common availability pattern in Beaconsfield falls within the 271-366 days range, representing 73.7% of listings. This suggests many properties have significant open periods on their calendars.
- Approximately 94.8% of listings show high availability (181+ days open annually), indicating potential for increased bookings or specific owner usage patterns.
- For booked days, the 1-30 days range is most frequent in Beaconsfield (63.2%), reflecting common guest stay durations or potential owner blocking patterns.
- A notable 5.3% of properties secure long booking periods (181+ days booked per year), highlighting successful long-term rental strategies or significant owner usage.
Beaconsfield Airbnb Minimum Stay Requirements Analysis
Distribution of Listings by Minimum Night Requirement
30+ Nights
18 listings
100% of total
Key Insights
- The most prevalent minimum stay requirement in Beaconsfield is 30+ Nights, adopted by 100% of listings. This highlights the market's preference for longer commitments.
- A significant segment (100%) caters to monthly stays (30+ nights) in Beaconsfield, pointing to opportunities in the extended-stay market.
Recommendations
- Align with the market by considering a 30+ Nights minimum stay, as 100% of Beaconsfield hosts use this setting.
- Explore offering discounts for stays of 30+ nights to attract the 100% of the market seeking extended stays.
- Adjust minimum nights based on seasonality – potentially shorter during low season and longer during peak demand periods in Beaconsfield.
Beaconsfield Airbnb Cancellation Policy Trends Analysis (2025)
Super Strict 30 Days
1 listings
5.9% of total
Flexible
3 listings
17.6% of total
Firm
7 listings
41.2% of total
Strict
6 listings
35.3% of total
Cancellation Policy Insights for Beaconsfield
- The prevailing Airbnb cancellation policy trend in Beaconsfield is Firm, used by 41.2% of listings.
- A majority (76.5%) of hosts in Beaconsfield utilize Firm or Strict policies, indicating a market where hosts prioritize booking security.
Recommendations for Hosts
- Consider adopting a Firm policy to align with the 41.2% market standard in Beaconsfield.
- With 35.3% using Strict terms, this is a viable option in Beaconsfield, particularly for high-value properties or during peak demand periods.
- Regularly review your cancellation policy against competitors and market demand shifts in Beaconsfield.
Beaconsfield STR Booking Lead Time Analysis (2025)
Average Booking Lead Time by Month
Booking Lead Time Insights for Beaconsfield
- The overall average booking lead time for vacation rentals in Beaconsfield is 34 days.
- Guests book furthest in advance for stays during March (average 89 days), likely coinciding with peak travel demand or local events.
- The shortest booking windows occur for stays in August (average 1 days), indicating more last-minute travel plans during this time.
- Seasonally, Spring (52 days avg.) sees the longest lead times, while Summer (14 days avg.) has the shortest, reflecting typical travel planning cycles.
Recommendations for Hosts
- Use the overall average lead time (34 days) as a baseline for your pricing and availability strategy in Beaconsfield.
- For March stays, consider implementing length-of-stay discounts or slightly higher rates for bookings made less than 89 days out to capitalize on advance planning.
- During August, focus on last-minute booking availability and promotions, as guests book with very short notice (1 days avg.).
- Target marketing efforts for the Spring season well in advance (at least 52 days) to capture early planners.
- Monitor your own booking lead times against these Beaconsfield averages to identify opportunities for dynamic pricing adjustments.
Popular & Essential Airbnb Amenities in Beaconsfield (2025)
Amenity data is currently unavailable for Beaconsfield.
Beaconsfield Airbnb Guest Demographics & Profile Analysis (2025)
Guest Profile Summary for Beaconsfield
- The typical guest profile for Airbnb in Beaconsfield consists of a mix of domestic (58%) and international guests, often arriving from nearby Montreal, typically belonging to the Post-2000s (Gen Z/Alpha) group (50%), primarily speaking English or French.
- Domestic travelers account for 57.7% of guests.
- Key international markets include Canada (57.7%) and United States (11.5%).
- Top languages spoken are English (43.2%) followed by French (31.8%).
- A significant demographic segment is the Post-2000s (Gen Z/Alpha) group, representing 50% of guests.
Recommendations for Hosts
- Balance marketing efforts between domestic and international channels based on the guest mix.
- Tailor amenities and listing descriptions to appeal to the dominant Post-2000s (Gen Z/Alpha) demographic (e.g., highlight fast WiFi, smart home features, local guides).
- Highlight unique local experiences or amenities relevant to the primary guest profile.
- Consider seasonal promotions aligned with peak travel times for key origin markets.
Nearby Short-Term Rental Market Comparison
How does the Beaconsfield Airbnb market stack up against its neighbors? Compare key performance metrics like average monthly revenue, ADR, and occupancy rates in surrounding areas to understand the broader regional STR landscape.
| Market | Active Properties | Monthly Revenue | Daily Rate | Avg. Occupancy |
|---|---|---|---|---|
| Topsham | 10 | $5,450 | $354.55 | 50% |
| Mille-Isles | 88 | $5,097 | $443.04 | 40% |
| Stowe | 847 | $4,714 | $512.51 | 41% |
| Malletts Bay | 48 | $4,568 | $421.07 | 43% |
| Waterloo | 11 | $4,404 | $370.50 | 34% |
| Wilmington | 125 | $4,233 | $322.15 | 44% |
| Calais | 17 | $3,926 | $352.77 | 44% |
| Grenville-sur-la-Rouge | 32 | $3,893 | $380.32 | 39% |
| Jericho | 24 | $3,831 | $287.38 | 53% |
| Morristown | 117 | $3,775 | $318.03 | 44% |