Montreal, Quebec Airbnb Market Data 2026: STR Report & Statistics
How much can you earn on Airbnb in Montreal, Quebec? Based on AirROI's 2026 dataset (July 2025 – June 2026), the short answer is $21,204 per year — at a $164 nightly rate, 47.6% occupancy, and a $84 RevPAR that reflects moderate rate-to-revenue efficiency with room to optimize.
Montreal's 7,044 active listings and moderate demand with room for well-positioned listings to outperform make it a major short-term rental market. Supply grew 22.3% and nightly rates have risen, creating an environment where the most bookable listings stand to capture outsized share. Hosts who pair competitive pricing with strong guest experience are well-positioned to convert the growing traveler base into consistent bookings.
Regulation is high and 67% of listings show active registration — compliance is the cost of entry. For data-driven hosts, the opportunity lies in reading these signals and positioning accordingly.

Table of Contents [hide] [show]
What Are the Key Airbnb Metrics in Montreal?
In Montreal, the headline Airbnb metrics are $21,204 in average annual revenue,47.6% occupancy, $164 ADR, and $84 in RevPAR, and guests book about 50 days in advance.
How Much Do Airbnb Hosts Earn Monthly in Montreal?
Understanding the monthly revenue variations for Airbnb listings in Montreal is key to maximizing your short term rental income potential. Seasonality significantly impacts earnings. Our analysis, based on data from the past 12 months, shows that the peak revenue month for STRs in Montreal is typically August, while January often presents the lowest earnings, highlighting opportunities for strategic pricing adjustments during shoulder and low seasons. Explore the typical Airbnb income in Montreal across different performance tiers:
- Best-in-class properties (Top 10%) achieve $5,933+ monthly, often utilizing dynamic pricing and superior guest experiences.
- Strong performing properties (Top 25%) earn $3,751 or more, indicating effective management and desirable locations/amenities.
- Typical properties (Median) generate around $2,101 per month, representing the average market performance.
- Entry-level properties (Bottom 25%) see earnings around $953, often with potential for optimization.
Average Monthly Airbnb Earnings Trend in Montreal
What Is the Monthly Airbnb Occupancy Rate in Montreal?
Maximize your bookings by understanding the Montreal STR occupancy trends. Seasonal demand shifts significantly influence how often properties are booked. Typically, Augustsees the highest demand (peak season occupancy), while June experiences the lowest (low season). Effective strategies, like adjusting minimum stays or offering promotions, can boost occupancy during slower periods. Here's how different property tiers perform in Montreal:
- Best-in-class properties (Top 10%) achieve 87%+ occupancy, indicating high desirability and potentially optimized availability.
- Strong performing properties (Top 25%) maintain 73% or higher occupancy, suggesting good market fit and guest satisfaction.
- Typical properties (Median) have an occupancy rate around 52%.
- Entry-level properties (Bottom 25%) average 26% occupancy, potentially facing higher vacancy.
Average Monthly Occupancy Rate Trend in Montreal
What Is the Average Airbnb Nightly Rate in Montreal?
Effective short term rental pricing strategy in Montreal involves understanding monthly ADR fluctuations. The Average Daily Rate (ADR) for Airbnb in Montreal typically peaks in May and dips lowest during January. Leveraging Airbnb dynamic pricing tools or strategies based on this seasonality can significantly boost revenue. Here's a look at the typical nightly rates achieved:
- Best-in-class properties (Top 10%) command rates of $302+ per night, often due to premium features or locations.
- Strong performing properties (Top 25%) achieve nightly rates of $188 or more.
- Typical properties (Median) charge around $112 per night.
- Entry-level properties (Bottom 25%) earn around $67 per night.
Average Daily Rate (ADR) Trend by Month in Montreal
What Is the RevPAR for Airbnb in Montreal?
RevPAR in Montreal is currently $84. Because RevPAR combines nightly rates with realized occupancy, it is one of the cleanest ways to compare how efficiently listings turn demand into revenue across the market.
- Entry-level properties (Bottom 25%) see $33 RevPAR.
- Typical properties (Median) generate $62 RevPAR.
- Strong performers (Top 25%) earn $107 RevPAR.
- Best-in-class (Top 10%) achieve $169 RevPAR.
Average Monthly RevPAR Trend in Montreal
RevPAR Insights for Montreal
- The average RevPAR in Montreal is $84. This metric combines nightly rates with realized occupancy, making it one of the best single-number indicators of market efficiency.
- The gap between the top 10% ($169) and bottom 25% ($33) is $136, indicating significant performance disparity driven by property quality, pricing strategy, and location.
- RevPAR peaks in Aug and bottoms out in Jan, mirroring the broader seasonal demand pattern and suggesting opportunities for dynamic pricing.
Recommendations for Hosts
- Track your own RevPAR monthly against these Montreal benchmarks. If your RevPAR falls below the median of $62, examine whether low occupancy or low ADR is the primary drag.
- Top-quartile listings achieve $107+ RevPAR through a combination of competitive pricing, strong reviews, and strategic amenities. Target this tier through incremental improvements.
- Use RevPAR rather than revenue alone when comparing properties of different sizes — it normalizes for available nights and gives a more accurate picture of performance.
Get Live Montreal Market Intelligence 👇
Explore Real-time Analytics
When Is the Peak Season for Airbnb in Montreal?
Montreal's peak Airbnb season falls in August, May, July, while the softest stretch is January, February, November. Overall, the market shows highly seasonal trends requiring careful strategy, which should guide pricing, minimum stays, and cash-flow planning.
Peak Season (August, May, July)
- Revenue averages $4,104 per month
- Occupancy rates average 56.4%
- Daily rates average $183
Shoulder Season
- Revenue averages $2,761 per month
- Occupancy maintains around 49.5%
- Daily rates hold near $156
Low Season (January, February, November)
- Revenue drops to average $1,927 per month
- Occupancy decreases to average 44.6%
- Daily rates adjust to average $134
Seasonality Insights for Montreal
- Airbnb seasonality in Montreal is pronounced. Revenue swings sharply between peak and low months, which means pricing strategy, minimum-stay settings, and cash reserves all need to account for extended slower periods.
- During the high season, the absolute peak month showcases Montreal's highest earning potential, with monthly revenues climbing to $4,235, occupancy reaching 61.7%, and ADRs peaking at $206.
- Conversely, the slowest single month marks the market's lowest point — revenue may dip to $1,685, occupancy could drop to 39.6%, and ADRs may adjust to $131.
- Understanding both the seasonal averages and these monthly peaks and troughs in revenue, occupancy, and ADR is crucial for maximizing your Airbnb profit potential in Montreal.
Seasonal Strategies for Maximizing Profit
- Peak Season: Maximize revenue through premium pricing. In a high-regulation market like Montreal, ensure your permit covers the number of nights you plan to book — some jurisdictions cap annual rental days.
- Low Season: Offer competitive pricing, extended-stay discounts, and flexible cancellation policies. Target off-season travelers like remote workers, budget-conscious guests, and travelers with flexible schedules.
- Shoulder Seasons: Implement dynamic pricing that bridges peak and low rates. Target weekend travelers, local events, and business visitors. Slightly more flexible terms than peak season can help maintain occupancy without deep discounting.
- In a highly seasonal market like Montreal, building a cash reserve during the top months is essential for covering fixed costs during the slow period. Automated pricing tools can help capture demand shifts in real time.
Do You Need a License for Airbnb in Montreal?
Yes, Montreal, Quebec, Canada enforces high STR regulations and 67% of active listings show registration evidence — indicating that enforcement is active and compliance is a prerequisite for operating legally. Hosts entering this market should budget for permit fees, inspections, and potential occupancy tax obligations as part of their startup costs. Always verify the latest short-term rental regulations and Airbnb license requirements directly with local government authorities for Montreal to ensure full compliance before hosting.
(Source: AirROI data, 2026, based on 67% licensed listings)
What Are the Best Neighborhoods for Airbnb in Montreal?
In a large, heavily regulated market like Montreal, neighborhood selection is one of the strongest levers for Airbnb investment performance. Zoning rules, permitting availability, and guest demand patterns can vary block by block. The 8 neighborhoods below represent areas where short-term rental activity concentrates — understanding why each one attracts guests and hosts helps investors evaluate where their property type and budget fit best.
| Neighborhood / Area | Why Host Here? (Target Guests & Appeal) | Key Attractions & Landmarks |
|---|---|---|
| Plateau-Mont-Royal | Vibrant and eclectic neighborhood known for its bohemian atmosphere, charming cafes, and artistic culture. It's popular among tourists for its unique boutiques and a plethora of dining options. | Mount Royal Park, Saint Joseph's Oratory, Rue Saint-Denis, Café Olimpico, Jean-Talon Market |
| Old Montreal | Historic district with cobblestone streets, stunning architecture, and rich history. It draws tourists for its romantic ambiance and proximity to numerous attractions. | Notre-Dame Basilica, Old Port of Montreal, Pointe-à-Callière Museum, Place Jacques-Cartier, Montreal Science Centre |
| Downtown Montreal | The bustling commercial heart of the city with a mix of skyscrapers, shops, and cultural venues. Ideal for business travelers and tourists alike. | Museum of Fine Arts, Place des Arts, McGill University, Underground City, Montreal Convention Centre |
| Mile End | Trendy neighborhood celebrated for its artistic vibe and lively community. Attracts young travelers looking for local culture and unique experiences. | Fairmount Bagel, St. Viateur Bagel, Parc Lafontaine, Montreal's Jewish Quarter, Galleries and music venues |
| Little Italy | Rich in Italian culture and heritage, it's famous for its vibrant cafes and the iconic Church of the Madonna della Difesa. It's perfect for food lovers and culture enthusiasts. | Church of the Madonna della Difesa, Cafe Fiorellino, Little Italy Market, Piazza Dante, Bottega |
| Griffintown | An up-and-coming area known for its modern condos and proximity to the waterfront. It appeals to young professionals and those looking for a trendy urban lifestyle. | Lachine Canal, Atwater Market, Restaurants and bars, Modern art galleries, High-end shopping |
| Parc-Extension | Diverse and multicultural neighborhood with an array of authentic cuisines. It's gaining popularity for its affordability and community feel. | Parc Jarry, Boulangerie Pâtisserie Mohammedi, Community arts events, Local eateries, Multicultural festivals |
| Saint-Henri | Charming area revitalized by young families and creatives. It's close to the Lachine Canal and offers a mix of old and new Montreal. | Lachine Canal, Atwater Market, Parc Saint-Henri, Bistros and cafes, Vintage shops |
Because Montreal has a high regulation profile, confirming that short-term rental permits are available in your target neighborhood is a critical first step before committing to a property purchase. Regulation can vary at the neighborhood or district level even within the same city.
What Types of Properties Are on Airbnb in Montreal?
Room Type Distribution
Property Type Distribution
Market Composition Insights for Montreal
- The Montreal Airbnb market composition is heavily skewed towards Entire Home/Apt listings, which make up 85% of the 7,044 active rentals. This indicates strong guest preference for privacy and space.
- Looking at the property type distribution in Montreal, Apartment/Condo properties are the most common (87.5%), reflecting the local real estate landscape.
- Smaller segments like hotel/boutique, others, unique stays (combined 4.7%) offer potential for unique stay experiences.
Montreal Airbnb Room Capacity Analysis (2026): Bedroom Distribution
Distribution of Listings by Number of Bedrooms
Room Capacity Insights for Montreal
- The dominant room capacity in Montreal is 1 bedroom listings, making up 40.6% of the market. This suggests a strong demand for properties suitable for couples or solo travelers.
- Together, 1 bedroom and 2 bedrooms properties represent 64.8% of the active Airbnb listings in Montreal, indicating a high concentration in these sizes.
Montreal Vacation Rental Guest Capacity Trends (2026)
Distribution of Listings by Guest Capacity
Guest Capacity Insights for Montreal
- The most common guest capacity trend in Montreal vacation rentals is listings accommodating 2 guests (30.9%). This suggests the primary traveler segment is likely couples or solo travelers.
- Properties designed for 2 guests and 4 guests dominate the Montreal STR market, accounting for 52.7% of listings.
- 24.0% of properties accommodate 6+ guests, serving the market segment for larger families or group travel in Montreal.
- On average, properties in Montreal are equipped to host 3.6 guests.
How Do Listings in Montreal Compare on Quality?
Listing quality in Montreal can be approximated through presentation depth, bedroom count, and how often hosts disclose exact locations. These signals show how professionally the local supply base is merchandised.
Listing Quality Insights for Montreal
- At 22.7 photos per listing on average, Montreal hosts invest well in visual presentation. Listings with 20+ photos consistently outperform in search ranking and conversion.
- 20.9% of listings show their exact location. Lower disclosure rates can increase booking hesitation — guests want to know exactly where they are staying.
Recommendations for Hosts
- Enable exact location if possible — it removes a common source of guest uncertainty and can improve your listing's position in map-based searches.
- Use these quality indicators as a self-audit checklist. Listings that exceed the Montreal averages across all three metrics are better positioned for premium pricing.
What Amenities Do Airbnb Guests Expect in Montreal?
Amenity Prevalence
Amenity Insights for Montreal
- Essential amenities in Montreal that guests expect include: Wifi, Heating, Kitchen. Lacking these (any) could significantly impact bookings.
- Popular amenities like Smoke alarm, Hot water, TV are common but not universal. Offering these can provide a competitive edge.
Recommendations for Hosts
- Ensure your listing includes all essential amenities for Montreal: Wifi, Heating, Kitchen.
- Prioritize adding missing essentials: Wifi, Heating, Kitchen.
- Consider adding popular differentiators like Smoke alarm or Hot water to increase appeal.
- Highlight unique or less common amenities you offer (e.g., hot tub, dedicated workspace, EV charger) in your listing description and photos.
- Regularly check competitor amenities in Montreal to stay competitive.
Which Airbnb Amenities Boost Revenue in Montreal?
Not every amenity matters equally. This table focuses on the amenities most associated with higher revenue in Montreal, which makes it more useful for prioritizing upgrades than a simple popularity list alone.
| Amenity | Prevalence | Revenue With | Revenue Without | Revenue Uplift |
|---|---|---|---|---|
Air conditioning | 89.0% | $23,602 | $1,869 | 1163.1% |
TV | 89.9% | $22,752 | $7,440 | 205.8% |
Hair dryer | 84.6% | $23,514 | $8,560 | 174.7% |
Kitchen | 95.5% | $21,824 | $7,957 | 174.3% |
Cooking basics | 85.5% | $23,104 | $9,988 | 131.3% |
Shampoo | 71.5% | $25,179 | $11,214 | 124.5% |
Coffee maker | 83.0% | $23,341 | $10,766 | 116.8% |
Iron | 79.3% | $23,737 | $11,484 | 106.7% |
Noise decibel monitors on property | 3.8% | $40,356 | $20,444 | 97.4% |
Essentials | 79.1% | $23,558 | $12,310 | 91.4% |
Revenue Impact Insights for Montreal
- Air conditioning tops the revenue impact list with a 1163.1% uplift — listings with this amenity earn $23,602 vs. $1,869 without it.
- Air conditioning, TV, Hair dryer, Kitchen, Cooking basics, Coffee maker — while widespread — still correlate with meaningful revenue gains, making them table stakes rather than true differentiators.
Recommendations for Hosts
- Focus your upgrade budget on amenities in the top half of this table. Below-median amenities may improve guest experience but contribute less to revenue growth.
- Highlight revenue-impacting amenities prominently in your listing title, photos, and description — guests can't value what they don't notice.
Dive Deeper: Advanced Montreal STR Market Data (2026)
Ready to unlock more insights? AirROI provides access to advanced metrics and comprehensive Airbnb data for Montreal. Explore detailed analytics beyond this report to refine your investment strategy, optimize pricing, and maximize your vacation rental profits.
Explore Advanced MetricsMontreal Airbnb Guest Demographics & Profile Analysis (2026)
Guest Profile Summary for Montreal
- The typical guest profile for Airbnb in Montreal consists of a mix of domestic (44%) and international guests, with top international origins including United States, typically belonging to the Post-2000s (Gen Z/Alpha) group (50%), primarily speaking English or French.
- Domestic travelers account for 43.5% of guests.
- Key international markets include Canada (43.5%) and United States (34.5%).
- Top languages spoken are English (50.3%) followed by French (21.5%).
- A significant demographic segment is the Post-2000s (Gen Z/Alpha) group, representing 50% of guests.
Recommendations for Hosts
- Balance marketing efforts between domestic and international channels based on the guest mix.
- Tailor amenities and listing descriptions to appeal to the dominant Post-2000s (Gen Z/Alpha) demographic (e.g., highlight fast WiFi, smart home features, local guides).
- Highlight unique local experiences or amenities relevant to the primary guest profile.
- Consider seasonal promotions aligned with peak travel times for key origin markets.
What Are Airbnb Guest Ratings in Montreal?
Listings in Montreal average 4.72 out of 5 overall, with about 67.9 reviews per active listing and 27.8% of listings carrying the Guest Favorite badge.
Rating Breakdown by Category
Guest Rating Insights for Montreal
- An average rating of 4.72 places Montreal in solid territory. Most guests leave satisfied, though there is room for hosts to push toward the top tier.
- The strongest subcategory is Check-in (4.84), while Value (4.64) trails behind — a useful signal for hosts looking to prioritize upgrades.
- 27.8% of listings carry the Guest Favorite badge, a strong trust signal that can meaningfully lift click-through and booking rates.
Recommendations for Hosts
- Focus improvement efforts on Value — even small gains in the weakest subcategory can lift overall ratings and search ranking.
- Encourage guests to leave reviews after checkout. Listings with more reviews rank higher in search results and convert browsers into bookers more effectively.
- With only 27.8% of listings earning Guest Favorite status, hosts who consistently exceed expectations have a clear competitive advantage.
Montreal Airbnb Booking Patterns (2026): Available vs. Booked Days
Available Days Distribution
Booked Days Distribution
Booking Pattern Insights for Montreal
- The most common availability pattern in Montreal falls within the 271-366 days range, representing 48.3% of listings. This suggests many properties have significant open periods on their calendars.
- Approximately 77.9% of listings show high availability (181+ days open annually), indicating potential for increased bookings or specific owner usage patterns.
- For booked days, the 91-180 days range is most frequent in Montreal (30.3%), reflecting common guest stay durations or potential owner blocking patterns.
- A notable 23.0% of properties secure long booking periods (181+ days booked per year), highlighting successful long-term rental strategies or significant owner usage.
How Far in Advance Do Guests Book Airbnb in Montreal?
Average Booking Lead Time by Month
Booking Lead Time Insights for Montreal
- The overall average booking lead time for vacation rentals in Montreal is 50 days.
- Guests book furthest in advance for stays during May (average 74 days), likely coinciding with peak travel demand or local events.
- The shortest booking windows occur for stays in January (average 29 days), indicating more last-minute travel plans during this time.
- Seasonally, Summer (55 days avg.) sees the longest lead times, while Winter (31 days avg.) has the shortest, reflecting typical travel planning cycles.
Recommendations for Hosts
- Use the overall average lead time (50 days) as a baseline for your pricing and availability strategy in Montreal.
- For May stays, consider implementing length-of-stay discounts or slightly higher rates for bookings made less than 74 days out to capitalize on advance planning.
- Target marketing efforts for the Summer season well in advance (at least 55 days) to capture early planners.
- Monitor your own booking lead times against these Montreal averages to identify opportunities for dynamic pricing adjustments.
What Is the Average Length of Stay for Airbnb in Montreal?
Guests in Montreal stay about 10 nights on average, generating roughly 151,952 reservations and 21.7 bookings per listing in the latest AirROI dataset. The most common check-in time is 4:00 PM and check-out is 11:00 AM.
Monthly Length of Stay in Montreal
Check-in Time Distribution
Check-out Time Distribution
Stay Pattern Insights for Montreal
- Longer stays mean fewer turnovers and lower cleaning costs per revenue dollar. This pattern also opens the door to monthly discount strategies that attract remote workers and extended-stay travelers.
- At 21.7 bookings per listing, the turnover rate is high. Hosts with streamlined operations (self-check-in, automated messaging, reliable cleaners) have a structural advantage.
- Stay lengths peak in Nov (8.5 nights) and shorten in May (4.6 nights). Adjust minimum-night requirements seasonally to match.
Recommendations for Hosts
- Leverage the longer-stay pattern by offering weekly discounts — even 5-10% off can convert browsing into bookings for guests considering an extended stay.
- Set your check-in time to match or beat the market standard of 4:00 PM. Offering early check-in flexibility can be a low-cost differentiator.
- Monitor length-of-stay seasonality to adjust minimum-night requirements — longer minimums during peak periods maximize revenue while shorter minimums fill gaps in shoulder seasons.
Montreal Airbnb Minimum Stay Requirements Analysis
Distribution of Listings by Minimum Night Requirement
1 Night
827 listings
11.7% of total
2 Nights
618 listings
8.8% of total
3 Nights
73 listings
1% of total
4-6 Nights
272 listings
3.9% of total
7-29 Nights
872 listings
12.4% of total
30+ Nights
4379 listings
62.2% of total
Key Insights
- The most prevalent minimum stay requirement in Montreal is 30+ Nights, adopted by 62.2% of listings. This highlights the market's preference for longer commitments.
- A significant segment (62.2%) caters to monthly stays (30+ nights) in Montreal, pointing to opportunities in the extended-stay market.
Recommendations
- Align with the market by considering a 30+ Nights minimum stay, as 62.2% of Montreal hosts use this setting.
- If feasible, allowing 1-night stays, especially midweek or during low season, could capture last-minute bookings, as only 11.7% currently do.
- Explore offering discounts for stays of 30+ nights to attract the 62.2% of the market seeking extended stays.
- Adjust minimum nights based on seasonality – potentially shorter during low season and longer during peak demand periods in Montreal.
Montreal Airbnb Cancellation Policy Trends Analysis (2026)
Super Strict 30 Days
182 listings
2.6% of total
Limited
493 listings
7% of total
Super Strict 60 Days
150 listings
2.1% of total
Flexible
1032 listings
14.7% of total
Moderate
1195 listings
17% of total
Firm
3215 listings
45.6% of total
Strict
776 listings
11% of total
Cancellation Policy Insights for Montreal
- The prevailing Airbnb cancellation policy trend in Montreal is Firm, used by 45.6% of listings.
- A majority (56.6%) of hosts in Montreal utilize Firm or Strict policies, indicating a market where hosts prioritize booking security.
Recommendations for Hosts
- Consider adopting a Firm policy to align with the 45.6% market standard in Montreal.
- Using a Strict policy might deter some guests, as only 11% of listings use it. Evaluate if potential revenue protection outweighs possible lower booking rates.
- Regularly review your cancellation policy against competitors and market demand shifts in Montreal.
How Much Are Airbnb Cleaning Fees in Montreal?
Cleaning fees in Montreal are meaningful operating levers, not just pass-through charges. What matters most is how often hosts charge them, how high they run relative to market norms, and how large a share of gross revenue they consume.
Cleaning Fee Insights for Montreal
- 82.6% of listings charge a cleaning fee, making it standard practice in Montreal. Guests expect it and factor it into their booking decisions.
- The gap between the average ($805) and median ($86) cleaning fee indicates some high-end properties are pulling the average up considerably.
- Cleaning fees represent 5.9% of gross revenue on average — a modest component of the overall booking price.
Recommendations for Hosts
- Price your cleaning fee competitively against the Montreal median of $86. Fees significantly above market norms can deter bookings, especially for shorter stays.
- Monitor competitor cleaning fees regularly. Airbnb's search algorithm factors in total price, so a well-calibrated cleaning fee can improve your listing's ranking.
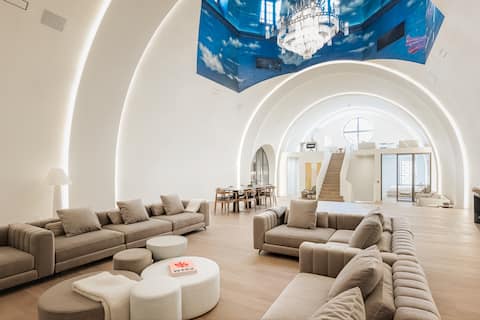
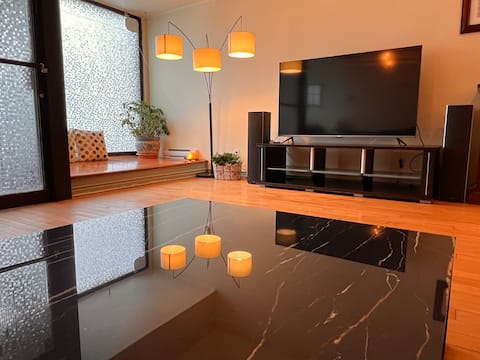
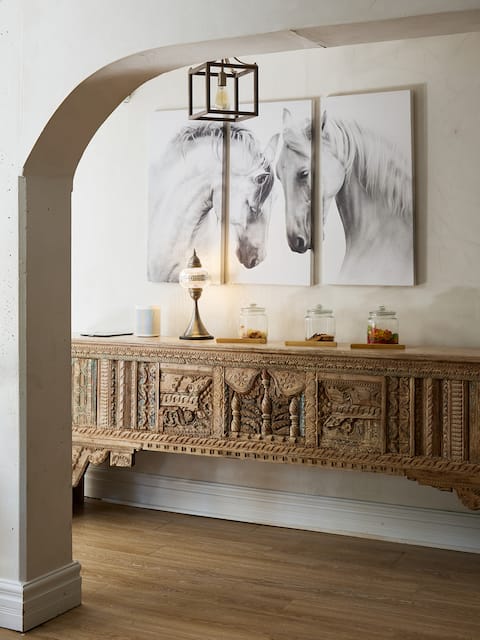
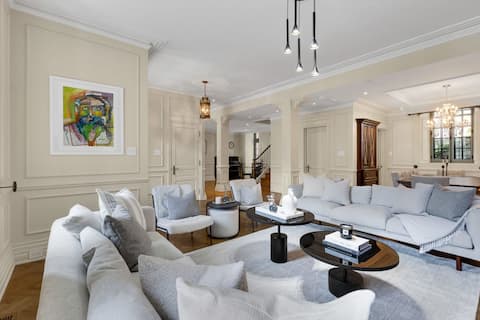
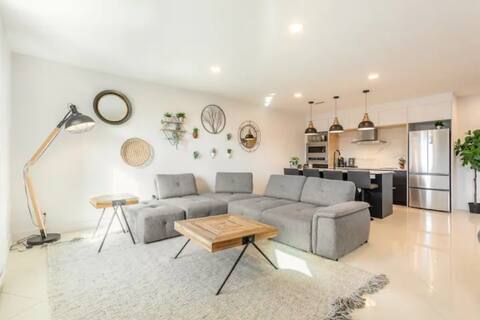
What Do the Top Airbnb Listings in Montreal Look Like?
Benchmark your potential! Explore examples of top-performing Airbnb properties in Montrealbased on Trailing Twelve Month (TTM) revenue. Analyze their characteristics, revenue, occupancy rate, and ADR to understand what drives success in this market.
Iconic 9BR Estate w/ Private Pool, Spa, Rooftop.
Entire Place • 9 bedrooms
Private 3-level Townhouse+8 FullBath+Games+Terrace
Entire Place • 8 bedrooms
Exclusive 6 bed, 6 bath residence in Old Montreal
Entire Place • 6 bedrooms
TownHouse 4BDR-5BA Old Mtl Terrasse/ Parking
Entire Place • 4 bedrooms
The Ultimate Plateau Retreat – 10BR Sleeps 24
Entire Place • 10 bedrooms
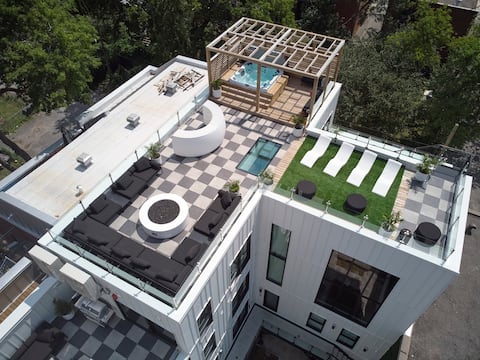
Clubhaus Ultimate VIP Penthouse,Hot Tub,Sleeps 20+
Entire Place • 5 bedrooms
Note: Performance varies based on location, size, amenities, seasonality, and management quality. Data reflects the past 12 months.
Who Are the Top Airbnb Hosts in Montreal?
Learn from the best! This table showcases top-performing Airbnb hosts in Montreal based on the number of properties managed and estimated total revenue over the past year. Analyze their scale and performance metrics.
| Host Name | Properties | Grossing Revenue | Stay Reviews | Avg Rating |
|---|---|---|---|---|
| Louis | 73 | $4,139,394 | 13041 | 4.86/5.0 |
| Unique Stays Montréal | 45 | $1,887,172 | 6526 | 4.86/5.0 |
| U By George | 58 | $1,768,026 | 6757 | 4.75/5.0 |
| LiV MTL | 42 | $1,655,342 | 4424 | 4.86/5.0 |
| Justin | 17 | $1,570,290 | 2004 | 4.77/5.0 |
| Nomade MTL | 26 | $1,553,998 | 2278 | 4.80/5.0 |
| Michael | 14 | $1,472,948 | 2152 | 4.68/5.0 |
| MTLVacationRentals | 18 | $1,457,684 | 3456 | 4.88/5.0 |
| Rachelle | 29 | $1,342,779 | 7978 | 4.82/5.0 |
| Stanzia | 21 | $1,334,778 | 3520 | 4.83/5.0 |
Analyzing the strategies of top hosts, such as their property selection, pricing, and guest communication, can offer valuable lessons for optimizing your own Airbnb operations in Montreal.
Who Are the Airbnb Hosts in Montreal?
Montreal has a relatively balanced host base.
Host Profile Insights for Montreal
- A 46.5% Superhost share is healthy — enough experienced operators to anchor quality without making the market impenetrable for newcomers.
- 15.8% of listings are professionally managed, reflecting a market still dominated by individual hosts.
- 16.2% of listings have Instant Book enabled. Lower Instant Book adoption means many guests must request approval, which can slow conversions.
- 58.8% of listings use Airbnb's simplified pricing (host-only fee), where the host pays the entire platform service fee and the guest sees one all-in price with no separate Airbnb service charge. High adoption signals a professional, PMS-connected host base — Airbnb mandates simplified pricing for software-connected listings.
Recommendations for Hosts
- Earning Superhost status can significantly improve search ranking and guest trust. Focus on maintaining high response rates, low cancellations, and strong reviews.
- Consider enabling Instant Book — it reduces booking friction and Airbnb's algorithm tends to favor Instant Book listings in search results.
- With 41.0% cohosted listings, there may be a growing local market for property management services.
- Benchmark your host metrics against these Montreal averages regularly and adjust your hosting strategy based on what top performers do differently.
Top Professional Management Companies in Montreal
These are the highest-grossing professional property management operations in Montreal, ranked by total revenue across their portfolio. Their performance metrics offer a benchmark for what institutional-level hosting looks like in this market.
| Company | Listings | Revenue | ADR | Occ. | Rating |
|---|---|---|---|---|---|
| Louis | 73 | $4,139,394 | $236 | 66.4% | 4.86/5 |
| Unique Stays Montréal | 45 | $1,887,172 | $161 | 68.0% | 4.86/5 |
| LiV MTL | 42 | $1,655,342 | $338 | 32.6% | 4.86/5 |
| Justin | 17 | $1,570,290 | $414 | 57.7% | 4.77/5 |
| Nomade MTL | 26 | $1,553,998 | $294 | 55.0% | 4.80/5 |
| MTLVacationRentals | 18 | $1,457,684 | $369 | 55.2% | 4.88/5 |
| Rachelle | 29 | $1,342,779 | $191 | 65.5% | 4.82/5 |
| Joe Mckinsey | 18 | $1,298,041 | $597 | 47.1% | 4.60/5 |
| Max | 30 | $1,227,261 | $200 | 59.7% | 4.75/5 |
| Pete | 41 | $1,181,281 | $196 | 52.8% | 4.64/5 |
Management Company Insights for Montreal
- The leading management company, Louis, operates 73 listings with $4,139,394 in gross revenue — a useful benchmark for what scale looks like in Montreal.
- Top managers average 34 properties each, pointing to a market where portfolio scale is a meaningful competitive factor.
- Professionally managed listings in the top tier average 4.78/5 in guest ratings — demonstrating that scale and quality can coexist.
Recommendations
- With only 15.8% of listings professionally managed, there may be an opportunity to differentiate through more structured operations and consistent guest experiences.
- Study how top management companies price, position, and maintain their portfolios — their ADR and occupancy rates reflect strategies refined across dozens of listings.
- If you're considering hiring a property manager, compare their portfolio performance against these benchmarks before committing.
How Does Montreal's Airbnb Market Compare to Nearby Cities?
How does the Montreal Airbnb market stack up against its neighbors? Compare key performance metrics like average monthly revenue, ADR, and occupancy rates in surrounding areas to understand the broader regional STR landscape.
Compared with Johnson, Montreal has 0 percentage points higher occupancy and about $140 lower ADR. That helps frame whether this market is winning more on demand, pricing, or both.
| Market | Active Properties | Monthly Revenue | Daily Rate | Avg. Occupancy |
|---|---|---|---|---|
| Mille-Isles | 89 | $5,704 | $531.00 | 36% |
| Malletts Bay | 48 | $4,932 | $495.45 | 40% |
| Stowe | 901 | $4,738 | $563.94 | 39% |
| Venise-en-Québec | 17 | $4,122 | $425.78 | 39% |
| Wilmington | 135 | $4,109 | $355.37 | 39% |
| La Conception | 176 | $4,078 | $354.87 | 40% |
| Saint-Denis-de-Brompton | 31 | $3,997 | $411.08 | 33% |
| Johnson | 36 | $3,986 | $303.83 | 48% |
| Grenville-sur-la-Rouge | 30 | $3,944 | $424.91 | 37% |
| Stanstead (Canton) | 36 | $3,943 | $269.69 | 48% |
Frequently Asked Questions About Airbnb in Montreal
These quick answers summarize the most common investor and operator questions using AirROI's latest market data for Montreal.
How much do Airbnb hosts make in Montreal?
Montreal hosts earn about $21,204 per year on average, with an average nightly rate of $164 and RevPAR of $84. Those figures describe the typical revenue environment for active listings in Montreal, Quebec, not the ceiling for the best operators. Source: AirROI 2026 data, Montreal market, July 2025 to June 2026.
What is the average Airbnb occupancy rate in Montreal?
The average Airbnb occupancy rate in Montreal is 47.6%. August is the strongest month and January is the softest, so hosts should expect demand to move meaningfully throughout the year rather than stay flat.
What is the average Airbnb daily rate in Montreal?
Listings in Montreal average $164 per night. The broader pricing spread also matters: lower-performing listings cluster closer to the lower quartiles, while premium homes can price materially above the city average when demand spikes or listing quality stands out.
How many Airbnb listings are active in Montreal?
Montreal currently has about 7,044 active Airbnb listings in AirROI's market dataset. That supply count helps explain how competitive the market is, how much depth there is for benchmarking, and whether the market behaves like a niche destination or a scaled urban market.
How strict are short-term rental regulations in Montreal?
AirROI currently classifies the short-term rental regulation level in Montreal as High. The dataset also shows about 67.3% of listings with registration evidence. That is a market signal, not legal advice, so hosts should still confirm current licensing and compliance rules locally before listing.
What is the RevPAR for Airbnb in Montreal?
RevPAR in Montreal is about $84. That metric combines pricing and occupancy into one efficiency number, so it is often a better quick benchmark than ADR alone when investors want to compare how well listings convert nightly rates into realized revenue.
Is Airbnb profitable in Montreal?
At 47.6% occupancy, Montreal can be profitable — but margins depend heavily on operating costs, property acquisition price, and how well hosts optimize pricing across seasons. Average annual revenue is $21,204, but individual returns depend on property type, location within the city, and the host's operating efficiency.
How far in advance do guests book Airbnb in Montreal?
The average booking lead time in Montreal is about 50 days — a longer planning horizon typical of destination or vacation markets where travelers book well in advance. Hosts who understand their market's booking cadence can adjust minimum stays and pricing windows accordingly.
What are the best neighborhoods for Airbnb in Montreal?
Based on AirROI's analysis, some of the top neighborhoods for short-term rentals in Montreal include Plateau-Mont-Royal, Old Montreal, Downtown Montreal. Each area attracts different guest profiles — from business travelers to leisure visitors — so the best location depends on the property type and target audience a host is aiming for. See the full neighborhood breakdown above.
What type of property performs best on Airbnb in Montreal?
entire_home listings make up 85.0% of the active supply in Montreal. The most common configuration does not always mean the most profitable — operators who identify underserved property types or bedroom counts can sometimes outperform the market average by filling a gap in local supply.
How does Montreal compare to nearby Airbnb markets?
Among neighboring markets, Mille-Isles posts $68,453 in average annual revenue with 36.3% occupancy, compared to Montreal's $21,204 and 47.6%. Comparing nearby markets helps investors understand whether a destination's performance reflects local demand or broader regional trends.
What is the average length of stay in Montreal?
The average Airbnb stay length in Montreal is about 10 nights. That matters for turnover, cleaning operations, and pricing strategy because shorter stays increase changeovers while longer stays can smooth occupancy and reduce operational friction.
What is the average Airbnb guest rating in Montreal?
Airbnb listings in Montreal average 4.72 out of 5 overall. About 27.8% of listings carry the guest favorite badge, which suggests a meaningful share of inventory is competing on review quality rather than price alone.
Which amenities boost Airbnb revenue in Montreal?
Air conditioning and TV are among the strongest revenue-linked amenities in Montreal. In AirROI's latest dataset, listings with these amenities outperform those without on average revenue, which makes amenities analysis useful for prioritizing investment and listing upgrades.
Do Airbnb hosts charge cleaning fees in Montreal?
Yes. About 82.6% of active Airbnb listings in Montreal charge a cleaning fee, and the average fee is $805. The more important operating benchmark is how much of gross revenue that fee consumes, not just the absolute dollar amount.
What percentage of Airbnb hosts are Superhosts in Montreal?
A 46.5% Superhost rate signals a highly competitive market where review quality and responsiveness are table stakes, not differentiators.
About AirROI Market Data
AirROI tracks over 20 million properties across 190+ countries and maintains 15+ years of historical performance data, making it one of the deepest Airbnb and STR intelligence platforms available. The analytics pipeline aggregates listing-level data monthly — revenue, occupancy, nightly rates, RevPAR, guest demographics, booking patterns, and competitive supply — so investors and operators can benchmark any market against its own history and against neighboring destinations.
Real estate investors, property managers, financial institutions, hedge funds, tourism boards, hospitality consultants, tech platforms, and academic researchers rely on AirROI data to underwrite acquisitions, optimize pricing, model macro trends, and conduct peer-reviewed research. Data is available through in-depth market reports like this one and the Airbnb API with 22 endpoints and an Airbnb MCP Server for AI agents.
AirROI proprietary analytics as of 2026-06-30. Metrics reflect trailing twelve-month aggregates from active listings. Revenue figures are market averages, not projections. Neighborhood descriptions are AI-generated and reviewed for accuracy. For full methodology, see the data methodology page.