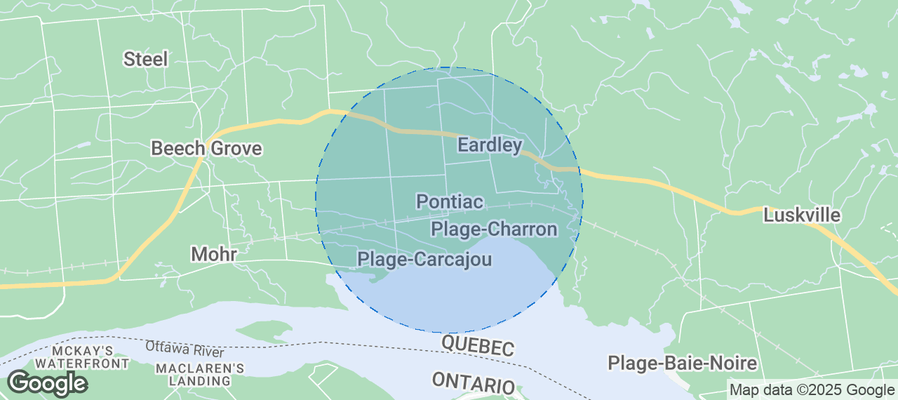
Pontiac Airbnb Market Analysis 2026: Short Term Rental Data & Vacation Rental Statistics in Quebec, Canada
Is Airbnb profitable in Pontiac in 2026? Explore comprehensive Airbnb analytics for Pontiac, Quebec, Canada to uncover income potential. This 2026 STR market report for Pontiac, based on AirROI data from February 2025 to January 2026, reveals key trends in the niche market of 21 active listings.
Whether you're considering an Airbnb investment in Pontiac, optimizing your existing vacation rental, or exploring rental arbitrage opportunities, understanding the Pontiac Airbnb data is crucial. Navigating the high regulation landscape is key to maximizing your short term rental income potential. Let's dive into the specifics.
Key Pontiac Airbnb Performance Metrics Overview
Monthly Airbnb Revenue Variations & Income Potential in Pontiac (2026)
Understanding the monthly revenue variations for Airbnb listings in Pontiac is key to maximizing your short term rental income potential. Seasonality significantly impacts earnings. Our analysis, based on data from the past 12 months, shows that the peak revenue month for STRs in Pontiac is typically July, while January often presents the lowest earnings, highlighting opportunities for strategic pricing adjustments during shoulder and low seasons. Explore the typical Airbnb income in Pontiac across different performance tiers:
- Best-in-class properties (Top 10%) achieve $7,585+ monthly, often utilizing dynamic pricing and superior guest experiences.
- Strong performing properties (Top 25%) earn $4,740 or more, indicating effective management and desirable locations/amenities.
- Typical properties (Median) generate around $2,236 per month, representing the average market performance.
- Entry-level properties (Bottom 25%) see earnings around $1,079, often with potential for optimization.
Average Monthly Airbnb Earnings Trend in Pontiac
Pontiac Airbnb Occupancy Rate Trends (2026)
Maximize your bookings by understanding the Pontiac STR occupancy trends. Seasonal demand shifts significantly influence how often properties are booked. Typically, Augustsees the highest demand (peak season occupancy), while January experiences the lowest (low season). Effective strategies, like adjusting minimum stays or offering promotions, can boost occupancy during slower periods. Here's how different property tiers perform in Pontiac:
- Best-in-class properties (Top 10%) achieve 73%+ occupancy, indicating high desirability and potentially optimized availability.
- Strong performing properties (Top 25%) maintain 55% or higher occupancy, suggesting good market fit and guest satisfaction.
- Typical properties (Median) have an occupancy rate around 34%.
- Entry-level properties (Bottom 25%) average 21% occupancy, potentially facing higher vacancy.
Average Monthly Occupancy Rate Trend in Pontiac
Average Daily Rate (ADR) Airbnb Trends in Pontiac (2026)
Effective short term rental pricing strategy in Pontiac involves understanding monthly ADR fluctuations. The Average Daily Rate (ADR) for Airbnb in Pontiac typically peaks in July and dips lowest during November. Leveraging Airbnb dynamic pricing tools or strategies based on this seasonality can significantly boost revenue. Here's a look at the typical nightly rates achieved:
- Best-in-class properties (Top 10%) command rates of $400+ per night, often due to premium features or locations.
- Strong performing properties (Top 25%) achieve nightly rates of $278 or more.
- Typical properties (Median) charge around $171 per night.
- Entry-level properties (Bottom 25%) earn around $123 per night.
Average Daily Rate (ADR) Trend by Month in Pontiac
Get Live Pontiac Market Intelligence 👇
Explore Real-time Analytics
Airbnb Seasonality Analysis & Trends in Pontiac (2026)
Peak Season (July, August, October)
- Revenue averages $4,973 per month
- Occupancy rates average 55.8%
- Daily rates average $234
Shoulder Season
- Revenue averages $2,997 per month
- Occupancy maintains around 37.1%
- Daily rates hold near $221
Low Season (January, February, November)
- Revenue drops to average $2,041 per month
- Occupancy decreases to average 27.3%
- Daily rates adjust to average $202
Seasonality Insights for Pontiac
- The Airbnb seasonality in Pontiac shows highly seasonal trends requiring careful strategy. While the sections above show seasonal averages, it's also insightful to look at the extremes:
- During the high season, the absolute peak month showcases Pontiac's highest earning potential, with monthly revenues capable of climbing to $5,472, occupancy reaching a high of 61.5%, and ADRs peaking at $249.
- Conversely, the slowest single month of the year, typically falling within the low season, marks the market's lowest point. In this month, revenue might dip to $1,625, occupancy could drop to 22.9%, and ADRs may adjust down to $195.
- Understanding both the seasonal averages and these monthly peaks and troughs in revenue, occupancy, and ADR is crucial for maximizing your Airbnb profit potential in Pontiac.
Seasonal Strategies for Maximizing Profit
- Peak Season: Maximize revenue through premium pricing and potentially longer minimum stays. Ensure high availability.
- Low Season: Offer competitive pricing, special promotions (e.g., extended stay discounts), and flexible cancellation policies. Target off-season travelers like remote workers or budget-conscious guests.
- Shoulder Seasons: Implement dynamic pricing that balances peak and low rates. Target weekend travelers or specific events. Offer slightly more flexible terms than peak season.
- Regularly analyze your own performance against these Pontiac seasonality benchmarks and adjust your pricing and availability strategy accordingly.
Best Areas for Airbnb Investment in Pontiac (2026)
Exploring the top neighborhoods for short-term rentals in Pontiac? This section highlights key areas, outlining why they are attractive for hosts and guests, along with notable local attractions. Consider these locations based on your target guest profile and investment strategy.
| Neighborhood / Area | Why Host Here? (Target Guests & Appeal) | Key Attractions & Landmarks |
|---|---|---|
| Downtown Pontiac | Central hub of activities and amenities, with easy access to restaurants, shops, and attractions. Ideal for guests looking to explore local culture and enjoy city life. | Pontiac Marina, Main Street shops, Local cafes, Pontiac Historical Society, Festivals and events center |
| Lac des Sables | Beautiful lakefront area perfect for outdoor enthusiasts. Offers access to water activities, hiking trails, and a peaceful environment for vacationers. | Lac des Sables, Beach access, Hiking trails, Picnic areas, Water sports rentals |
| Parc de la Gatineau | A stunning natural park that draws nature lovers and outdoor adventurers. Perfect for guests looking to experience the great outdoors close to Pontiac. | Hiking trails, Biking paths, Wildlife watching, Scenic viewpoints, Winter sports activities |
| Bristol | Quaint village atmosphere with access to cultural heritage sites. Ideal for guests looking for a serene getaway that is still close to urban amenities. | Bristol Village heritage sites, Local art galleries, Agricultural fairs, Sandy beach at the Ottawa River, Seasonal farmers' market |
| Quyon | A charming riverside community known for its stunning views and outdoor activities. Perfect for families and groups looking for a quaint place to stay and enjoy nature. | Ottawa River, Quyon ferry, Fishing spots, Local restaurants, Nature trails |
| Shawville | A town rich in history and community spirit, offering a mix of local dining, shopping, and outdoor activities, appealing to those who want to immerse themselves in local culture. | Shawville Fair, Public parks, Craft shops, Local dining spots, Nature walks |
| Campbell's Bay | Offers a blend of natural beauty and small-town charm, perfect for guests looking for a tranquil escape near outdoor recreational opportunities. | Ottawa River access, Local parks, Fishing and boating, Hiking trails, Community events |
| Chichester | Nestled in nature with easy access to adventure activities, ideal for those looking for a place to relax and enjoy the scenic beauty of the region. | Scenic viewpoints, Hiking trails, Local fishing spots, Wildlife observation, Community trails |
Understanding Airbnb License Requirements & STR Laws in Pontiac (2026)
Yes, Pontiac, Quebec, Canada enforces high STR regulations. Obtaining a license and ensuring compliance is almost certainly required according to current 2026 STR laws. Always verify the latest short term rental regulations and Airbnb license requirements directly with local government authorities for Pontiac to ensure full compliance before hosting.
(Source: AirROI data, 2026, based on 81% licensed listings)
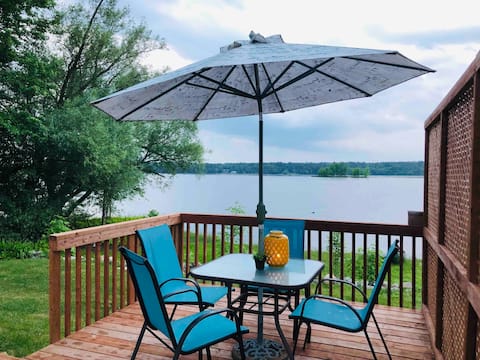
Top Performing Airbnb Properties in Pontiac (2026)
Benchmark your potential! Explore examples of top-performing Airbnb properties in Pontiacbased on Trailing Twelve Month (TTM) revenue. Analyze their characteristics, revenue, occupancy rate, and ADR to understand what drives success in this market.
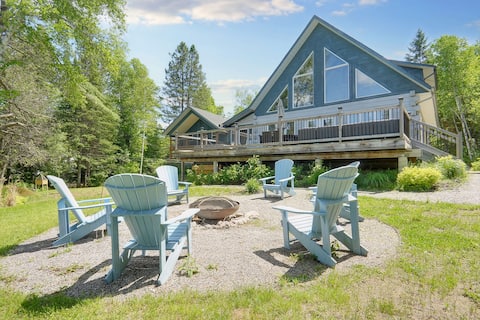
The Lake Escape - Waterfront, Hot Tub Sleeps 14!
Entire Place • 6 bedrooms
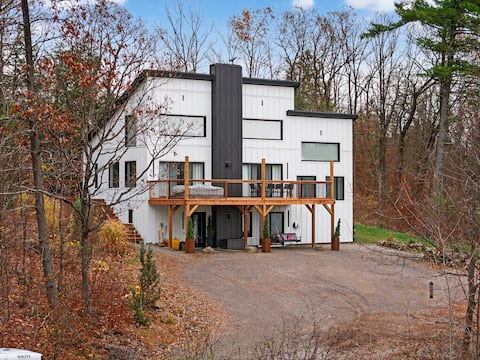
Waterfront Getaway w/ Enclosed Hot Tub + Fire Pits
Entire Place • 4 bedrooms
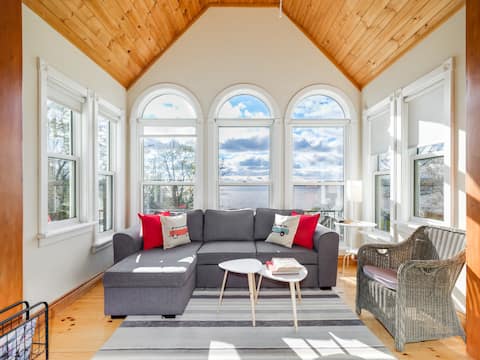
Stunning waterfront home, 25min to downtown Ottawa
Entire Place • 4 bedrooms
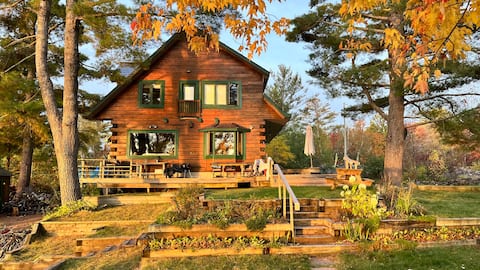
The Beacon - Lakefront Log Home for Families
Entire Place • 4 bedrooms
Pontiac cottage on the waterfront CITQ#: 294234
Entire Place • 2 bedrooms

Chalet Échappée/650 sq. ft. on the water
Entire Place • 2 bedrooms
Note: Performance varies based on location, size, amenities, seasonality, and management quality. Data reflects the past 12 months.
Top Performing Airbnb Hosts in Pontiac (2026)
Learn from the best! This table showcases top-performing Airbnb hosts in Pontiac based on the number of properties managed and estimated total revenue over the past year. Analyze their scale and performance metrics.
| Host Name | Properties | Grossing Revenue | Stay Reviews | Avg Rating |
|---|---|---|---|---|
| Luis | 1 | $92,090 | 41 | 4.93/5.0 |
| Scott | 1 | $91,025 | 117 | 4.99/5.0 |
| Breathe Vacation Rentals | 1 | $63,137 | 97 | 4.73/5.0 |
| Anton & Colette | 1 | $62,836 | 5 | 5.00/5.0 |
| Alain | 1 | $37,681 | 354 | 4.96/5.0 |
| Isabelle | 1 | $21,086 | 9 | 5.00/5.0 |
| Julie | 1 | $18,736 | 32 | 4.66/5.0 |
| Steeve | 2 | $16,684 | 319 | 4.70/5.0 |
| John Inca | 1 | $16,340 | 7 | 5.00/5.0 |
| Brett | 1 | $11,292 | 27 | 4.78/5.0 |
Analyzing the strategies of top hosts, such as their property selection, pricing, and guest communication, can offer valuable lessons for optimizing your own Airbnb operations in Pontiac.
Dive Deeper: Advanced Pontiac STR Market Data (2026)
Ready to unlock more insights? AirROI provides access to advanced metrics and comprehensive Airbnb data for Pontiac. Explore detailed analytics beyond this report to refine your investment strategy, optimize pricing, and maximize your vacation rental profits.
Explore Advanced MetricsPontiac Short-Term Rental Market Composition (2026): Property & Room Types
Room Type Distribution
Property Type Distribution
Market Composition Insights for Pontiac
- The Pontiac Airbnb market composition is heavily skewed towards Entire Home/Apt listings, which make up 100% of the 21 active rentals. This indicates strong guest preference for privacy and space.
- Looking at the property type distribution in Pontiac, House properties are the most common (76.2%), reflecting the local real estate landscape.
- Houses represent a significant 76.2% portion, catering likely to families or larger groups.
- The presence of 9.5% Hotel/Boutique listings indicates integration with traditional hospitality.
- Smaller segments like others, outdoor/unique, unique stays (combined 14.4%) offer potential for unique stay experiences.
Pontiac Airbnb Room Capacity Analysis (2026): Bedroom Distribution
Distribution of Listings by Number of Bedrooms
Room Capacity Insights for Pontiac
- The dominant room capacity in Pontiac is 4 bedrooms listings, making up 42.9% of the market. This suggests a strong demand for properties suitable for families or small groups.
- Together, 4 bedrooms and 1 bedroom properties represent 61.9% of the active Airbnb listings in Pontiac, indicating a high concentration in these sizes.
- A significant 61.9% of listings offer 3+ bedrooms, catering to larger groups and families seeking more space in Pontiac.
Pontiac Vacation Rental Guest Capacity Trends (2026)
Distribution of Listings by Guest Capacity
Guest Capacity Insights for Pontiac
- The most common guest capacity trend in Pontiac vacation rentals is listings accommodating 8+ guests (47.6%). This suggests the primary traveler segment is likely larger groups.
- Properties designed for 8+ guests and 6 guests dominate the Pontiac STR market, accounting for 66.6% of listings.
- 66.6% of properties accommodate 6+ guests, serving the market segment for larger families or group travel in Pontiac.
- On average, properties in Pontiac are equipped to host 6.1 guests.
Pontiac Airbnb Booking Patterns (2026): Available vs. Booked Days
Available Days Distribution
Booked Days Distribution
Booking Pattern Insights for Pontiac
- The most common availability pattern in Pontiac falls within the 271-366 days range, representing 66.7% of listings. This suggests many properties have significant open periods on their calendars.
- Approximately 76.2% of listings show high availability (181+ days open annually), indicating potential for increased bookings or specific owner usage patterns.
- For booked days, the 1-30 days range is most frequent in Pontiac (33.3%), reflecting common guest stay durations or potential owner blocking patterns.
- A notable 23.8% of properties secure long booking periods (181+ days booked per year), highlighting successful long-term rental strategies or significant owner usage.
Pontiac Airbnb Minimum Stay Requirements Analysis
Distribution of Listings by Minimum Night Requirement
1 Night
1 listings
4.8% of total
2 Nights
4 listings
19% of total
3 Nights
2 listings
9.5% of total
4-6 Nights
1 listings
4.8% of total
7-29 Nights
2 listings
9.5% of total
30+ Nights
11 listings
52.4% of total
Key Insights
- The most prevalent minimum stay requirement in Pontiac is 30+ Nights, adopted by 52.4% of listings. This highlights the market's preference for longer commitments.
- A significant segment (52.4%) caters to monthly stays (30+ nights) in Pontiac, pointing to opportunities in the extended-stay market.
Recommendations
- Align with the market by considering a 30+ Nights minimum stay, as 52.4% of Pontiac hosts use this setting.
- If feasible, allowing 1-night stays, especially midweek or during low season, could capture last-minute bookings, as only 4.8% currently do.
- Explore offering discounts for stays of 30+ nights to attract the 52.4% of the market seeking extended stays.
- Adjust minimum nights based on seasonality – potentially shorter during low season and longer during peak demand periods in Pontiac.
Pontiac Airbnb Cancellation Policy Trends Analysis (2026)
Limited
2 listings
9.5% of total
Flexible
3 listings
14.3% of total
Moderate
5 listings
23.8% of total
Firm
10 listings
47.6% of total
Strict
1 listings
4.8% of total
Cancellation Policy Insights for Pontiac
- The prevailing Airbnb cancellation policy trend in Pontiac is Firm, used by 47.6% of listings.
- A majority (52.4%) of hosts in Pontiac utilize Firm or Strict policies, indicating a market where hosts prioritize booking security.
- Strict cancellation policies are quite rare (4.8%), potentially making listings with this policy less competitive unless justified by high demand or property type.
Recommendations for Hosts
- Consider adopting a Firm policy to align with the 47.6% market standard in Pontiac.
- Using a Strict policy might deter some guests, as only 4.8% of listings use it. Evaluate if potential revenue protection outweighs possible lower booking rates.
- Regularly review your cancellation policy against competitors and market demand shifts in Pontiac.
Pontiac STR Booking Lead Time Analysis (2026)
Average Booking Lead Time by Month
Booking Lead Time Insights for Pontiac
- The overall average booking lead time for vacation rentals in Pontiac is 46 days.
- Guests book furthest in advance for stays during August (average 92 days), likely coinciding with peak travel demand or local events.
- The shortest booking windows occur for stays in March (average 25 days), indicating more last-minute travel plans during this time.
- Seasonally, Summer (72 days avg.) sees the longest lead times, while Spring (47 days avg.) has the shortest, reflecting typical travel planning cycles.
Recommendations for Hosts
- Use the overall average lead time (46 days) as a baseline for your pricing and availability strategy in Pontiac.
- For August stays, consider implementing length-of-stay discounts or slightly higher rates for bookings made less than 92 days out to capitalize on advance planning.
- Target marketing efforts for the Summer season well in advance (at least 72 days) to capture early planners.
- Monitor your own booking lead times against these Pontiac averages to identify opportunities for dynamic pricing adjustments.
Popular & Essential Airbnb Amenities in Pontiac (2026)
Amenity Prevalence
Amenity Insights for Pontiac
- Essential amenities in Pontiac that guests expect include: Smoke alarm, Free parking on premises, Fire extinguisher, Hot water, Heating. Lacking these (any) could significantly impact bookings.
- Popular amenities like Kitchen, Wifi, Bed linens are common but not universal. Offering these can provide a competitive edge.
- Warning: Wifi is not universally provided but is considered essential globally. Ensure reliable Wifi is offered.
Recommendations for Hosts
- Ensure your listing includes all essential amenities for Pontiac: Smoke alarm, Free parking on premises, Fire extinguisher, Hot water, Heating.
- Prioritize adding missing essentials: Fire extinguisher, Hot water, Heating.
- Consider adding popular differentiators like Kitchen or Wifi to increase appeal.
- Highlight unique or less common amenities you offer (e.g., hot tub, dedicated workspace, EV charger) in your listing description and photos.
- Regularly check competitor amenities in Pontiac to stay competitive.
Pontiac Airbnb Guest Demographics & Profile Analysis (2026)
Guest Profile Summary for Pontiac
- The typical guest profile for Airbnb in Pontiac consists of primarily domestic travelers (88%), often arriving from nearby Ottawa, typically belonging to the Post-2000s (Gen Z/Alpha) group (50%), primarily speaking English or French.
- Domestic travelers account for 87.8% of guests.
- Key international markets include Canada (87.8%) and United States (4.4%).
- Top languages spoken are English (50%) followed by French (27.6%).
- A significant demographic segment is the Post-2000s (Gen Z/Alpha) group, representing 50% of guests.
Recommendations for Hosts
- Target domestic marketing efforts towards travelers from Ottawa and Toronto.
- Tailor amenities and listing descriptions to appeal to the dominant Post-2000s (Gen Z/Alpha) demographic (e.g., highlight fast WiFi, smart home features, local guides).
- Highlight unique local experiences or amenities relevant to the primary guest profile.
- Consider seasonal promotions aligned with peak travel times for key origin markets.
Nearby Short-Term Rental Market Comparison
How does the Pontiac Airbnb market stack up against its neighbors? Compare key performance metrics like average monthly revenue, ADR, and occupancy rates in surrounding areas to understand the broader regional STR landscape.
| Market | Active Properties | Monthly Revenue | Daily Rate | Avg. Occupancy |
|---|---|---|---|---|
| Thorne | 11 | $3,847 | $221.83 | 66% |
| Cantley | 19 | $3,753 | $266.04 | 51% |
| Lac-Simon | 24 | $3,599 | $443.52 | 27% |
| Rossmore | 10 | $3,551 | $269.66 | 59% |
| Val-des-Monts | 123 | $3,077 | $255.71 | 46% |
| Westport | 13 | $2,984 | $350.53 | 30% |
| Front of Yonge | 11 | $2,919 | $257.85 | 45% |
| Asphodel-Norwood | 16 | $2,876 | $286.81 | 42% |
| Prince Edward County | 13 | $2,852 | $274.73 | 44% |
| Picton | 220 | $2,700 | $252.26 | 47% |